I. INTRODUCTION
In earlier work,Reference Wolf, Zong, Meng, Orana, Rahbar, Balss, Papandreou, Maryanoff and Soboyejo1–Reference Meng, Orana, Tan, Wolf, Rahbar, Li, Papandreou, Maryanoff and Soboyejo3 we presented a range of atomic force microscopy and fracture mechanics techniques for the measurement of adhesion and interfacial fracture toughness for the polymeric films on hard substrates. The methods were applied largely to the characterization of adhesion in drug-eluting stents (DESs) with thin-film drug coatings on their surfaces. The first generation of such systems had thin conformal coatings in direct contact with the underlying metallic scaffold. For example, the CYPHER® Sirolimus-eluting Coronary StentReference Meng, Orana, Tan, Wolf, Rahbar, Li, Papandreou, Maryanoff and Soboyejo3 (Cordis, Springhouse, PA) consists of a coating of a Parylene-C primer layer, and a drug-eluting layer of sirolimus, poly(n-butyl methacrylate), and poly(ethylene-co-vinyl acetate) on 316L stainless steel scaffold.
In an effort to evaluate adhesion between the layers of the coating, and also between the coating and the substrate, surface pairs were identified to represent both the individual components and the complete chemistry of each layer. Coated atomic force microscope (AFM) tips and two-dimensional coupons, which act as surrogates to the substrate, were prepared and characterized. Force measurements were then obtained to evaluate the adhesion between all the possible interfaces within the coating and between the coating and the substrate.
The interfacial fracture energy release rate, G, was also calculated with the application of the adhesion and fracture mechanics models. The predictions from the models were then validated using independent Brazil disk tests that were conducted on model specimens that contained interfaces that mimic those between the layers in the coating. The measurements of interfacial fracture toughness were then obtained over a range of mode mixities that range from pure mode I and mode II.
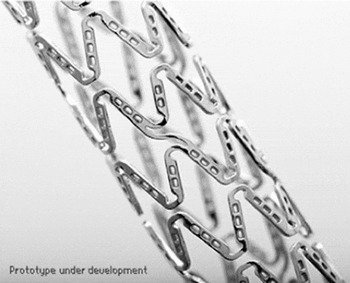
In this work, we extend our efforts to the case of suspended films with partial contact with their substrates (Fig. 1). This investigation is based on a model NEVO™ Sirolimus-eluting Coronary Stent (NEVO™ SES; Cordis Corporation, Warren, NJ) consisting of a formulation of sirolimus drug and a degradable polymer poly(D,L-lactide-co-glycolide) (PLGA), suspended within several hundred L605 Co–Cr alloy reservoirs (length 120 μm × width 80 μm × depth 100 μm). Shan et al.Reference Shan, Du, Hampp, Li, Papandreou, Maryanoff and Soboyejo4 have described the development of a novel push-out test to measure the adhesion force between the suspended polymeric films and the substrate, as well as the cohesion force within the films. However, the interfacial fracture energy release rate was not obtained in the earlier study by Shan et al.Reference Shan, Du, Hampp, Li, Papandreou, Maryanoff and Soboyejo4
Optical microscopy image of NEVO™ SES.

This paper uses AFM to evaluate the intermolecular adhesion energy between the suspended film and stent of the NEVO™ SES. A combination of adhesion and fracture mechanics theories is then used to estimate interfacial fracture. The effects of mode mixity are then modeled using a zone-shielding model. The results are incorporated into finite element simulation of drug push-out tests. The simulations are in good agreement with experimental force measurements obtained from drug push-out tests.
II. MODELING
A. AFM force measurements and tip calibration
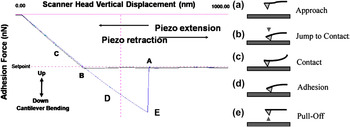
The steps of AFM adhesion measurements are summarized in Fig. 2.5 First, the AFM tips were dip coated before lowering them toward the substrate surface at a constant velocity [Fig. 2(a)]. As the probe approaches the surface under ambient conditions, the tip experiences negligible interactions with the surrounding medium and the tip deflection remains close to zero. However, as the tip is lowered further down, it is eventually pulled into contact with the surface by adhesive force interactions [Fig. 2(b)] between the tip of the probe and the substrate. Subsequently, the scanner continues to move down but with the substrate and probe in continuous contact. This causes the tip to bend [Fig. 2(c)] under elastic deformation. Upon reversal of the direction of tip displacement, the scanner head is raised and the tip’s elastic deformation is reversed. However, residual adhesive interactions prevent the tip from detaching from the substrate’s surface at zero loads [Fig. 2(d)]. Hence, the reversed loading of the tip must be continued until the adhesive forces are eventually overcome at a negative force that corresponds to the pull-off force [Fig. 2(e)]. The measured displacement deflection can then be related to the adhesion force via Hooke’s law. This gives

Schematics illustrating AFM pull-off force measurement.5

where k is the spring constant and x is the tip displacement. However, the accuracy of the AFM measurements of the adhesion force depends significantly on the careful measurement of the spring constant, k, of the AFM cantilever tip.
Although the values for the spring constant are provided by most tip manufacturers, these are batch estimates that are often significantly different from the actual values for each tip. Hence, the thermal tune methodReference Serry6 provides a real-time and accurate method for the measurement of spring constants. It measures the tip response in the presence of thermal agitations and then uses a Lorentzian line shape fit to obtain an accurate estimate of the spring constant from the resulting frequency spectrum of harmonic oscillations.
B. Adhesion energy theories
This section presents a review of theories that have been proposed for the characterization of the adhesive interactions.Reference Johnson, Kendall and Roberts7–Reference Maugis9 The Johnson–Kendall–Roberts (JKR) modelReference Johnson, Kendall and Roberts7 describes the contact between soft materials with short range, strong adhesion forces, and large tip radii. It gives the adhesion energy as:
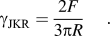
In contrast, the Derjaguin–Muller–Toporov (DMT) modelReference Derjaguin8 applies to adhesion between stiff materials with long range, weak adhesion forces, and small tip radii. It gives the adhesion energy as:
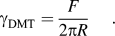
Intermediate between the JKR and DMT models, the Maugis–Dugdale (MD) modelReference Maugis9 proposes an analytical solution. To select the appropriate model, the transition parameter, λ, is defined byReference Maugis9:
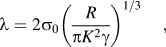
where γ is the adhesion energy per unit area; R is the combined radius given by R = R 1R 2/(R 1 + R 2), where R 1 and R 2 are the radii of the two spheres, respectively; K is the combined elastic modulus for two spheres in contact, which is given by  , where E 1 and E 2 are the elastic moduli of the two spheres and
 and
 are the Poisson ratios of the two spheres, respectively. σ0 is assumed to be a constant adhesive stress that acts over a displacement range of δt, which gives the adhesion energy as
 . By choosing σ0 to match the minimum adhesive stress of a Lennard–Jones potential with equilibrium separation distance z 0, it follows that δt = 0.97z 0. The JKR model applies when λ > 5. The DMT model applies when λ < 0.1. The MD model applies for the intermediate values of λ.
C. Interfacial failure zone model
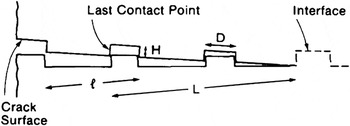
Although the adhesion theories described above can be used to estimate the interfacial energy corresponding to mode I fracture, they do not capture the shielding effects that occur due to nonplanar asperity contacts at mode mixities greater than zero.Reference Rahbar, Wolf, Orana, Fennimore, Zong, Meng, Papandreou, Maryanoff and Soboyejo2, Reference Meng, Orana, Tan, Wolf, Rahbar, Li, Papandreou, Maryanoff and Soboyejo3, Reference Venkatesh10 Such effects can be modeled using an idealized geometry corresponding to contacts in the zone modelReference Evans and Hutchinson11 shown schematically in Fig. 3. Here, l is the spacing between microcracks, D is the facet length, H is the facet height, and L is the contact zone size. Note that the model neglects friction. It is also assumed that, within the contact zone, the shear stresses and displacements are elastic and analogous to those associated with a linear array of microcracks or an equivalent array of bridges.Reference Budiansky, Amazigo and Evans12 The mode mixity ψ is defined by the phase angle of loading, such that  , where K I and K II are the stress intensity factor of mode I and mode II, respectively. The crack tip shielding is thus given byReference Evans and Hutchinson11:

Zone configuration for zone model.Reference Evans and Hutchinson11

where  is the reduction in crack energy release rate, i.e., the shielding, caused by the contact locking of facet,
 is a material property parameter, E is Young’s modulus, ν is the Poisson ratio, and k is a function of α defined by Evans and Hutchinson.Reference Evans and Hutchinson11
D. Finite element modeling
In the suspended film push-out tests, a tungsten probe was used to apply the load on thin suspended films surrounded by hard substrates. Finite element modeling was performed using the ABAQUS software package (Dassault Systemes Simulia Corporation, Providence, RI). This was used to simulate the push-out test process. It was also used to calculate the critical force required for adhesive failure between the suspended films and reservoirs.
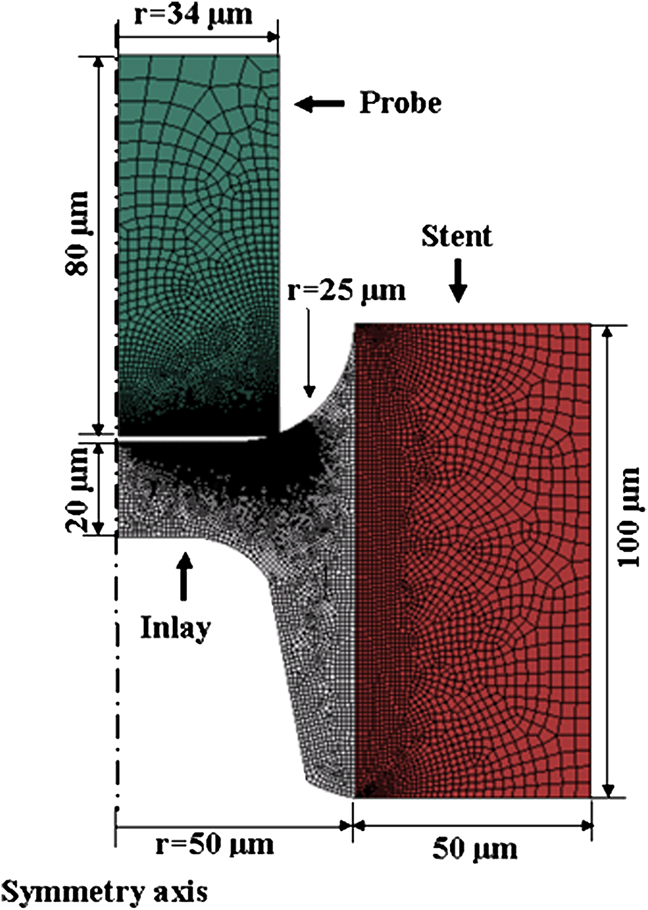
For simplification, an axisymmetric model was built, as shown in Fig. 4. In this model, the probe was approximated as cylinder, while the reservoir was approximated as a hollow cylinder that contains the polymer film. The geometry of the stent was based on simplified geometries of NEVO™ SES. The geometry of the probe tip was based on the simplified geometry of the probe used in the push-out test.
Finite element model of the NEVO™ SES inlay push-out process.
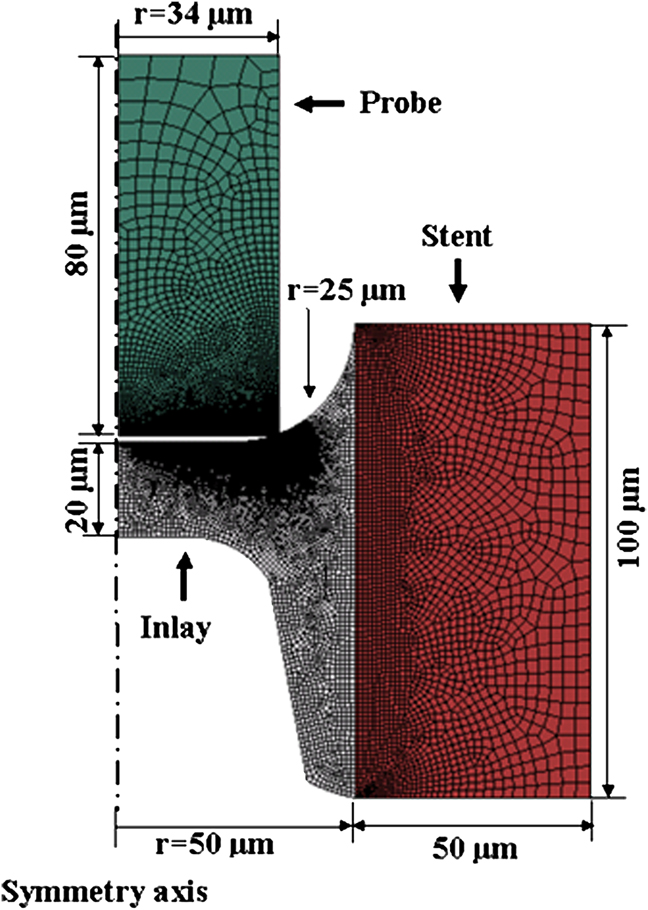
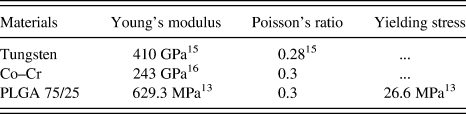
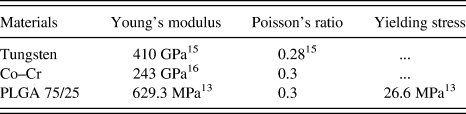
The model assumed that the materials of the probe and stent exhibited isotropic elastic behavior. Many polymeric materials have the hyperelastic material behavior. Unfortunately, there were not enough required data for the modeling of the hyperelastic material behavior for the material of the polymeric inlay. Also, experimentsReference Choi and Park13 showed that the elongation of PLGA at failure is only 5.7%, which makes it unlikely a hyperelastic material. It was assumed here that the material of the polymeric inlay exhibited elastic–perfectly plastic behavior, with mechanical properties that are summarized in Table I. Note that, considering the unknown effects of mixing of the drug and the PLGA polymer, the Young’s modulus of the formulation was taken as that of the PLGA. The axisymmetric boundary condition was applied at the symmetry axis, as shown in Fig. 4. Also, the outside edge of the stent was fixed to have no displacements and rotations. Vertical displacement was applied to the top of the probe.
Mechanical properties used in the finite element modeling.
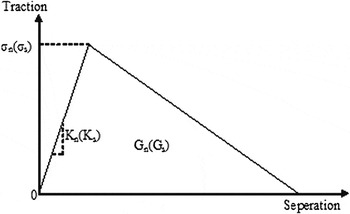
The model was meshed with linear four-node axisymmetric elements. The mesh was refined at the probe/inlay contact region to accommodate the relatively large deformation. The inlay/reservoir interface was meshed with nodes shared by the neighboring elements in the inlay and the reservoir. As illustrated in Fig. 5, the surface interaction at the inlay/reservoir interface was modeled as a nonlinear spring array, characterized by a tensile and a shear traction–separation law. Before the damage initiates, linear elastic behavior is assumed. However, after the damage initiates, the failure of the interface is characterized by the progressive degradation of the spring stiffness.
A schematic of the traction–separation laws used to model the inlay/reservoir interface.

The model, shown schematically in Fig. 5, can be described by six parameters. These include: the interfacial tensile strength σn and shear strength σs, corresponding opening and sliding spring constants K n and K s, and the areas under the traction–separation curves G n and G s, which are the fracture energies needed to damage the interface.
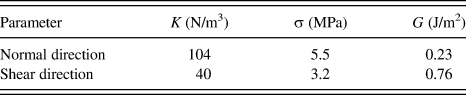
Based on von Mises yield criterion, the relation between tensile yield stress σy and shear yield stress τy could be described by  . Accordingly, the traction–separation law parameters σn and σs were selected to have
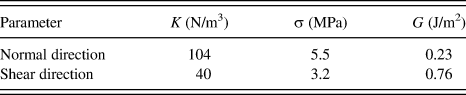
 . For isotropic linear elastic materials, Young’s modulus E and the shear modulus G could be related by E = 2G(1 + ν). Similarly, the traction–separation law parameters K n and K s were selected to have K n = 2K s(1 + ν). The parameters chosen for the simulation were listed in Table II.
Parameters for the traction–separation model.
A mixed mode damage evolution behavior is described by choosing the area under the traction–separation curve as the energy release rate derived from the zone modelReference Evans and Hutchinson11 for each corresponding mode mixity, such that G n and G s equal to mode I and mode II critical energy release rate, respectively.
The effective separation δ is defined by 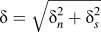 . Considering the mixed mode energy failure criterion, the effective failure separation
 could be defined by
 , where G c is the critical energy release rate and σ0 is the effective traction at damage initiation. The evolution of the interface damage could be described by a scalar damage variable as
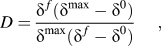
where  is the maximum value of the effective separation during the loading history and the
 is the effective separation when the damage initiates. The damage variable D is 0 when damage initiates. The damage variable also increases monotonically upon further loading and finally reaches a value of 1 when G c is reached.
III. EXPERIMENTAL PROCEDURES
A. AFM experiments
MPP-31100-W-rotated silicon tips (Bruker Nano, Santa Barbara, CA) were used in the experiments. They were selected from the same wafer to reduce possible batch effects. They were then coated with a solution of sirolimus and the degradable polymer PLGA, applying the inlay chemistry of the NEVO™ SES by dip-coating method used in the prior work.Reference Wolf, Zong, Meng, Orana, Rahbar, Balss, Papandreou, Maryanoff and Soboyejo1, Reference Meng, Orana, Tan, Wolf, Rahbar, Li, Papandreou, Maryanoff and Soboyejo3 After coating, scanning electron microscopy (SEM) images were obtained along with energy dispersive spectroscopy (EDS) analysis in a FEI XL30 FEG-SEM (Philips, Hillsboro, OR). The same SEM was also used to measure the AFM tip radii.
Electropolished L605 Co–Cr coupons with dimensions 48 × 14 × 0.5 mm were used as substrates. They are made of the same material used to produce the NEVO™ SES and have similar surface characteristics. A Wyco NT 3300 optical profiler (Veeco Instruments, Tucson, AZ) was used to perform white light interferometry that was used to characterize the surface roughness of the coupons at three different spots on the coupon. The measured surface roughnesses and tip radii were then used to calculate the combined radius.
A Dimension 3000 AFM (Digital Instruments, Plainview, NY) was used to perform contact AFM measurements in air, over a temperature range of 20–25 °C and relative humidity range of 36–45%. About five to six force measurements were conducted on each spot of the substrate. In total, three spots were tested, which gave a total of 17 force curves. The spring constant of each tip was measured using the thermal tune method with a Nanoscope IIIa AFM (Digital Instruments). By substituting the spring constant and the measured displacements into Eq. (1), the pull-off forces were estimated for the interface between the polymer coated tips and the L605 Co–Cr substrates.
B. Suspended films push-out test
Following the methods described in Shan et al.,Reference Shan, Du, Hampp, Li, Papandreou, Maryanoff and Soboyejo4 suspended film push-out tests were carried out on the NEVO™ SES (Cordis Corporation) using a tungsten probe with a rectangular cross section of 45 × 90 μm. The specimens were expanded, taken off the catheter, then cut, flattened, and clamped immediately after opening the package. They were then tested within 3 h of exposure to the lab environment (38–55% relative humidity and 20–25 °C temperature). The critical forces required to detach the suspended inlays from the force–time measurements and the in situ observations of drug push out. The samples were also examined in an environmental EVO SEM (Carl Zeiss NTS, LLC, Peabody, MA) after the push-out tests. This was done to confirm the push out of the suspended drug layers. The SEM imaging was also combined with EDS analysis, which was used to confirm the occurrence of adhesive failure.
IV. RESULTS AND DISCUSSION
A. Adhesion force measurements and surface energy
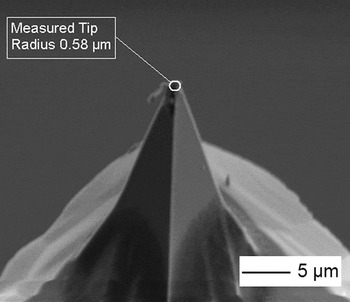
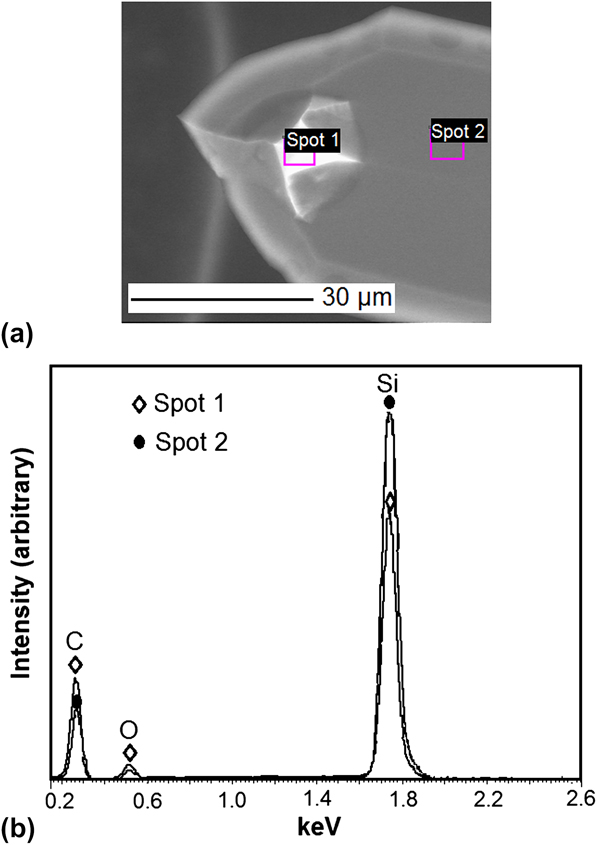
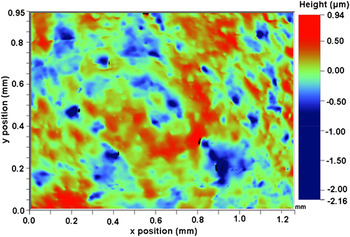
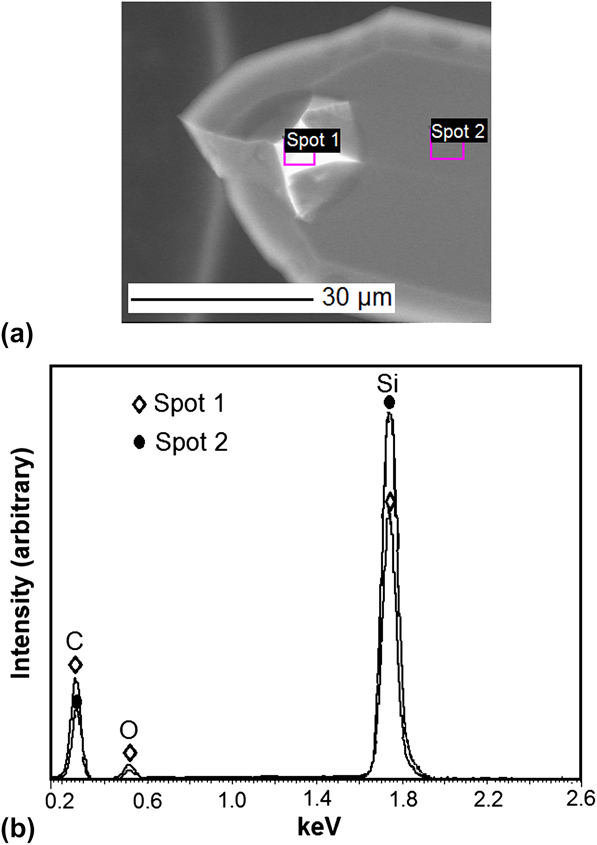
The tip radii of the NEVO™ SES formulation-coated tips were measured to be 561 ± 36 nm from three SEM images. A typical coated tip is shown in Fig. 6. The corresponding EDS spectrum (Fig. 7) also confirmed that an organic coating was presented on the tip, resulting in a higher concentration of carbon and oxygen. The surface roughness of L605 Co–Cr coupons was measured on three samples by white light interferometry to be 188 ± 7 nm. The surface morphology image of one of the measured spots is presented in Fig. 8. The pull-off force measured by AFM was 151 ± 74 nN. The adhesion energy was calculated for both JKR modelReference Johnson, Kendall and Roberts7 and DMT modelReference Derjaguin8 using Eqs. (2) and (3), respectively.
Sample SEM image of coated AFM tip profile.

EDS Spectrum of NEVO™ formulation-coated AFM tips. (a) SEM image of two measured spots. Spot 1 is NEVO™ SES formulation-coated tip; Spot 2 is the clean cantilever. (b) EDS spectra of two measured spots.
Surface profile of the L605 Co–Cr alloy coupon.

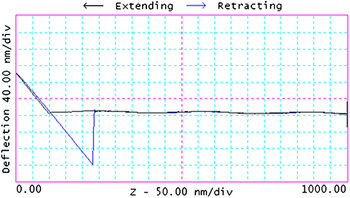
In the case of the NEVO™ inlay/reservoir interface examined in this work, the material properties of polymer and L605 alloy are presented in Table I. Using the values presented in the table, the λ parameter was calculated from Eq. (4) to be 18.2 ± 6.5. Since this is greater than 5, the adhesion was modeled using JKR theory.Reference Johnson, Kendall and Roberts7 This was also consistent with the AFM force–displacement plots that showed only short-range adhesive interactions between the NEVO™ formulation-coated tips and the L605 Co–Cr coupons (Fig. 9). The adhesion energy calculated by the JKR model was 0.23 ± 0.11 J/m2. This value is comparable to the adhesion energy between parylene C and 316L stainless steel measured by Rahbar et al.,Reference Rahbar, Wolf, Orana, Fennimore, Zong, Meng, Papandreou, Maryanoff and Soboyejo2 which is also an interaction between polymer and metal.
Typical force–displacement curve obtained for AFM force measurement between NEVO™ formulation and L605 Co–Cr alloy.

B. Interfacial failure zone model
The surface morphology of the NEVO™ SES stents (away from the reservoirs) was evaluated by profilometry using a P15 Surface Profiler (KLA-Tencor, Milpitas, CA). A typical plot of the stent surface profile is shown in Fig. 10. Assuming that each microcrack in the side profiles in Fig. 3 corresponds to the asperities obtained from the profilometry image presented in Fig. 10, the interfacial crack geometry parameters for zone model were evaluated using this surface profile. The spacing between microcracks, l, was measured to be ∼10 μm; the facet length, D, was ∼5 μm; and the facet height, H, was 0.2 μm. The materials parameter σ0 was then calculated to be 1.30 × 10⁻³.
Surface profile of NEVO™ SES stents away from the reservoirs.

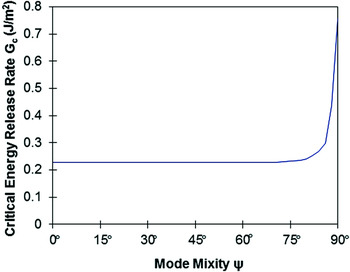
The values of crack-tip shielding  for different mode mixities were extracted from the plot by Evans and Hutchinson.Reference Evans and Hutchinson11 Considering that the adhesion energy, γ, obtained from AFM force measurements as the intrinsic mode I fracture toughness, mode mixity dependence predicted by Eq. (5) is presented in Fig. 11. The increase in the fracture toughness with increasing mode mixity was due to crack-tip shielding and facet locking phenomena.
Variation in critical energy release rate G c with phase angle of loading.

C. Suspended films push-out tests
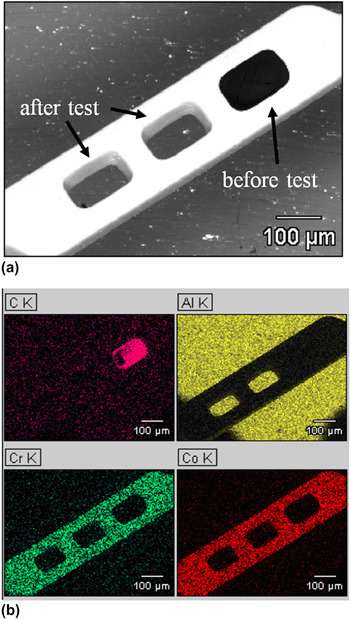
Suspended films push-out tests were performed on a total of 10 inlays of the NEVO™ SES. A typical SEM image is presented in Fig. 12(a). Also, the EDS map shown in Fig. 12(b) confirms that fracture occurred at the interface between the drug inlay and the reservoir. It is important to note here that the observed adhesion failure mode was partly due to the selection of probe tip size, which was designed to promote adhesion failure. Also, the measured critical push-out force F c was determined to be 81.2 ± 20.2 mN. The interface adhesion shear strength was defined by

SEM images and EDS mapping of NEVO™ SES after push-out test, demonstrating adhesive failure mode. (a) SEM images. (b) EDS mapping.

where c and H are the circumference and the height of the inlay, respectively. By taking H = 100 μm and c = 400 μm, the shear strength of the inlay/reservoir interface was calculated to be 2.0 ± 0.5 MPa. This lower adhesive strength value is attributed to the fact that the adhesive failure corresponds to a condition in which a debond has extended across the interface. Hence, this represents a lower bound measurement of stress required to overcome adhesive interactions, sliding friction, and residual stress effects.Reference Hsueh14
D. Finite element modeling of push-out tests
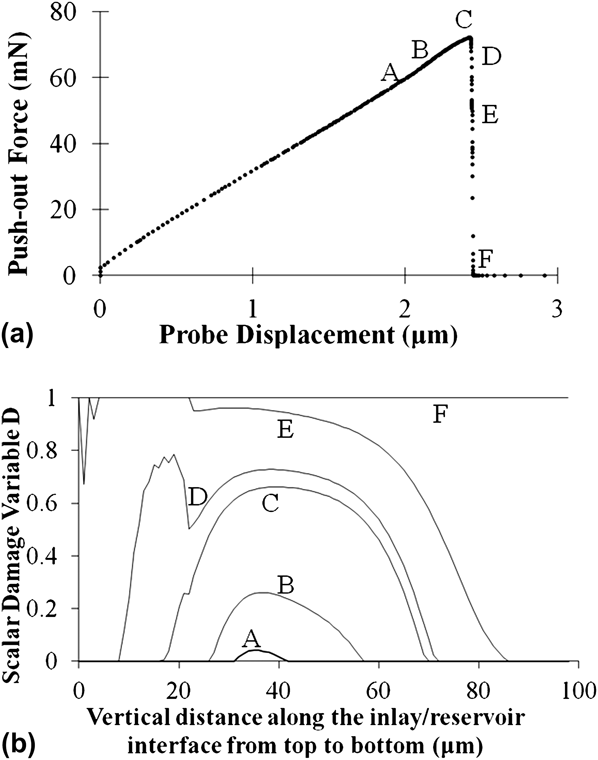
In the finite element modeling of NEVO™ SES push-out test, the probe moved down gradually to push out the inlay. The push-out force, i.e., the reaction force at the probe, was determined from the force–displacement curves obtained from the finite element simulations. Our simulations showed that the slope of the push-out force–displacement curve depended on the combined effect of inlay stiffness and inlay/reservoir interface stiffness [Fig. 13(a)].
Push-out force and damage variable calculated by finite element modeling. (a) Push-out force. (b) Damage variable.
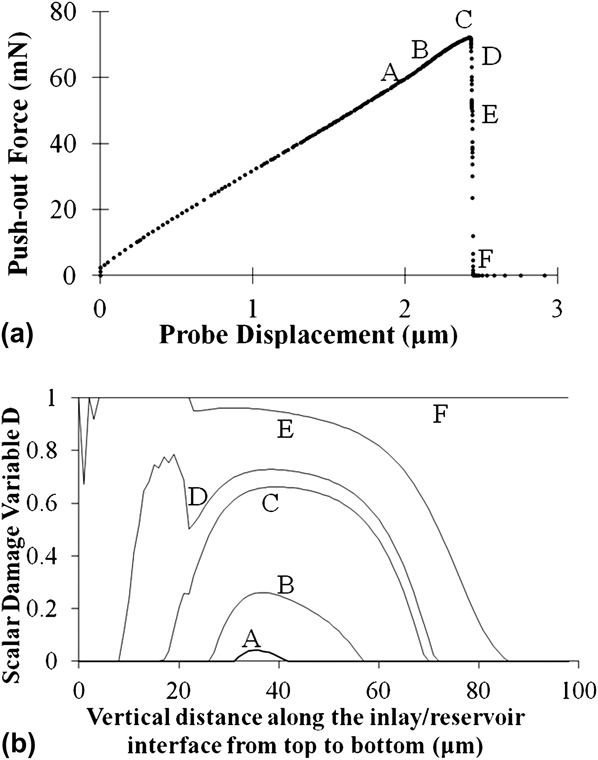
The critical force mostly depended on the strength of inlay/reservoir interface, while the other parameters of the traction–separation interface property are of secondary importance to the critical force [Fig. 13(a)]. The area of the push-out force–displacement curve depended on both the plasticity of the inlay and the area of the traction–separation curve, i.e., the critical energy release rate.
The computed push-out force–displacement curve for an interface with a shear strength of 3.2 MPa is presented in Fig. 13(a). The critical push-out force was calculated to be 72.1 mN. This is in good agreement with the measured values of 81.2 ± 20.2 mN obtained from the push-out tests on the NEVO™ SES. Since there were not enough data points obtained for each condition, it is unlikely that the current results are sufficient for probabilistic analysis. Nevertheless, probabilistic analysis in the future could be useful to show evidence of statistical variance in the experimental results.
The damage variable, D, obtained at several points along the interface, is plotted in Fig. 13(b). This shows that the damage initiated in the middle of the inlay/reservoir interface but evolved more rapidly in the upper part of the interface, as a combined effect of tensile and shear separation. The crack initiated along the upper section of the interface and propagated across the interface.
It is important to note here that the interfacial shear strength that was used in the finite element method (FEM) was greater than the value calculated from Eq. (7). This is because the onset of final failure corresponded to a partially debonded interface, as shown in the damage variable at the critical point in Fig. 13(b). Also, the plasticity of the inlay, which was also considered in the FEM analyses, contributed to the higher value of the interface shear strength.
V. SUMMARY AND CONCLUDING REMARKS
This paper presents the results of a combined experimental, theoretical, and computational study of adhesion and interfacial fracture between a suspended film and a stent substrate in a model DES. The adhesion force was measured using force microscopy during AFM. A combination of adhesion theories and fracture mechanics concepts was then used to estimate the mode mixity dependence of the critical interfacial energy release rates. These were incorporated into a finite element model that was used to simulate the deformation and interfacial cracking processes between the suspended formulation inlay and the stent substrate. The predicted critical forces and load–displacement behavior were in good agreement with experimental results obtained from the suspended polymeric film push-out tests.
ACKNOWLEDGMENTS
The research was supported by the Cordis Corporation, a Johnson & Johnson Company, the NSF MRSEC program through the Princeton Center for Complex Materials (Grant DMR-0819860) and the Grand Challenges Program at Princeton University. The authors are grateful to Prof. Zhigang Suo of Harvard University, for useful technical discussions. We are also grateful to Dr. Nan Yao, Dr. Gerald R. Poirier, and Mr. Joe Palmer for their technical assistance.