

Global research interest in emotional intelligence (EI) has continued to grow over the past few years. In particular, international research has established EI as a viable and important construct in general and applied psychology, as well as in applied business settings (Antonakis, Ashkanasy, & Dasborough, Reference Antonakis, Ashkanasy and Dasborough2009; Mayer, Roberts, & Barsade, Reference Mayer, Roberts and Barsade2008; Law, Wong, & Song, Reference Law, Wong and Song2004). The continued growth of interest in EI in the organisational context has undoubtedly been driven by claims that EI is predictive of workplace performance, and this has stimulated interest among human resource professionals who have considered EI as a tool for selection and training (Fineman, Reference Fineman2004). A number of studies have found a meaningful relationship between EI and job performance (Jennings & Palmer, Reference Jennings and Palmer2007; Law, Wong, Huang, & Li, Reference Law, Wong, Huang and Li2008; Koman & Wolff, Reference Koman and Wolff2008) and between a range of management, leadership and professional roles (Abdul & Ehiobuche, Reference Abdul and Ehiobuche2011; Adeoye & Torubelli, Reference Adeoye and Torubelli2011; Brackett, Rivers, & Salovey, Reference Brackett, Rivers and Salovey2011; Bratton, Dodd, & Brown, Reference Bratton, Dodd and Brown2011; Dulewicz, Young, & Dulewicz, Reference Dulewicz, Young and Dulewicz2005). In a recent meta-analysis of 48 research studies examining the relationship between EI and leadership involving 7,343 participants, Mills (Reference Mills2009) reported a moderately strong relationship between EI and effective leadership.
From an historical perspective, there are several approaches to describing EI. The term was initially coined in German by Leuner (Reference Leuner1966) and appeared in English for the first time in an unpublished doctoral dissertation by Payne (Reference Payne1986). Its historical roots can be traced back to the work of Thorndike on ‘social intelligence’ (Thorndike, Reference Thorndike1920). More recently, Gardner (Reference Gardner1983) put forward a theory of ‘multiple intelligences’ and, in particular, ‘intrapersonal and ‘interpersonal’ intelligence, which has also influenced current models (Bar-On, Reference Bar-On1997; Newman & Purse, Reference Newman and Purse2007). Although there are a number of models of EI, until quite recently, three models have dominated the field. The first is based on the work of Salovey and Mayer (Reference Salovey and Mayer1990), who originally viewed EI as an aspect of social intelligence and put forward a theory framed within a model of intelligence. This model views overall EI as joining abilities from four areas: (a) accurately perceiving emotion, (b) using emotions to facilitate thought, (c) understanding emotion, and (d) managing emotion (Mayer & Salovey, Reference Mayer, Salovey, Salovey and Sluyter1997; Mayer, Salovey, Caruso, & Sitarenios, Reference Mayer, Salovey, Caruso and Sitarenios2003). These abilities are best measured through performance tests such as the Mayer-Salovey-Caruso Emotional Intelligence Test (MSCEIT; Mayer, Salovey, & Caruso, Reference Mayer, Salovey and Caruso2002).
Following Mayer and Salovey (Reference Salovey and Mayer1990), Boyatis, Goleman, and Rhee (Reference Boyatis, Goleman, Rhee, Bar-On and Parker2000) developed a mixed EI model designed to encompass the social and emotional competencies that are linked to workplace performance. The model consists of a number of learned competencies that are organised into four basic clusters: self-awareness, self-management, social awareness, and relationship management. The primary measures associated with this model are both multi-rater inventories — the Emotional Competence Inventory (ECI) and the Emotional and Social Competence Inventory (ESCI; Boyatis, Goleman, & Hay/McBer, Reference Boyatis, Goleman and Hay/McBer2008).
The third model is based on work of Bar-On (Reference Bar-On1988), who placed EI within the context of personality theory as a model of wellbeing comprised of a mixture of traits and skills grouped according to five composite scales: intrapersonal, interpersonal, adaptability, stress management, and general mood, which at least one observer has noted share many similarities with the Goleman model (Gowing, Reference Gowing, Cherniss and Goleman2001). Bar-On's model is measured by a self-report inventory — the Emotional Quotient (EQ-i; Bar-On, Reference Bar-On1997). And, more recently, in a similar approach to Bar-On, Petrides and Furnham (Reference Petrides and Furnham2003) also defined a model from within personality theory as ‘trait emotional intelligence’. Trait EI concerns behavioural dispositions and self-perceived abilities with reference to personality hierarchies, and is meant to include all ‘personality facets that are specifically related to affect’ (Petrides, Pita, & Kokkinaki, Reference Petrides, Pita and Kokkinaki2007, p. 274).
Despite its popularity, EI has remained controversial with respect to both construct- and criterion-related validity (Cherniss, Reference Cherniss2010; Dulewicz & Higgs, Reference Dulewicz and Higgs2000; Landy, Reference Landy2005; Locke, Reference Locke2005) and the field still lacks a universally accepted definition. In the interests of achieving greater conceptual clarity, a number of researchers have argued that EI should be distinguished according to two discrete models: (a) an ‘ability-based’ model that proposes that EI is a type of intelligence or aptitude and therefore should overlap with cognitive ability, or (b) a mixed (traits with abilities) model that includes a combination of intellect and various measures of personality and affect (Petrides & Furnham, Reference Petrides and Furnham2001). There is growing empirical evidence supporting this distinction and its usefulness (Joseph & Newman, Reference Joseph and Newman2010; Martins, Ramalho, & Morin, Reference Martins, Ramalho and Morin2010; Van Rooy, Viswesvaran, & Pluta, Reference Van Rooy, Viswesvaran and Pluta2005).
Indeed, concerned that these broader mixed models of EI do not qualify strictly as EI, Chernis (2010) has gone further, suggesting a distinction be made between EI and emotional and social competencies (ESC) that are clearly linked to EI. This position appears similar to Goleman's original contention, that social and emotional competencies are ‘“learned capabilities” based on emotional intelligence that results in outstanding performance at work’ (Goleman, Reference Goleman1998, p. 24) According to both Chernis (Reference Cherniss2010) and Goleman (Reference Goleman1998), an advantage of the broader competency-based models is that they consolidate many emotional and social abilities that are important for personal and professional success into a single framework. There is a growing body of research that has linked ESC, as measured by self-report measures or multi-rater tests, to success in the workplace (Bachman, Stein, Campbell, & Sitarenios, Reference Bachman, Stein, Campbell and Sitarenios2000; Chia, Reference Chia2005; Petrides & Furnham, Reference Petrides and Furnham2006) and leadership performance (Barbutto & Burback, Reference Barbutto and Burback2006; Butler & Chinowsky, Reference Butler and Chinowsky2006; Cavallo & Drienza, Reference Cavallo and Drienza2004; Gardner & Stough, Reference Gardner and Stough2002).
Joseph and Newman (Reference Joseph and Newman2010), in their recent meta-analysis, examined the ubiquity of EI as a precursor to job performance, based on the notion of emotional labour; that is, the expression of positive emotion is an important part of job performance requirements (Grandey, Reference Grandey2000; Hochschild, Reference Hochschild1983). They reported strong relationships between mixed EI and job performance in high emotional labour jobs in comparison to low emotional labour jobs. Similarly, a number of researchers have made explicit linkages between emotional labour and leadership (Ashforth & Humphrey, Reference Ashforth and Humphrey1993; Gardner, Fischer, & Hunt, Reference Gardner, Fischer and Hunt2009; Humphrey, Kellett, Sleeth, & Hartman, Reference Humphrey, Kellett, Sleeth, Hartman, Ashkanasy and Cooper2008; Humphrey, Pollack, & Hawver, Reference Humphrey, Pollack and Hawver2008).
In a recent review of emotional competencies and leadership theory in organisational psychology, however, Gooty, Connelly, Griffith, and Gupta (Reference Gooty, Connelly, Griffith and Gupta2010) pointed out that with respect to emotional competencies and leadership there is still a lack of clarity regarding construct definitions and psychometric measurement in leadership, affect, and emotions is less stringent than it needs to be. They called for a clarification of construct definitions for emotional competencies related to leadership, and improved research design and psychometric measures. Moreover, Gooty et al. (Reference Gooty, Connelly, Griffith and Gupta2010) proposed that ‘in the emotional competencies area, psychometric work in new scale development is required’ (p. 999).
In this regard, the most recent model to emerge to measure the emotional and social competencies that are linked to mixed EI is the emotional capital model (Newman, Reference Newman2007). Designed as a consensus model that includes a number of the competencies found in earlier models, the emotional capital model redefined these competencies in terms of the social and emotional competencies thought to be predictive of success in a range of management, leadership, and professional roles. Research in applied business settings using this model culminated in the publication of the Emotional Capital Report (ECR; Newman & Purse, Reference Newman and Purse2007).
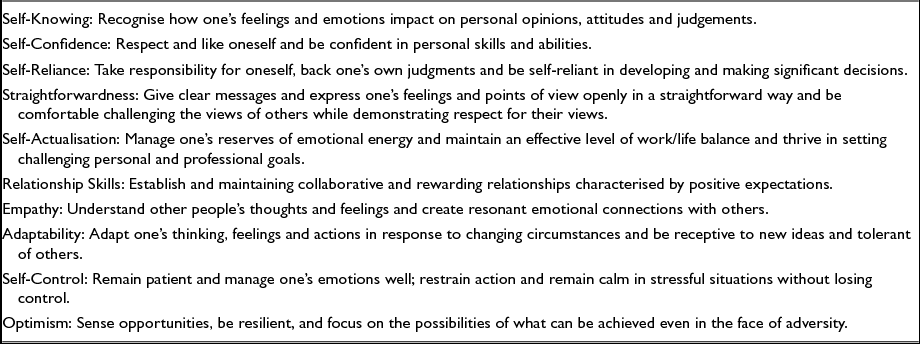
The ECR is a 77-item self-report measure of the specific emotional and social competencies linked to EI and leadership. Items are brief sentences phrased in the first-person singular, and responses are gathered in a 5-point response format that offers five ranked values designed to indicate the subjective strength of the individual's responses, including: 1 = very seldom true of me, 2 = seldom true of me, 3 = sometimes true of me, 4 = often true of me, and 5 = very often true of me. Items are summed to yield a Total EC score that reflects overall level of emotional capital and scores on 10 emotional and social competencies (see Table 1). The ECR includes a validity scale — the Positive Impact Scale — designed to detect response bias and increase the accuracy of interpretation. Raw scores are automatically tabulated and converted into standard scores based on a mean of 100 and standard deviation of 15.
ECR Competency Scales*

Note: *ECR Competency descriptions are based on Newman and Purse (Reference Newman and Purse2007), p. 20.
The development of the ECR was based primarily on findings from a review of the research on the relationship between several mixed EI models and leadership over a 10-year period. Competencies were finally determined by identifying empirical links with EI and leadership behaviours reported in the literature. The most commonly cited instrument used to measure mixed EI was the Bar-On (Reference Bar-On1997) measure, along with the Boyatis et al. (Reference Boyatis, Goleman, Rhee, Bar-On and Parker2000) measure. The structural component definitions, including item content, were examined to determine similarities and dissimilarities of content between these mixed EI models. Components were then regrouped based on similarity and likeness, and integrated to form a single competency. The grouping of components was based on a logical and non-statistical clustering of the content, based on the authors’ observations from clinical experience. Following the regrouping and integrating of the components, 10 social and emotional competencies were identified. Component content was then modified and operationalised to reflect the specific emotional and social features of effective leadership behaviour, based on both authors’ experience in corporate consulting and the leadership behaviours described by Newman (Reference Newman2007) as emotional capital (see Table 1). A pool of original items was then created, based on the operationally defined competencies.
Following statistical findings generated by item analysis and factor analysis, the final form of the ECR was published, based on normative data from 3,240 individuals from professional occupations including business, law, medicine, and education, drawn from six geographic regions. Newman and Purse (Reference Newman and Purse2007) reported that the scales had good internal consistency and test–retest reliability. Factor analyses also provided reasonable support for the inventory's hypothesised structure.
The aim of the current paper was to evaluate the reliability and validity of the ECR as a measure of mixed EI in a large international sample of individuals in professional roles, including management and leadership. We were interested in assessing the relationship of the ECR constructs to measures of normal personality, depression, and psychopathology; and also whether the ECR, as a measure of mixed EI, was capable of identifying jobs with high emotional labour. In particular, we were interested in whether scores on the ECR were related to the experience of individuals with leadership responsibilities. We expected that high scores on the ECR scales would correlate positively with positive affectivity, as measured by the NEO Five Factor Inventory (Costa & McCrea, Reference Costa and McCrae1992) and the Self-Liking/Self-Competence Scale (SLCS; Tafarodi & Swan, Reference Tafarodi and Swann1995). Concomitantly, we expected negative correlations with measures of negative affectivity and psychopathology, as measured by the Beck Depression Inventory — Second Edition (BDI-II; Beck et al., Reference Beck, Steer and Brown1996) and the Brief Symptom Inventory (Derogatis, Reference Derogatis1992). We also expected significant positive correlations with component scales on another, well-validated measure of mixed EI, the EQ-i (Bar-On, Reference Bar-On1997).
Finally, given the theoretical and empirical basis upon which the ECR was constructed as a measure of mixed EI in professional contexts, we expected that jobs involving high emotional labour requirements would correlate with higher levels of EI. In this regard, we also expected that groups identified as effective leaders would score higher on all scales of the ECR.
Method
Participants
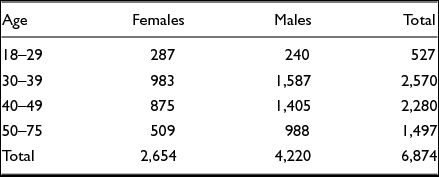
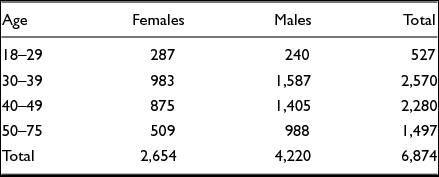
A total of 6,874 participants (4,220 males, 2,654 females) were recruited from 11 countries or geographical regions, including Australia/Oceana (34%), the United Kingdom (24%), Ireland (11%), India (9%), the Middle East (7%), Western Europe (7%), North America (3%), Asia (2%), South America (1%), Africa (1%), and Eastern Europe (1%). Participants were involved in various leadership development programs initiated by their respective organisations and consisted of Business, 6,228 (90.6%); Educational, 359 (5.2%); and Medical professionals, 287 (4.2%) who were regarded as having general or higher leadership responsibilities. As shown in Table 2, ages ranged from 18 to 75 (M = 41.6, SD = 9.3).
Participants’ Age by Gender
Procedure
All participants voluntarily completed the ECR and provided data relating to their occupation and job description. In addition, a number of groups completed five other inventories: the Revised NEO Personality Report (NEO PI-R; Costa & McCrae, Reference Costa and McCrae1992), the Beck Depression Inventory — Second Edition (BDI-II; Beck et al., Reference Beck, Steer and Brown1996), the Brief Symptom Inventory (BSI; Derogatis, Reference Derogatis1992), the Self-Liking Self-Competence Scale (SCLC; Tafarodi & Swann, Reference Tafarodi and Swann1995), and the BarOn Emotional Intelligence Inventory (EQ-i; Bar-On, Reference Bar-On1997).
In addition, a total of 145 participants specifically identified by their peers as senior management leaders in their respective fields completed the ECR. This leadership cohort was comprised of four groups: the first group included 78 participants from Leadership Victoria, an elite group of business and community leaders in Australia (45% male, 55% female, age range 32–50). Members of Leadership Victoria represent a broad range of corporate, government and non-profit organisations and are identified as exemplary leaders in their field by a selection panel of fellows. The second leadership group involved 12 senior leaders from one of Australia's largest banks who were participating in a leadership training program focused on improving customer service (50% male, 50% female, age range 32–39). The third leadership group consisted of 30 individuals working in the pharmaceutical and healthcare industry with professional leadership responsibilities in the diverse areas of Sales and Marketing, Human Resources and Clinical Services (40% male, 60% female, age range 27–55). The fourth group involved 25 high school principals selected by the state educational authority as high potential leaders (40% male, 60% female, mean age 46.3 years).
All participants were informed of the purpose of the study, and the present study adhered to the American Psychological Association ethical guidelines for working with human participants.
Measures
ECR
The ECR, described earlier, was administered according to standard instructions and computer-scored by the test publishers, RocheMartin.
Revised Neo Personality Inventory (NEO PI-R)
Normal personality was assessed using the NEO PI-R (Costa & McCrae, Reference Costa and McCrae1992). The NEO PI-R is a 240-item measure of the Five Factor Model — FFM: Extraversion, Agreeableness, Conscientiousness, Neuroticism, and Openness to Experience. Additionally, the test measures six subordinate dimensions (known as ‘facets’) of each of the FFM personality factors.
Beck Depression Inventory (BDI-II)
Participants’ level of depression was assessed using the BDI-II (Beck et al., Reference Beck, Steer and Brown1996), a 21-item self-report scale. Each BDI item reflects a symptom of depression. The BDI-II has become one of the most widely used instruments for assessing the intensity of depression within both psychiatric and normal populations.
Emotional Quotient Inventory (EQ-i)
The EQ-i (Bar-On, Reference Bar-On1997) is a 133-item general measure of EI. The EQ-i consists of 15 subscales that in turn define five higher-order dimensions and also contains four validity indicators that measure distorted responding. The EQ-i yields a measure of overall EI. The EQ-i was administered according to the standard instructions and computer-scored by the test publisher, Multi-Health Systems, Inc.
The Brief Symptom Inventory (BSI)
Participants’ level of psychological distress was measured by the BSI (Derogatis, Reference Derogatis1992). The BSI is a 53-item multidimensional self-report symptom inventory widely used in psychotherapy outcome research. It is an abbreviated form of the SCL-90-R (Derogatis, Reference Derogatis1983) and measures the same nine symptom dimensions as the longer instrument: Somatisation, Obsessive-Compulsive, Interpersonal Sensitivity, Depression, Anxiety, Hostility, Phobic Anxiety, Paranoid Ideation, Psychoticism, as well as a Global Severity Index.
The Self-Liking/Self-Competence Scale (SLCS)
Self-esteem was measure by the SLCS (Tafarodi & Swan, Reference Tafarodi and Swann1995). The SLCS is a 20-item scale developed to validate the conceptualisation of global self-esteem as a two-dimensional construct consisting of self-liking (a sense of social worth) and self-competence (a sense of personal efficacy). Tafarodi and Swann (Reference Tafarodi and Swann1995) reported good internal consistency for both dimensions.
Results
Distribution of ECR Scores
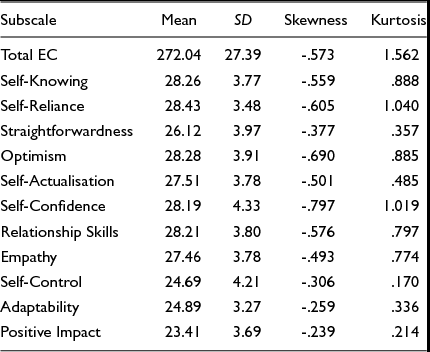
Descriptive statistics are shown in Table 3 and approximate the general ECR distributions as reported by Newman and Purse (Reference Newman and Purse2007). The Kolmogorove-Smimov statistic, boxplots, and a visual inspection of the graphical distribution of the subscale and total scores identified that these scores approximated normal distributions.
Descriptive Statistics in Raw Scores for Sample (N = 6,874)
Age and Gender Analyses
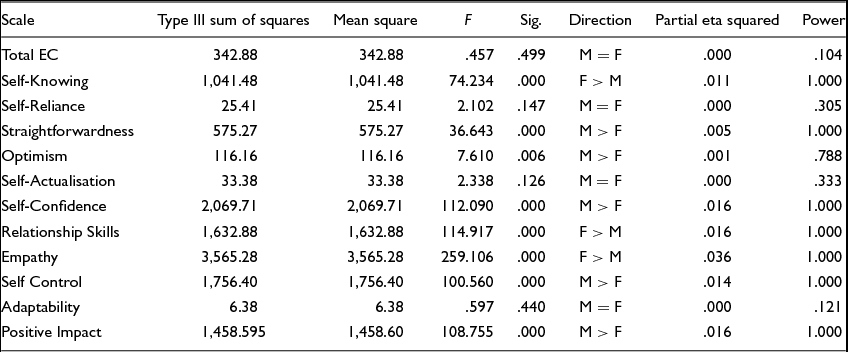
There were significant differences between males and females on scores of Total EC, Self-Reliance, Self-Actualisation and Adaptability. Although significant differences were found across the remaining seven scales of the ECR (refer to Table 4), these differences were minor — less than 2%, with the exception of Empathy, where females scored higher than males and registered an effect size difference of 3.6%.
Analysis of Variance (ANOVA) Results for ECR Scales as a Function of Gender
Note: N = 6.874, df = 1, 6872.
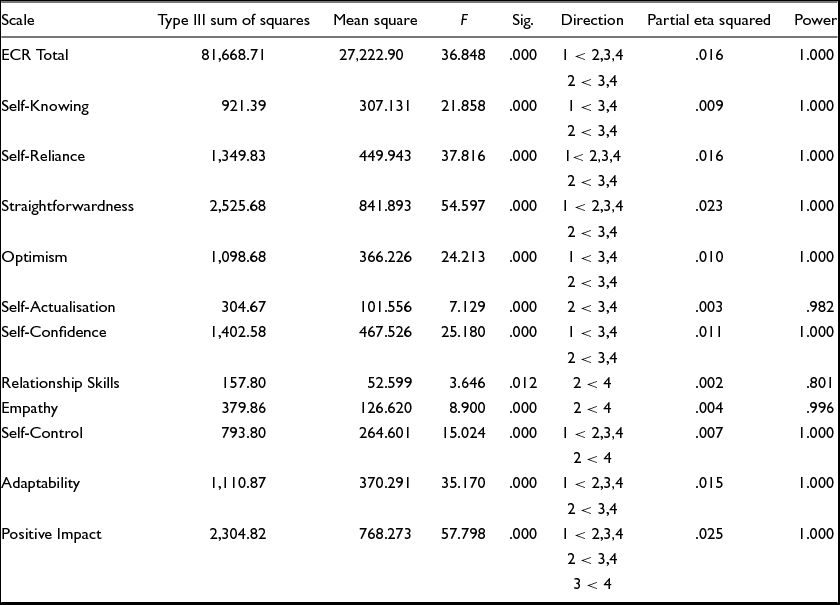
As shown in Table 5, there were a number of significant age effects across all scales of the ECR. In general, there was a gradual increase in EI scores with age and, typically, the 50+ group had the highest mean. Overall, the age effects were small — less than 2%, with the exception of Straightforwardness (2.3%) and the Positive Impact scale (2.5%). Although the age effects were small, they were indicative of a trend that older groups scored higher than the younger groups. No age by gender interactions were reported.
Analysis of Variance (ANOVA) Results for ECR Scales as a Function of Age
Note: df = 3, 6870. Age groups: 1 = 18–29; 2 = 30–39; 3 = 40–49; 4 = 50–75. A less than (<) symbol indicates a significant Bonferroni post hoc difference (p < .05).
Reliability
Internal consistency and interscale correlation
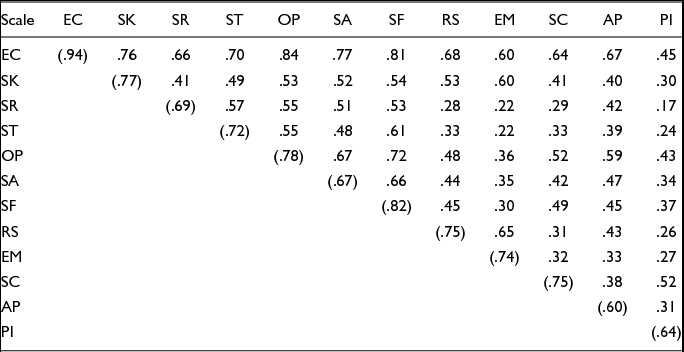
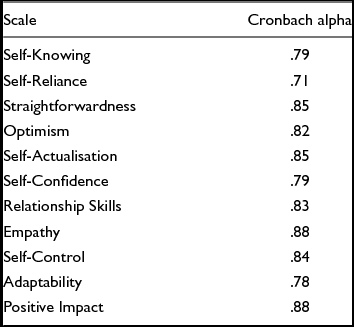
As shown in Table 6, internal consistencies for the 10 ECR scales and Positive Impact scale were based on 6,874 participants. The average Cronbach alpha coefficients were high for all of the scales, ranging from a low of .60 (Adaptability) to a high of .82 (Self-Confidence), with an average internal consistency coefficient of .74. Interscale correlations ranged from a low between Straightforwardness and Empathy (.22), to a high between Optimism and Self-Confidence (.72).
Coefficient Alphas and Interscale Correlations for ECR Scale Scores (N = 6,874)
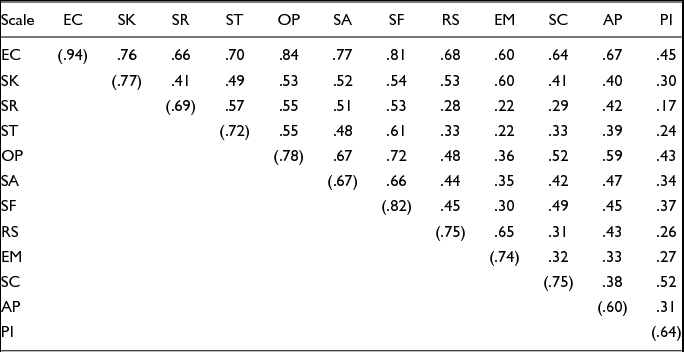
Note: Coefficient alphas are presented in parentheses along the diagonal. All correlations are significant at p < .001, two-tailed. EC = ECR Total, SK = Self-Knowing, SR = Self-Reliance, ST = Straightforwardness, OP = Optimism, SA = Self-Actualisation, SF = Self-Confidence, RS = Relationship Skills, EM = Empathy, SC = Self-Control, AP = Adaptability, PI = Positive Impact.
Test–retest reliability
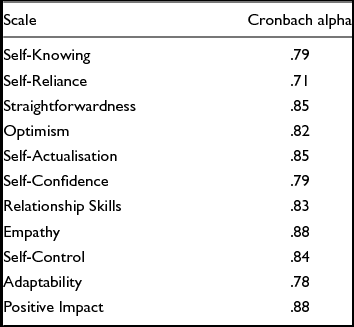
A sample of 20 participants completed the ECR on two separate occasions 1 month apart. As shown in Table 7, the average test–retest reliability coefficient after 1 month ranged between r = .71 to .88 with an average of r = .81, indicating that the ECR scales possess good reliability.
Stability Coefficients for the ECR Subscales for One Month (N = 20)
Validity
Factorial analysis
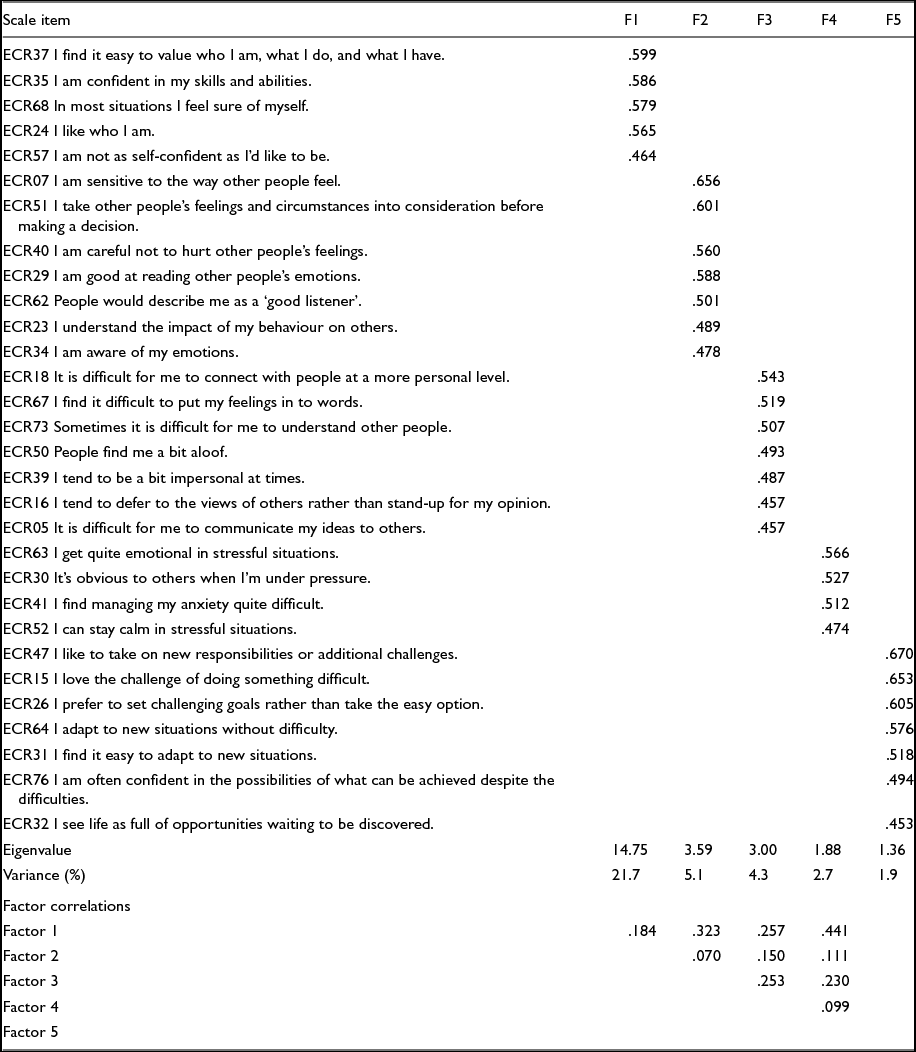
To investigate the underlying structure of the 70-item ECR questionnaire (the Positive Impact Scale was not included in the analysis), data collected from 6,874 participants were subjected to principal axis factoring (PAF) with orthogonal rotation (Direct Oblimin).
Prior to running the principal axis factoring (PAF), examination of the data indicated that not every variable was perfectly normally distributed. Given the robust nature of factor analysis and the large number of participants, these deviations were not considered problematic. Furthermore, a linear relationship was identified among the variables.
The initial PAF with orthogonal rotation produced 14 factors with an eigenvalue greater than 1. However, the initial analysis did not meet all of the following five criteria: (1) eigenvalues greater than 1; (2) analysis of the scree plot; (3) minimum of three items per factor; (4) no cross-loading great than .30; and (5) items retained in each factor having a factor loading greater than .45. Further PAF analyses were undertaken, and a five-factor solution of the PAF afforded the greatest interpretability and satisfied all five criteria. The five-factor solution revealed approximately 35% of the variance, as presented in Table 8.
Final Principal Axis Factoring (PAF) with Orthogonal Rotation (Direct Oblimin) of the Emotional Capital Report (N = 6,874)
Note: Factor loadings less than .45 are suppressed.
Taken together, these five factors closely resemble the four domains identified by Boyatis et al. (Reference Boyatis, Goleman, Rhee, Bar-On and Parker2000) as self-awareness, self-management, social awareness, and relationship management, and by Bar-On (Reference Bar-On1997) as intrapersonal, interpersonal, stress management, and general mood, along with a fifth domain that most closely resembles Bar-On's composite scale, adaptability.
The first factor most closely resembles the domain described by Boyatis et al. (Reference Boyatis, Goleman, Rhee, Bar-On and Parker2000) as self-awareness, and items with the strongest factor loadings were drawn from the self-confidence and self-knowing scales, such as item 35, ‘I am confident in my skills and abilities’, and item 1, ‘I know exactly what I'm feeling most of the time’. The second factor appeared to fit best with aspects of the construct of social awareness and contained items from the empathy and self-knowing scales, such as item 34, ‘I am aware of my emotions’. The third factor most closely resembled the domain of relationship management and contained items from the relationship skills scale, such as item 50, ‘People find me a bit aloof’, and item 39, ‘I tend to be a bit impersonal at times’. Factor four resembled the domain of self-management, with all items being drawn from the self-control scale, such as item 54, ‘I can stay calm in stressful situations’. The fifth factor included items that were mostly drawn from the adaptability scale, such as item 64, ‘I adapt to new situations without difficulty’, and most closely resembled the Bar-On factor of adaptability.
Convergent and Discriminant Validity
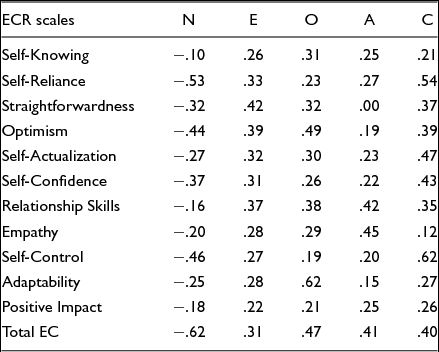
Table 9 presents correlations between scores on the ECR and the five factors of personality measured by the NEO PI-R. Self-Knowing had low positive correlations with four factors and had a low negative correlation with Neuroticism (-.10) and the highest positive correlation with Openness (.31). As expected, Straightforwardness (.42) and Relationship Skills (.37) appear related to Extraversion, as was Optimism (.39). Similarly, correlations with Agreeableness were found between Relationship Skills (.42) and Empathy (.45). Strongest relationships were found between Conscientiousness and Self-Reliance (.54) and Self-Control (.62). The Adaptability scale on the ECR correlated well (.62) with Openness. All ECR scales correlated negatively with the Neuroticism scale (i.e., negative affectivity). These findings support the ECR Technical Manual's contention that the ECR ‘is measuring factors related to positive emotional and social wellbeing’ (Newman & Purse, Reference Newman and Purse2007, p. 48).
Correlation Coefficients Between ECR Scales and NEO PI–R Scales (N = 22)
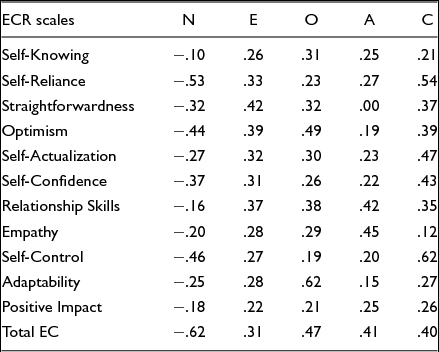
Note: NEO PI-R Abbreviations: N = Neuroticism; E = Extraversion; O = Openness; A = Agreeableness; C = Conscientiousness.
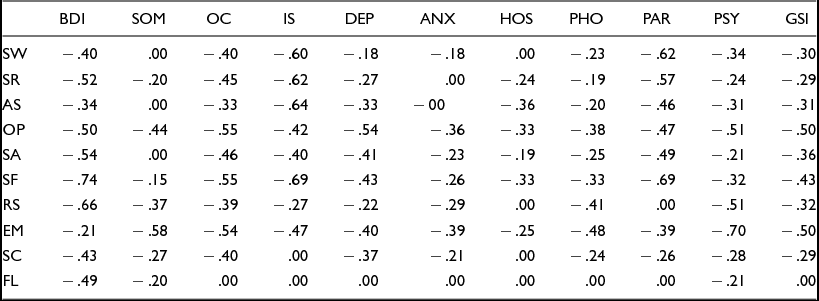
Table 10 shows the relationship between ECR scales and the BDI-II measuring depression and BSI measuring psychopathology. All 10 ECR scales correlated negatively with the BDI-II and a number of scales correlated negatively with BSI scales measuring negative affectivity such as DEP, ANX and OC scales, as well as scales measuring psychopathology such as the SOM, PHOB, PAR and PSY scales. Again, findings suggest that ECR scales have a negative relationship to either negative affectivity or serious psychopathology or both.
Correlation Coefficients Between ECR Scales and BDI Scale (N = 30) and BSI Scales (N = 22)
Note: SOM = Somatisation, OC = Obsessive-Compulsive, IS = Interpersonal Sensitivity, DEP = Depression, ANX = Anxiety, HOS = Hostility, PHO = Phobic Anxiety, PAR = Paranoid Ideation, PSY = Psychoticism, GSI = Global Severity Index.
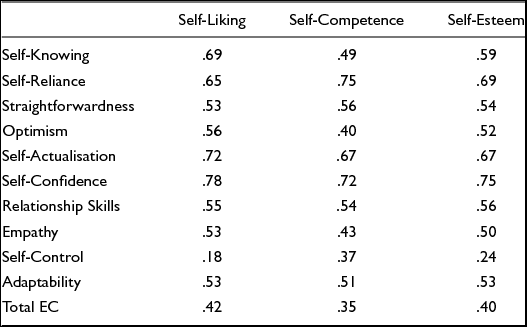
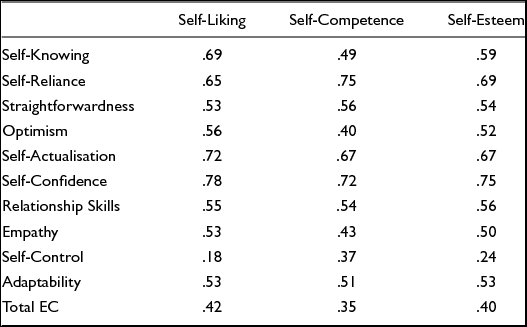
Table 11 shows the correlation coefficients between the ECR and SL/SC scale measuring self-esteem and indicated that all ECR scales were related to the two factors of self-esteem: self-liking and self-competence. As expected, the strongest relationships were found between the ECR scales Self-Confidence (.75), Self-Actualisation (.67), Self-Reliance (.69), and Total Self-Esteem.
Correlation Coefficients Between ECR Scales and SL/SC Scales (N = 27)
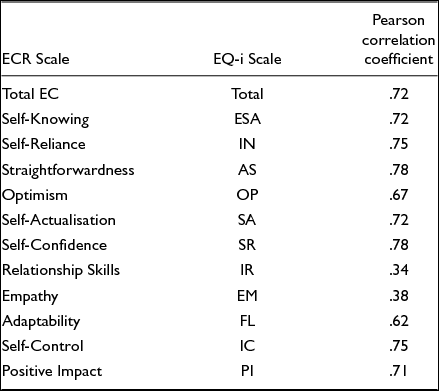
As shown in Table 12 the ECR scales demonstrated good relationship to those scales of the EQ-i that appear to be measuring similar constructs. Eight of the 10 scales demonstrated high correlations with their EQ-i counterparts, including Total EC (.72) with Total EQ. The correlations, however, were far from exact. This is particularly evident for Relationship Skills, which had a relatively low correlation with Interpersonal Relationships (.34), and for Empathy, which had a low correlation with the EQ-i's Empathy scale (.38). To a lesser extent, this was also true of Adaptability, which correlated moderately with Flexibility (.62). An examination of the item content of these scales suggested that the ECR's Relationship Skills scale is more homogeneous than the EQ-i's Interpersonal Relationships scale. Relationship Skills item content is focused exclusively on the skills of relating to others, whereas items on the EQ-i's Interpersonal Relationships scale contains content that has to do with additional themes of sharing deep feelings, being cheerful, and being fun to be with. Similarly, Empathy on the ECR contains items that focus exclusively on understanding and connecting with others, whereas content on the EQ-i scale appears more broadly inclusive of themes involving compassion toward others, such as: ‘I would stop and help a crying child find his or her parents, even if I had to be somewhere else at the same time’ and ‘It's hard for me to see people suffer’. Likewise, Optimism on the ECR focuses on confidence in future outcomes, whereas Optimism on the EQ-i also appears to contain content that reflects aspects of self-assurance, such as, ‘I feel sure of myself in most situations’ and ‘I believe in my ability to handle most upsetting problems’. Similarly, Self-Control, which contains item content focused on being patient and managing stress, correlated with Impulse Control (.75), which also contains several items that appear to pull for anger. Results indicated that the ECR, although measuring similar constructs to the EQ-i, may also measure competencies more appropriate of behaviour in a professional context.
Correlation Coefficients Between ECR Scales and EQ-i Subscales (N = 33)
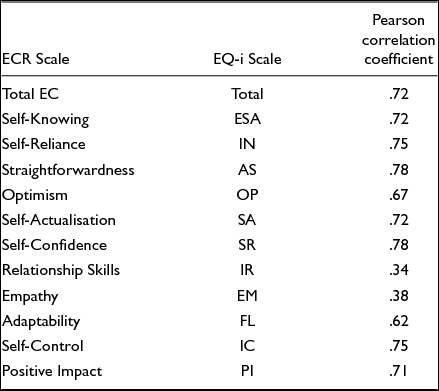
Note: EQ-i Abbreviations: ESA = Emotional Self-Awareness, IN = Independence, AS = Assertiveness, OP = Optimism, SA = Self-Actualisation, SR = Self-Regard, IR = Interpersonal Relationships, EM = Empathy, FL = Flexibility, IC = Impulse Control, PI = Positive Impression.
Criterion group validity
To investigate the potential relationship between EI and the emotional labour requirements of the job, job descriptions were coded according to four items about emotional labour identified by Joseph and Newman (Reference Joseph and Newman2010) and adapted from Grandey's (Reference Grandey2000) and Hochschild’s (Reference Hochschild1983) criteria for emotional labour jobs. Each item was coded ‘yes’ or ‘no’. Of the 6,874 participants, 4,638 provided sufficient job description data to identify their specific role. The mean emotional labour score for each job title was calculated. Emotional labour ratings were bimodal and showed a natural breaking point at .5, making this an ideal cut-off for high versus low emotional labour jobs. Examples of high emotional jobs included marketing and sales person, recruitment consultant, management consultant, travel agent, and human resources professional. Examples of low emotional labour jobs included law enforcement officer, military personnel, engineer, accountant, clerical work, government administrator, computer and IT technician, clerical work, and financial services professional.
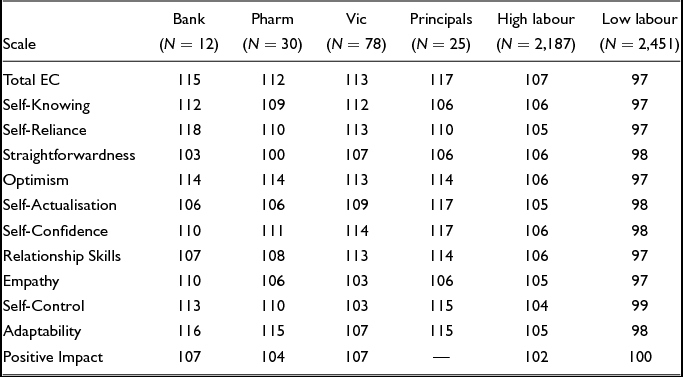
In order to compare the relative performance of participants with either high or low emotional labour jobs on the ECR with the normative group, raw scores were converted to standard scores based on the normative data of the ECR with a mean of 100 and standard deviation of 15. Independent t tests were conducted on high versus low emotional labour jobs and, as shown in Table 13, all scores for participants with high emotional labour jobs were higher than the scores for those with low emotional labour jobs. In addition, all high emotional labour scores were higher than the normative mean on all ECR scales. Results of our analyses support our hypothesis that jobs with high emotional labour requirements correlate with higher levels of EI.
ECR Standard Scores (t Scores) for Leadership Groups
Note: Independent t tests (High vs. Low Labour), were statistically significant at a Bonferroni adjusted alpha level of .004 for the Total scale and the 10 subscales. Bank = Australian bank; Pharm = pharmaceutical and healthcare industry; Vic = Leadership Victoria; Principals = high school principals.
In order to compare the relative performance of leaders on the ECR with the normative group, again, raw scores from four leadership groups were converted to standard scores based on the normative data of the ECR with a mean of 100 and standard deviation of 15. As shown in Table 13, all scores were higher than the normative mean on all ECR scales. In particular, this group of leaders scored almost one standard deviation above the mean on Total EC and the three component scales of Self-Reliance, Optimism, and Adaptability.
Discussion
The present study provided support for the validity and reliability of a new measure of mixed EI, the ECR (Newman & Purse, Reference Newman and Purse2007). The analysis showed that the theoretical groupings fit well with general mixed models of EI and provide empirically acceptable support for the factor structure of the emotional capital model. The 10 ECR scales demonstrated very good internal consistency and test–retest reliability, indicating that overall the ECR possessed good reliability.
Gender analyses revealed only minor differences between males and females, indicating that the ECR scales show a similar pattern of validity results for men and women. This finding is consistent with Joseph and Newman (Reference Joseph and Newman2010) who, in their meta-analysis of studies using mixed-models of EI, found no average sex-related differences. Minor gender differences, however, were noted on three scales: Relationship Skills and Empathy, where woman scored higher than men; and Self-Confidence, where men scored higher. Although statistically significant, the effect sizes in reality were small (2.0%, 3.9%, and 3.8% respectively). These findings are also consistent with Bar-On (Reference Bar-On1997), who found gender differences to be minor. We noted, however, that Bar-On also reported that females scored higher than males on Empathy, but reported a much larger effect size of 6.7%. This may be, at least in part, due to the fact that the normative sample for the EQ-i was largely drawn from the general population and limited to a North American population. By contrast, the normative data for the ECR was made up exclusively of professional groups from a much wider international sample. As such, it is possible that Empathy as a professional competency is more equally represented in both males and females working in a professional context. In other words, to compete and succeed in the professional environment requires that both males and females exhibit similar competency levels across all facets of their work. This is certainly consistent with Goleman's (Reference Goleman1995) claim that empathy plays a key role in determining professional success.
Age analysis revealed significant age effects across all scales. In general, the older groups scored higher than the younger groups and, typically, the 50+ group had the highest mean. Again, these findings are consistent with previous research that showed an increase in EI scores with age (Bar-On, Reference Bar-On1997; Day & Carroll, Reference Day and Carroll2004; Mayer, Caruso, & Salovey, Reference Mayer, Caruso and Salovey1999; Van Rooy, Alonso, & Viswesvaran, Reference Van Rooy, Alonso and Viswesvaran2005). We noted, however, this data was obtained from a single administration rather than a longitudinal study. Further research should test this finding using a longitudinal design.
Our results also showed that the ECR scales had a meaningful pattern of convergent validities in relation to measures of normal personality, depression, and psychopathology. This is perhaps not surprising, given that a number of proponents of EI (Goleman, Reference Goleman1995; Bar-On, Reference Bar-On, Bar-On and Parker2000) consider that high EI, in addition to being supportive of effective functioning in social and professional situations, is also protective against stress and strong negative emotion. We noted, however, that the relationship of the ECR to personality was far from straightforward.
One of the questions posed by this study was whether the behaviours associated with EI and measured by inventories like the ECR are in fact measuring something in addition to personality traits. Previous studies have found strong correlations (greater than .40) between mixed EI and personality as measured with the NEO-FFI (Bar-On, Reference Bar-On1997; Conte & Dean, Reference Conte, Dean and Murphy2006; Dwada & Hart, Reference Dawda and Hart2000), supporting critics’ claims that mixed EI exhibits significant overlap with the Big Five personality traits (Daus & Ashkanasy, Reference Daus and Ashkanasy2003). The majority of correlations between the ECR and the NEO PI-R were lower than those reported in previous studies and, while the relationship between EI and personality is complex — in particular, the question of incremental validity — the results suggest that the ECR may account for additional variance in criteria related to professional performance.
All 10 ECR scales correlated negatively with Neuroticism and, in particular, the Total EC scale (-.62). This is consistent with previous studies (Van Rooy, Reference Van Rooy, Alonso and Viswesvaran2005; Bar-On, Reference Bar-On1997). It is also consistent with studies that have found a strong relationship between mixed EI and mental and psychosomatic health (Martins et al., Reference Martins, Ramalho and Morin2010; Petrides, Perez-Gonzales, & Furnham, Reference Petrides, Perez-Gonzales and Furnham2007; Schutte, Malouff, Thorsteinsson, Bhullar, & Rooke, Reference Schutte, Malouff, Thorsteinsson, Bhullar and Rooke2007). The ECR appears to be measuring abilities that are protective against stress and negative emotions such as anxiety and depression. All ECR competencies correlated positively with the other four factors of the NEO PI-R. We noted, however, that the strength of many of the correlations, including negative correlations with Neuroticism, were weaker than previously reported in the literature. In terms of leadership, some would argue that certain aspects of high Neuroticism may be associated with greater achievement (Mughal, Walsh, & Wilding, Reference Mughal, Walsh and Wilding1996). Gooty et al. (Reference Gooty, Connelly, Griffith and Gupta2010) noted in their review a disproportionate interest in positive emotions and leadership, while negative emotions and leadership were either under-researched and/or always considered the culprits in leading. By contrast, it may be that in particularly threatening business environments where threats are subtle and disguised, for example, a certain degree of vigilance could be interpreted as adaptive. In other words, although the ECR is certainly measuring traits associated with emotional stability and resilience, this does not simply equate to low Neuroticism.
The dimensions of the Five-Factor Model of Personality that relate to social competence, such as extraversion and agreeableness, appeared to overlap with the ECR Relationship Skills and Empathy scales. Once again, the correlations were generally moderate, but it would be inaccurate to characterise introverts as socially inept and lacking in EI. There is also a possible downside of extraversion that is often linked to impulsivity and excitement seeking, and extraversion also correlates with narcissism (Matthews et al., Reference Matthews, Emo, Funke, Zeidner, Roberts, Costa and Schulze2006). Clearly, however, agreeableness has some clear advantages in relationships. More agreeable people are often more likeable and generally enjoy a higher quality of peer relationships and social interactions. However, agreeable individuals may also be vulnerable to submissiveness, which is not particularly adaptive to leadership success.
As previously noted, the data presented in Table 9 suggests that EI has a far from simple or straightforward relationship with personality. This is an old question in the field and has led to considerable debate in the literature. A persistent criticism is that self-report measures of EI add little, if any, predictive value over and above the basic personality dimensions (e.g., Matthews, Zeidner, & Roberts, Reference Matthews, Zeidner and Roberts2002; Schulte, Ree, & Carretta, Reference Schulte, Ree and Carretta2004). However, when investigating the incremental validity of self-report measures of EI, Petrides et al. (Reference Petrides, Perez-Gonzales and Furnham2007) point out that the emphasis on questions of incremental validity may be due to the fact that certain trait EI facets are already included in the established trait taxonomies (e.g., ‘assertiveness’, ‘adaptability’, ‘empathy’). They point out that ‘(a)s far as simple prediction is concerned, it would be interesting to establish whether trait EI can account for statistically significant portions of criterion variance, once the variance of the facets that it shares with the basic personality dimensions has been removed’ (pp. 48–49). Of course, removing overlapping variance due to duplication of facets is a real challenge, and there is no accepted method of achieving this. For now, our data agrees with Joseph and Newman (Reference Joseph and Newman2010), who have at least established that mixed models of EI are not simply redundant with personality traits, and with Matthews et al. (Reference Matthews, Emo, Funke, Zeidner, Roberts, Costa and Schulze2006), who have pointed out correctly that personality traits are distributed across many mechanisms, each imparting a small psychological bias. Given that Van Rooy et al. (Reference Van Rooy, Alonso and Viswesvaran2005) in their meta-analysis reported a .34 correlation between EI measured as a trait and personality, the question of the incremental validity of EI measures beyond other predictors remains to be determined. Future studies should examine this question systematically controlling for personality.
With regard to the relationship of the ECR to other measures of mixed EI, the ECR scales demonstrated good relationship to those scales of the EQ-i that appear to be measuring similar constructs. All correlations, with the exception of two, were relatively high and significant. However, the correlations suggest that scores on the ECR may account for additional variance in criteria related to leadership performance. This is particularly evident on scales such as Relationship Skills, which correlated with Interpersonal Relationships (.34), and Empathy, which correlated with the EQ-i's Empathy (.38), and, to some extent, Adaptability, which correlated with Flexibility (.62). An examination of the factor structure and content of these scales suggested that the content of the ECR scales appeared to be more homogeneous than the EQ-i scales. These differences in scale focus may help to explain some of the variance between the ECR and the EQ-i. What appears clear is that the ECR, although measuring similar constructs to the EQ-i, is also measuring constructs that pertain to the experience of professional people.
Given that that the normative group that supports the ECR consists of professional people from business, education, and medical fields, it is perhaps not surprising that the ECR would function differently than more general measures of EI.
One of the questions posed by the study was whether the ECR was capable of identifying jobs with high emotional labour. As expected, individuals with high emotional labour jobs scored significantly higher on EI than those with low emotional labour jobs. This is consistent with findings by Joseph and Newman (Reference Joseph and Newman2010); however, they primarily found a relationship between stronger emotional regulation and high emotional labour, whereas our study found those in the high emotional labour category to be significantly higher than the normative mean on all 10 ECR scales. Results supported the hypothesis that jobs with high emotional labour requirements correlate with higher levels of EI.
When ECR scores from four leadership groups were combined, we noted that they scored significantly higher than the ECR mean on all ECR scales. This suggests that the ECR has good criterion group validity and is capable of identifying those behaviours associated with leadership. Although the participants in this group were small, all differences were significant (p < .05), and the findings are consistent with the theoretical and empirical basis upon which the ECR was constructed, that the ECR is capable of identifying behaviour related to leadership. These findings, together with previous research, indicate that the relationship between EI and leadership has already reached sufficiency and stability (Gooty et al., Reference Gooty, Connelly, Griffith and Gupta2010). Future research should focus on incremental validity issues as well as investigate the relationships between EI competencies and leadership in specific industries. Nevertheless, the findings of this study provide further insight into the specific EI competencies that support effective leadership.
Conclusion
Overall, the results strongly indicate that the ECR possess adequate test design relative to models of mixed EI; that the ECR is an effective measure of EI and that it is capable of identifying behaviours associated with leadership benchmarks.
The findings indicate that the 77-item scale holds promise as a reliable, valid measure of EI as conceptualised by Newman and Purse (Reference Newman and Purse2007). Age and gender analyses revealed minor differences between males and females but suggest that age specific norms should be developed when using the tool to assess EI in people under 30 years of age. Results also indicated that jobs with high emotional labour requirements correlate with higher levels of EI. ECR scores were not affected by response style.
The ECR scales had a meaningful pattern of convergent validities in relation to measures of normal personality and previous measures of EI, but results also suggest that the ECR measures something other than simply personality. It is advised that further research examine the predictive validity of EI when controlling for personality and leadership performance ratings.