Introduction
How species can become invasive is a core issue in invasive biology. Invasive species usually face new selective pressures when they are initially introduced into novel environments. How to deal with these pressures directly determines their fate (Matesanz et al. Reference Matesanz, Gianoli and Valladares2010). Generally, invasive species are expected to have low genetic variation, due to genetic bottlenecks and founder effects (Dlugosch and Parker Reference Dlugosch and Parker2008), which may not be enough to support their survival (Crawford and Whitney Reference Crawford and Whitney2010). However, they are still able to successfully colonize new habitats and defeat native species. Epigenetic variation may play a critical role in this process and may facilitate invasive species’ rapid response to environmental stress (Ni et al. Reference Ni, Li, Lin, Xiong, Huang and Zhan2018).
Revealing populations’ epigenetic variation has attracted increasing attention from invasive biologists. Independent from genetic control, epigenetic modifications can be directly induced by environmental stimuli and are reflected in phenotypic changes through modulation of gene expression without changing the underlying DNA sequences (Ni et al. Reference Ni, Li, Lin, Xiong, Huang and Zhan2018; Richards et al. Reference Richards, Alonso, Becker, Bucher and Colomé-Tatché2017; Shi et al. Reference Shi, Chen, Gao, Xu, Ou, Bossdorf, Yang and Geng2019). As an additional, accelerated pathway to evolutionary change (Bossdorf et al. Reference Bossdorf, Richards and Pigliucci2008), epigenetic modifications of various types, such as DNA methylation, modifications on histones and other chromosomal proteins, and the generation of extrachromosomal regulatory small RNAs and noncoding RNAs, have been widely described in eukaryotes (Ni et al. Reference Ni, Li, Lin, Xiong, Huang and Zhan2018; Richards et al. Reference Richards, Alonso, Becker, Bucher and Colomé-Tatché2017). Among these, DNA methylation is regarded as the most common type of epigenetic variation and has been intensively studied for eukaryotes. DNA methylation is referred to as the addition of a methyl group to cytosine to form 5-methylcytosine. It has been shown to function in multiple biological processes, including hindering transcription initiation, restraining transcription elongation, silencing transposons, inactivating the X chromosome, and shaping phenotypic variation (Akimoto et al. Reference Akimoto, Katakami, Kim, Ogawa, Sano, Wada and Sano2007; Jones Reference Jones2012; Ni et al. Reference Ni, Li, Lin, Xiong, Huang and Zhan2018). For plants, cytosine methylation is maintained by methyltransferase, chromomethylase, or an RNA-dependent DNA methylation pathway; it tends to position in symmetric (CG, CHG) and asymmetric (CHH) contexts (H = A, C, or T) and mainly distribute in transposons and repeat regions (Henderson and Jacobsen Reference Henderson and Jacobsen2007). In non-model plants, the global DNA methylation state can be screened in natural populations using methylation-sensitive amplified polymorphism (MSAP) markers (Angers et al. Reference Angers, Castonguay and Massicotte2010), a restriction enzyme-based modified amplified fragment-length polymorphism (AFLP) technique. In addition, the MSAP technique can also provide a quick glance for potential effects of environmental factors on population epigenetic differentiation.
In a heterogeneous environment, climate may exhibit high spatial variation that acts as an important abiotic factor to promote adaptive evolution of plants (Abdala-Roberts and Marquis Reference Abdala-Roberts and Marquis2007; Savolainen et al. Reference Savolainen, Pyhäjärvi and Knürr2007). Climate not only profoundly influences seed germination, productivity, and distribution of plants, but also controls other critical variables like the length of a wet or dry season (Concilio et al. Reference Concilio, Chen, Ma and North2009; Poncet et al. Reference Poncet, Herrmann, Gugerli, Taberlet, Holderegger, Gielly, Rioux, Thuiller, Aubert and Manel2010). Correlations between climatic factors and epi-adaptive evolution have been found in a number of plants. For instance, an adaptive epigenetic memory of the local temperature prevailing during zygotic embryogenesis and seed maturation has been observed in the progeny of Norway spruce [Picea abies (L.) Karst.] (Yakovlev et al. Reference Yakovlev, Asante, Carl, Junttila and Johnsen2011). Associations between DNA methylation variation and climate variables were also detected in Arabidopsis thaliana: CHH methylation was found to increase with temperature and concentrate in transposable elements, whereas CG methylation showed a correlation with the latitude of origin and primarily occurred on genic regions (Dubin et al. Reference Dubin, Zhang, Meng, Remigereau, Osborne, Paolo, Drewe, Kahles, Jean, Vilhjálmsson, Jagoda, Irez, Voronin, Song and Long2015; Keller et al. Reference Keller, Lasky and Yi2016). These findings underscore the contribution of epigenetic variation to local adaptation. Currently, rapid climatic change is exerting new selection pressure on plants, which will eventually affect their adaptability (Corre and Kremer Reference Corre and Kremer2012; Eveno et al. Reference Eveno, Collada, Guevara, Léger, Soto, Díaz, Léger, González-Martínez, Cervera, Plomion and Garnier-Géré2008; Jump et al. Reference Jump, Hunt, Martinez-Izquierdo and Peñuelas2006). For invasive species, investigating the contribution rate of climatic factors to epi-adaptation may provide better understanding of the mechanisms underlying response to climate change and improve the prediction for expansion speed and area.
Soil is another crucial factor associated with plant adaptive evolution (Hancock et al. Reference Hancock, Brachi, Faure, Horton, Jarymowycz, Sperone, Toomajian, Roux and Bergelson2011). It provides essential nutrients for plants, including water, mineral matter, organic matter, and metal elements. Any subtle change in soil metal content has the potential to drive local adaptation of plants (Alberto et al. Reference Alberto, Niort, Derory, Lepais, Vitalis, Galop and Kremer2010). Because changes in soil compositions have a strong impact on biochemical and physiological processes of plants, they are frequently posited to be an important driver of divergent selection (Lechowicz and Bell Reference Lechowicz and Bell1991; Macel et al. Reference Macel, Lawson, Mortimer, Šmilauerova, Bischoff, Crémieux, Doležal and Andrew2007). Soil factor–driven population-level genetic differentiation and adaptive loci associated with soil properties and metal content have been found in plants such as [Arabidopsis halleri (L.) O’Kane & Al-Shehbaz] (Meyer et al. Reference Meyer, Vitalis, Saumitou-Laprade and Castric2009), common gum cistus (Cistus ladanifer L.) (Quintela-Sabarís et al. Reference Quintela-Sabarís, Ribeiro, Poncet, Costa, CastroFernández and Fraga2012), and [Eucalyptus tricarpa (L.A.S. Johnson) L.A.S. Johnson & K.D. Hill] (Steane et al. Reference Steane, Potts, Mclean, Collins, Prober, Stock, Vaillancourt and Byrne2015). It is of note that changes in soil water content, temperature, and organic matter are closely related to climate change, so specific plant genotypes may be generated under the simultaneous selection by climate and soil factors (Fischer and Whitham Reference Fischer and Whitham2014). As for epipopulation genetics, Kim et al. (Reference Kim, Im and Nkongolo2016) have reported the soil metal–associated adaptive methylation variation in red maple (Acer rubrum L.).
Mile-a-minute (Mikania micrantha Kunth; tribe Eupatorieae, family Asteraceae) is a highly invasive weed. It is a perennial terrestrial herbaceous vine with a slender and branched stem, having a creeping or twining growth habit. As its common name indicates, M. micrantha shows a strong invasiveness, which is due to its efficient sexual and vegetative reproduction coupled with wind-dispersed seed (Swamy and Ramakrishnan Reference Swamy and Ramakrishnan1987). It also demonstrates a strong phenotypic plasticity in the introduced environmental conditions (Hong et al. Reference Hong, Pan, Hu, Shen and Xu2006; Wen et al. Reference Wen, Ye, Feng and Cai2000; Xu et al. Reference Xu, Shen, Zhang, Li and Zhang2013, Reference Xu, Shen and Zhang2014). This weed is highly destructive for local plants, smothering them and blocking sunlight. Mikania micrantha has caused serious damage to local biodiversity and agricultural ecosystems. Originating from Latin America, M. micrantha was introduced into Hong Kong in 1884 for horticultural purposes (Wang et al. Reference Wang, Liao, Zan, Li, Zhou and Gao2003). It became naturalized in 1919 and started to expand on a large scale in southern China since 1984 (Wang et al. Reference Wang, Liao, Zan, Li, Zhou and Gao2003). With recent climatic change, M. micrantha has shown the potential to invade to inland provinces such as Jiangxi in China (Hu et al. Reference Hu, Li and Wei2014).
In this study, we used MSAP, in junction with environmental conditions, to explore the (epi)genetic variation and local adaptation of introduced M. micrantha populations in southern China. Our specific objectives are: (1) to estimate and compare the amount and structuring of genetic and epigenetic variation in the introduced populations; (2) to identify the candidate (epi)loci for selection that are associated with local climatic/soil factors; and (3) to search for the selective effects of environmental variables on population expansion. In addition, we examined the correlation between leaf shape variation and methylation-state change.
Materials and Methods
Sample Collection
To cover as much of the substantial environmental gradient of M. micrantha as possible, we collected 306 individuals from 21 invasive populations in Dongguan, Nei Lingding Island, Hong Kong, Macao, Shenzhen, and Zhuhai in southern China (Figure 1; Table 1). Leaves were first stored in silica gel and then at −20 C until DNA extraction. Total genomic DNA was isolated using the modified CTAB method (Porebski et al. Reference Porebski, Bailey and Baum1997). The quality and quantity of DNA were measured using a NanoDrop 2000 spectrophotometer (Thermo Scientific, Wilmington, DE, USA). In addition, we measured the leaves of M. micrantha in different populations with the same growth period. Length:width ratio was used as a metric of leaf phenotypic variation.
Sampling map of 21 Mikania micrantha populations in southern China. See Table 1 for population codes.

Sampling information of Mikania micrantha populations.

a DG, Dongguan; HK, Hong Kong; MA, Macao; NLD, Nei Lingding Island; SZ, Shenzhen; ZH, Zhuhai.
MSAP Assay
We selected a pair of isoschizomers, MspI and HpaII, which recognize and cleave the same 5′-CCGG-3′ sequence with different sensitivities to the methylation at the internal or external cytosine (Schulz et al. Reference Schulz, Eckstein and Durka2013). Total genomic DNA was digested at 37 C for 3 h in two parallel reactions using 10 U EcoRI and 5 U HpaII or 10 U MspI (New England Biolabs, Beverly, MA, USA) in a final volume of 20 μl, followed by 65 C for 20 min to inactivate the enzymes. EcoRI and HpaII/MspI adapters were ligated to digested products, and the reaction was carried out in a 20-μl volume containing 5 pmol adaptor and 60 U of T4 DNA ligase (New England Biolabs). After incubation at 16 C overnight, the reaction was heat deactivated at 65 C for 20 min. All adapter and primer sequences for the MSAP protocol are listed in Table 2.
Information for adopted adapters and primers used in this study.

A preselective polymerase chain reaction (PCR) was performed in a total volume of 20 μl, containing 10 μl of the ligation product, 5 pmol of each preselective primers, 1 U Taq DNA polymerase (Takara), and 3.75 mmol dNTP (with Mg2+). Thermocycling conditions were as follows: 94 C for 5 min followed by 20 cycles of 94 C for 40 s, 56 C for 45 s, and 72 C for 1 min. After preselective amplification, the PCR products were diluted 1:50 with sterile distilled water.
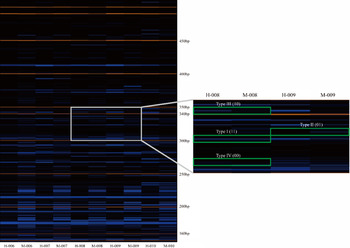
We selected 31 EcoRI and MspI/HpaII primer combinations for selective PCRs (Table 2). The amplification reaction was performed in a total volume of 20 μl with 3.75 mmol dNTP (with Mg2+), 5 pmol of fluorescently labeled (6-FAM) forward primer, 5 pmol of reverse primer, 1.25 U of Taq DNA polymerase, and 2.5 μl of diluted preselective PCR product. The PCR profile was as follows: 94 C for 5 min, 13 touchdown cycles of 94 C for 30 s, 65 C for 30 s reduced by 0.7 C per cycle, and 72 C for 1 min; 23 cycles of 94 C for 30 s, 56 C for 30 s, and 72 C for 1 min, and a final elongation step at 72 C for 7 min. Selective PCR products were separated and visualized on an ABI 3730 DNA analyzer (Applied Biosystems, Foster City, CA, USA) with internal size standard LIZ 500 (Figure 2). Final profiles were analyzed using GeneMarker v. 2.2.0 software (SoftGenetics, State College, PA, USA), and translated into a presence (1)/absence (0) data matrix. To minimize the potential impact of size homoplasy (Caballero et al. Reference Caballero, Quesada and Rolan-Alvarez2008), we selected fragments ranging from 150 bp to 500 bp. A peak height threshold was set as 1,000 to 30,000. Furthermore, to ensure low error rates, an E4-H/M3 primer pair was used to assess the reproducibility of the MSAP assay in 306 individuals. Error rate was estimated as only 0.027%.
Methylation-sensitive amplified polymorphism (MSAP) electrophoresis was performed on an ABI 3730 DNA analyzer with internal size standard LIZ 500 for E7/H8 primer combination. H and M represent digestion with EcoRI/HpaII and EcoRI/MspI, respectively. Blue and orange bands show the amplification products and the standard marker, respectively.

Methylation Scoring
As isoschizomers, HpaII and MspI cleave the same sequence (CCGG) with subtle differences. The former only recognizes methylated external cytosine on a single strand, while the latter recognizes methylated internal cytosine on a single or both strands. Hence, four methylation types can be obtained: Type I denotes no methylation due to cleavage by both enzymes; Type II denotes full-/hemi-methylation of internal cytosine only when MspI cuts; Type III denotes hemi-methylation of external cytosine only when HpaII cuts; and Type IV is free of any enzyme cutting, possibly due to full methylation of external cytosine, full methylation of both cytosines, hemi-methylation of both cytosines, or a restriction site mutation. In this study, Type IV was considered to be uninformative, because it could be attributed to multiple and equivocal reasons.
Three scoring approaches were adopted for our data (Schulz et al. Reference Schulz, Eckstein and Durka2013): (1) EcoRI/MspI data were treated using the methylation-sensitive (MS)-AFLP “10” matrix or genetic matrix; (2) Type II and Type III were considered to be methylated loci “1,” while the other two types were marked as “0,” which we called the “Salmon matrix” or “Salmon Scoring” (Salmon et al. Reference Salmon, Clotault, Jenczewski, Chable and Manzanares-Dauleux2008); (3) a “Mixing Scoring 2” method was used to obtain four different matrices: H, M, U, and HMU matrix. In matrix H, only Type III was considered as “1”; in matrix M, only Type II was considered as “1”; in matrix U, only Type I was regarded as “1”; and matrix HMU included H, M, and U in order (Table 3). All our analyses proceeded based on these six matrices.
Methylation status, band pattern, and scoring methods.

Soil Chemical Analyses
Soil samples collected from 21 M. micrantha invasive populations were air-dried for 14 d and ground to pass through a sieve with an aperture size of 1 mm and 0.2 mm, respectively. Water contents of fresh and air-dried soil were determined by oven-drying for 6 h at 105 C. Soil pH and electrical conductivity were measured in a solution of soil mixed with water at a ratio of 200 g L−1 using a pH meter (DPS-307A, INESA, Shanghai, China) and a conductivity meter (DPS-307A, INESA, Shanghai, China), respectively. Soil organic matter content was measured by using the potassium dichromate volumetry method. Soil total nitrogen was quantified by the Kjeldahl method using a KjeltecTM 8400 Analyzer Unit (Foss, Hillerod, Denmark) after digestion at a ratio of 100 g L−1 soil to H2SO4. Total carbon was determined in a total organic carbon analyzer (Shimadzu, Kyoto, Japan) at 720 C. Soil K, Ca, Na, Mg, Al, P, S, Si, Fe, Mn, Zn, Cu, Pb, Cr, As, Se, Ni, and Cd were assayed using an inductively coupled plasma optical emission spectrometer (ICP-OES, PerkinElmer, Waltham, MA, USA) after digestion with HNO3/HCl/HF at a ratio of 3:1:1 (v/v/v) using a MARS 6 Microwave Reaction System (CEM, Matthews, NC, USA). Experimental treatments without soil samples served as a control. All measurements were repeated three times.
Data Analysis
GenAlEx v. 6.41 (Peakall and Smouse, Reference Peakall and Smouse2012) was used to assess (epi)genetic parameters, including observed number of alleles (N a), effective number of alleles (N e), Shannon’s diversity index (I), number of private bands, percentage of polymorphic loci (%P), expected heterozygosity (H e), and unbiased expected heterozygosity (UH e). We also calculated pairwise geographic distance and (epi)genetic distance matrices between populations.
Analysis of molecular variance (AMOVA) was carried out using Arlequin v. 3.5 (Excoffier and Lischer Reference Excoffier and Lischer2010) to estimate MS-AFLP genetic and epigenetic variation partitioned among groups of populations (F ct), among populations within groups (F sc), and among populations (F st) with 10,000 permutations. A Mantel test was performed to explore linear correlation between geographic distance and (epi)genetic distance. A partial Mantel test was used to detect correlation between MS-AFLP genetic matrix and different epigenetic matrices. Significance level was evaluated using 10,000 permutations (Smouse et al. Reference Smouse, Long and Sokal1986).
We assessed (epi)genetic structure by using Structure v. 2.3.4 (Falush et al. Reference Falush, Stephens and Pritchard2007) to allocate individuals into clusters based on a Bayesian clustering method. The best K value was determined according to Ln P (D), which is an estimate of the posterior probability of the data for a given K, and ΔK. Principal coordinate analysis (PCoA) based on Dice’s distance matrices (Zoldoš et al. Reference Zoldoš, Biruš, Muratović, Šatović, Vojta, Robin, Pustahija, Bogunic, Vicic and Siljak-Yakovlev2018) was performed to visualize the population relationship using PAST v. 3.18 (Hammer et al. Reference Hammer, Harper and Ryan2011). Sequentially, the “10” data set was aligned in MEGA v. 6.0 and further converted to a nexus format (Tamura et al. Reference Tamura, Steche, Peterson, Filipski and Kumar2013). An UPGMA tree was constructed using PAUP v. 4.0 with 1,000 permutations (Swofford Reference Swofford2001). Candidate adaptive loci were identified using Dfdist (Beaumont and Nichols Reference Beaumont and Nichols1996) and BayeScan 2.1 (Foll and Gaggiotti Reference Foll and Gaggiotti2008). The former was conducted to detect outliers with 50,000 simulations with a 99.5% confidence interval (CI), while the latter was run with a sample size of 5,000, a thinning interval of 20, and 10 pilot runs of 5,000 iterations for burn-in. Only loci that were simultaneously detected by Dfdist and with a strong detection level (posterior odds, PO ≥ 100) in BayeScan were considered as candidate adaptive loci. Samβada v. 0.4.5 (http://lasig.epfl.ch/sambada; Joost et al. Reference Joost, Bonin, Bruford, Després, Conord, Erhardt and Taberlet2007; Stucki et al. Reference Stucki, Orozco-Terwengel, Forester, Duruz, Colli, Masembe, Negrini, Landguth and Jones2017) was adopted to identify candidate loci that may play important roles in response to changing environments. To ensure accuracy, we also applied the spatial analysis method (SAM) to identify the correlation of candidate loci and environmental factors, including climatic and soil variables based on multiple univariate logistic regression (Joost et al. Reference Joost, Bonin, Bruford, Després, Conord, Erhardt and Taberlet2007). Climatic data were downloaded from WorldClim v. 2 (http://www.worldclim.org) and extracted by ArcGis software. Soil data were generated in our lab (see above). Linkage disequilibrium (LD) among adaptive loci was detected using TASSEL software (Bradbury et al. Reference Bradbury, Zhang, Kroon, Casstevens, Ramdoss and Buckler2007) with criteria of R2 > 0.3 and P < 0.001 (Keller et al. Reference Keller, Levsen, Olson and Tiffin2012).
In addition, SAM (Joost et al. Reference Joost, Bonin, Bruford, Després, Conord, Erhardt and Taberlet2007) was also used to analyze the large-scale spatial (epi)genetic structure. Shannon’s diversity index (I) was used for population diversity data. Distances were divided into five classes according to the maximum actual distance between two populations (85 km). SAM analyses were conducted with 9,999 permutations and 95% CI. The fine-scale spatial (epi)genetic structure was assessed by linear regression of pairwise relationship coefficients for 10 distance classes using SPAGeDi v. 1.3 (Hardy and Vekemans Reference Hardy and Vekemans2002).
We collected geographic information such as longitude and latitude of M. micrantha in southern China from the literature, the Global Biodiversity Information Facility (https://www.gbif.org), the National Specimen Information Infrastructure (http://www.nsii.org.cn), and the Chinese Virtual Herbarium (http://www.cvh.ac.cn). After removal of duplicate locations, we obtained 298 distribution sites for niche model prediction. Maxent software (Phillips et al. Reference Phillips, Anderson and Schapire2006) was used to predict current and future distribution of M. micrantha with 10 cross-validated replicated runs, of which the latter proceeded based on the HadGEM2-ES and RCP4.5 model (Collins et al. Reference Collins, Bellouin, Doutriaux-Boucher, Gedney, Halloran, Hinton, Hughes, Jones, Joshi, Liddicoat, Martin, O’Connor, Rae, Senior and Sitch2011; Thomson et al. Reference Thomson, Calvin, Smith, Volke, Patel, Delgado-Arias, Bond-Lamberty, Wise, Clarke and Edmonds2011). Area under the curve (AUC) was used to assess model performance. AUC values > 0.9 are usually taken as an indicator of high-accuracy models (Swets Reference Swets1988) and efficient model performance (Manel et al. Reference Manel, Williams and Ormerod2001).
Sequencing of Methylated Polymorphic Fragments
After 6% denaturing polyacrylamide gel electrophoresis and silver staining for visualization, clear and methylated bands were extracted, purified, and sequenced (Zhou and Wang Reference Zhou and Wang2013) (Guangzhou Tsingke Biotechnology, Ltd., Guangzhhou, Guangdong, China). Their sequences were BLAST searched against the NCBI and Ensembl databases.
Results and Discussion
Impacts of MSAP Scoring Approaches on (Epi)genetic Variation Estimates
This is the first report on effects of environmental factors on population epigenetic differentiation in M. micrantha using MSAP. So far, there exists no consensus method for scoring the information generated from the MSAP banding patterns. As for the six matrices we generated, except for the MS-AFLP genetic matrix, all other matrices were treated as epigenetic data. Of note, Mixing Score 2 included matrices H, M, and U, which were further combined into matrix HMU. Descriptive (epi)genetic parameters were then estimated for all six matrices at the population, regional, and species levels (Table 4; Supplementary Table S1). For each matrix, differences were found for such (epi)genetic parameters as the number of alleles and effective alleles, Shannon information index (I), percentage of polymorphic loci (%P), expected heterozygosity (H e), and unbiased expected heterozygosity (UH e) (Friedman test, P < 0.05). At the species level, the highest (epi)genetic diversity occurred in the Salmon matrix, while the lowest was in the U matrix. Our results are consistent with Schulz et al.’s (Reference Schulz, Eckstein and Durka2013) findings that scoring schemes had strong effects on the estimates of epigenetic diversity and differentiation. In this study, we adopted both Salmon Scoring and Mixing Scoring 2 to evaluate the epigenetic variation of M. micrantha. In comparison to Salmon Scoring, Mixing Scoring 2 incorporates scoring for both methylated and unmethylated bands, utilizing more of the underlying banding pattern information. Nevertheless, it needs to be noted that there does not seem to be one best method for scoring MSAP bands for multilocus analyses (Schulz et al. Reference Schulz, Eckstein and Durka2013).
Genetic and epigenetic diversity in regions based on the six matrices.

a N, number of samples; N a, number of different alleles; N e, number of effective alleles = 1/(p 2 + q 2); I, Shannon’s diversity index = −1*[p*Ln (p) + q*Ln(q)]; %P, percentage of polymorphic loci; H e, expected heterozygosity = 2*p*q; UH e, unbiased expected heterozygosity = [2N/(2N − 1)]*H e.
b DG, Dongguan; HK, Hong Kong; MA, Macao; NLD, Nei Lingding Island; SZ, Shenzhen; ZH, Zhuhai.
MS-AFLP genetic matrix was used to survey genetic diversity (Foust et al. Reference Foust, Preite, Schrey, Alvarez, Robertson, Verhoeven and Richards2016; Schulz et al. Reference Schulz, Eckstein and Durka2013). We detected 1,800 polymorphic MS-AFLP genetic loci, whose percentage (%P) ranged from 16.17% to 40.5%. The Shannon diversity index (I) varied from 0.052 to 0.137, while the expected heterozygosity (H e) ranged from 0.031 to 0.083. These results are not quite consistent with those obtained by using actual AFLP to assess M. micrantha (Wang et al. Reference Wang, Chen, Zan, Wang and Su2012). Similar instances have been observed in South African ragwort (Senecio inaequidens DC) (Lachmuth et al. Reference Lachmuth, Durka and Schurr2010; Monty et al. Reference Monty, Bizoux, Escarré and Mahy2013). This is not unexpected, considering that MSAP is technically a modification of AFLP.
We also evaluated epigenetic parameters. Based on the Salmon matrix, 2,523 polymorphic loci were identified with percentages of 31.11% to 41.78%; I and H e values ranged from 0.110 to 0.138 and 0.066 to 0.084, respectively. Using the H matrix, 2,260 were identified as polymorphic loci with percentages of 20.49% to 38.1%; I valued from 0.06 to 0.109, and H e from 0.035 to 0.063. For the M matrix, 1,487 polymorphic loci were detected with percentages of 13.45% to 39%; I varied from 0.042 to 0.128, and H e from 0.025 to 0.078. For the U matrix, 1,239 polymorphic loci were detected with percentages of 12.5% to 33.82%; I ranged from 0.035 to 0.094, and H e from 0.02 to 0.055. The HMU matrix produced a total of 4,966 loci, with %P from 21.1% to 33.33%, I from 0.002 to 0.092, and H e from 0.002 to 0.054.
Patterns of Population (Epi)genetic Variation and the Association of Epigenetic Variation with Leaf Plasticity
In this study, a total of 2,840 scorable polymorphic loci were obtained using 31 pairs of selective PCR primers across 306 individuals. Overall, the percentage of hemi-methylated loci ranged from 33.89% (SZ4) to 68.33% (MA1), with an average of 41.69%, followed by fully methylated loci from 19.40% (MA1) to 46.89% (SZ4), with an average of 39.09%. By contrast, the percentage of unmethylated loci ranged from 12.28% (MA1) to 26.51% (HK8), with an average of 19.23% (Table 5). Hong Kong populations exhibited the lowest level of full methylation.

Twenty-one populations were found to have three different methylation levels (t-test, P < 0.05), and different methylation levels were also detected at regional levels. Total methylation (full and hemi-methylation) was different between Macao and Hong Kong and the other four regions. For hemi- or full methylation, Macao, Hong Kong, and Zhuhai each were found to be different from the other regions. Regarding hemi-methylation, a significant difference was detected between Nei Lingding and Zhuhai.
Mikania micrantha had the highest epigenetic diversity at the species level based on Salmon Scoring, followed by MS-AFLP genetic variation, implying that methylation variation plays a role in its invasive evolution. The genetic variation of M. micrantha is lower (0.08) in comparison to other invasive plants like lantana (Lantana camara L.) (0.28), annual bluegrass (Poa annua L.) (0.17), maritime pine (Pinus pinaster Aiton) (0.15) (Blignaut et al. Reference Blignaut, Ellis and Le Roux2013), S. inaequidens (0.30) (Monty et al. Reference Monty, Bizoux, Escarré and Mahy2013), and smooth cordgrass (Spartina alterniflora Loisel.) (0.38) (Foust et al. Reference Foust, Preite, Schrey, Alvarez, Robertson, Verhoeven and Richards2016), based on the same molecular marker. Importantly, M. micrantha also has lower epigenetic variation (0.04 to 0.08) than another invasive plant, S. alterniflora (0.37) (Foust et al. Reference Foust, Preite, Schrey, Alvarez, Robertson, Verhoeven and Richards2016). In addition, it also maintains lower population-level genetic differentiation compared with other invasive Asteraceae plants in China like Jack in the bush [Chromolaena odorata (L.) R.M. King & H. Rob.] and Santa Maria feverfew (Parthenium hysterophorus L.) (Ma et al. Reference Ma, Geng, Wang, Zhang, Fu and Shu2011; Tang et al. Reference Tang, Wei, Zeng, Li, Tang, Zhong and Geng2009; Ye et al. Reference Ye, Mu, Cao and Ge2004). The low level of population-level genetic differentiation of M. micrantha might be related to its clonal reproduction and relatively short invasive history in China.
Compared with noninvasive species, invasive species tend to display higher phenotypic plasticity (Davidson et al. Reference Davidson, Jennions and Nicotra2011). In this study, the length:width ratio was used to characterize leaf shape and evaluate leaf plasticity (Figure 3). Leaf shape was found to exhibit considerable difference among populations. In particular, leaf shape in Nei Lingding was much different from that in Dongguan, Hong Kong, and Macao. Pearson analysis showed that leaf shape was significantly related to H matrix–based N e (r2 = 0.502), H e (r2 = 0.468), and UH e (r2 = 0.497) and the full-methylation level (r2 = −0.433) at the population level; and I (r2 = 0.865) and UH e (r2 = 0.816) at the regional level (P < 0.05). These results imply that the leaf shape variation of M. micrantha may be linked to methylation-state changes. Similarly, Gao et al. (Reference Gao, Geng, Li, Chen and Yang2010) described the correlation between phenotypic variation and methylation alternations in the invasive weed alligatorweed [Alternanthera philoxeroides (Mart.) Griseb.].
Leaf shape of Mikania micrantha varied by population and region. (A) Leaf shape parameter in 21 populations. (B) Leaf shape variation in six regions. (C) A high leaf length:width ratio is represented using individual 6 of the HK5 population. (D) A low leaf length:width ratio is represented using individual 11 of the NLD3 population. See Table 1 for population codes.

Population (Epi)genetic Differentiation among Regions
Based on regions, the 21 populations were divided into six groups, and AMOVA was performed (Table 6). Populations exhibited higher levels of epigenetic differentiation than genetic differentiation. F st values among Hong Kong populations were found to be significantly higher than those among the Dongguan, Macao, Nei Lingding, and Zhuhai populations, but similar to those of Shenzhen populations (P < 0.05; Table 7).
Results of analysis of molecular variance (AMOVA).

a F sc , (epi)genetic variation among populations within groups; F st , (epi)genetic variation among populations; F ct , (epi)genetic variation among groups.
F st value from six matrices at regional and species levels.a

a DG, Dongguan; HK, Hong Kong; MA, Macao; NLD, Nei Lingding Island; SZ, Shenzhen; ZH, Zhuhai.
F st , (epi)genetic variation among populations.
Based on the genetic matrix, intrapopulation and interpopulation variation accounted for 80.61% and 19.39% of the total variation, respectively. As for the epigenetic Salmon matrix, 86.45% and 13.55% of the variation resided within and among populations separately. When using the H, M, U, and HMU matrices, 87.72%, 82.34%, 85.08%, and 85.30% of the variation were partitioned within populations, while 12.29%, 17.66%, 14.92%, and 14.70% were among populations, respectively.
Genetic differentiation (F st = 0.1939) was higher in comparison to epigenetic differentiation (F st: 0.1229 to 0.1766; Table 6). A Mantel test was performed based on Nei’s genetic distance and geographic distance between populations. Except for the U matrix, most matrices were found to have a significant correlation between geographic and (epi)genetic distance (P < 0.05). Among them, the highest correlation occurred with the Salmon matrix (r2 = 0.235), while the lowest occurred with the M matrix (r2 = 0.178). It is of interest to note that no clear geographic genetic structure was detected among the roadside populations of M. micrantha in southern China when using microsatellite markers (Geng et al. Reference Geng, Chen, Cai, Cao and Ouyang2017).
The relationship between the genetic and five epigenetic matrices was further investigated. The correlation index was 0.8951, 0.4812, 0.9404, 0.7528, and 0.9192 for the Salmon, H, M, U, and HMU matrices, respectively, indicating a high correlation between genetic and epigenetic variation.
Investigation of Spatial (Epi)genetic Structure
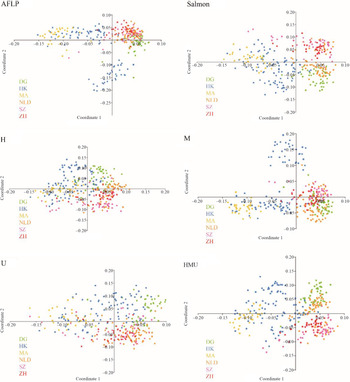
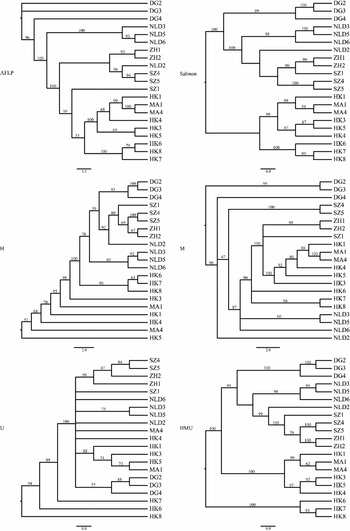
We found that there was a clear (epi)genetic structure in genetic, Salmon, and M matrix (Figure 4). Based on the genetic matrix, the Hong Kong and Macao populations formed one cluster, while the remaining populations formed another. Comparatively, epigenetic structure was more complex (Figure 4). Different epigenetic matrices yielded distinct clustering results, indicating the potential effects of methylation states on population structure. Based on the M matrix, the Hong Kong and Macao populations also formed one cluster; three Nei Lingding populations (NLD3, NLD5, and NLD6) clustered into one group together with Dongguan populations, while one Nei Lingding population (NLD2) clustered into another group with Shenzhen and Zhuhai populations. The epigenetic structure constructed from the Salmon matrix was more subtly complicated. The structure between the four Nei Lingding populations and the other populations was similar to that from the M matrix, with the main difference seen with the Hong Kong populations; three Hong Kong populations (HK6, HK7, and HK8) clustered together, while the other four (HK1, HK3, HK4, and HK5) grouped with the Macao populations. As for the other three matrices, H, U, and HMU, no clear epigenetic structure was detected. PCoA and UPGMA revealed similar results (Figures 5 and 6), with subtle differences when using the HMU matrix, in which the Hong Kong populations (HK1, HK3, HK4, and HK5) grouped with the Macao populations in the UPGMA tree (Figure 6). These results suggested that there existed a certain degree of gene flow between the populations and highlighted the importance of Hong Kong populations in the invasion of M. micrantha in southern China; the Hong Kong and Macao populations tend to cluster together based on either genetic or epigenetic data. This may be related to historical reasons, as Hong Kong had more trade exchange with Macao than mainland China in the 1980s, which possibly contributed to the population mixture (Wang et al. Reference Wang, Liao, Zan, Li, Zhou and Gao2003; Zhang et al. Reference Zhang, Ye, Cao and Feng2004).
STRUCTURE results with different K values for the six matrices. See Table 1 for population codes.

Principal coordinate analysis (PCoA) results for the six matrices. See Table 1 for population codes.

UPGMA tree computed using PAUP based on the six matrices. The number on the branch indicates the bootstrap value. See Table 1 for population codes.

We further examined spatial (epi)genetic structure at two scales. At the large scale, for the genetic matrix, a significant negative Moran’s I value (−0.272, P = 0.035) was observed for the 80- to 100-km distance class. Similarly, for the Salmon matrix, a significant negative I value (−0.743, P = 0.021) was returned for the same distance class. For the H matrix, a significant negative I value (−0.29, P = 0.035) was detected in the 20- to 40-km distance class. Base on the M matrix, a significant positive I value (0.265, P = 0.047) was detected in the 0- to 20-km distance class, while a significant negative I value (−0.341, P = 0.028) was observed in the 40- to 60-km distance class. No significant value was detected for I for any distance classes based on the U and HMU matrices (Figure 7).
Large-scale spatial structure with five distance classes based on the six matrices. An asterisk (*) indicates significance level (P < 0.05).

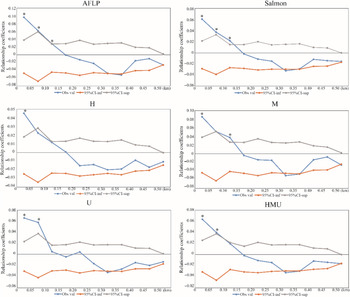
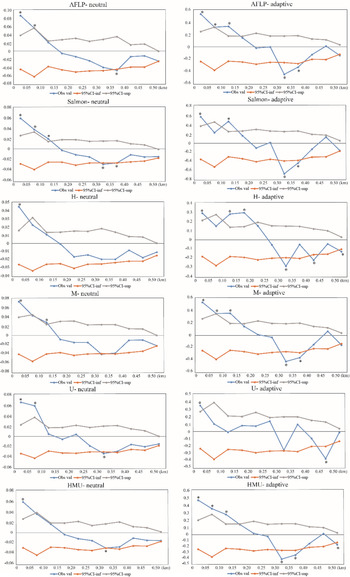
At the fine scale, the spatial structure was examined in 50-m intervals (Figure 8). For the genetic matrix, a significant positive autocorrelation was found in the first three distance classes (0 to 50 m, 50 to 100 m, and 100 to 150 m; P < 0.05). For the Salmon matrix, a similar spatial structure was detected. Using the U and HMU matrices, significant positive autocorrelation was found in the first two distance classes (0 to 50 m and 50 to 100 m; P < 0.05). For the M matrix, significant positive autocorrelation was detected in the first and third distance classes (0 to 50 m and 100 to 150 m; P < 0.05). And for the H matrix, the spatial structure was observed only in the first distance class (0 to 50 m, P < 0.05).
Fine-scale spatial structure at 10 distance classes based on six matrices. An asterisk (*) indicates significance level (P < 0.05).

Identification of Candidate Selective Loci and Local Adaptive Response to Novel Environment
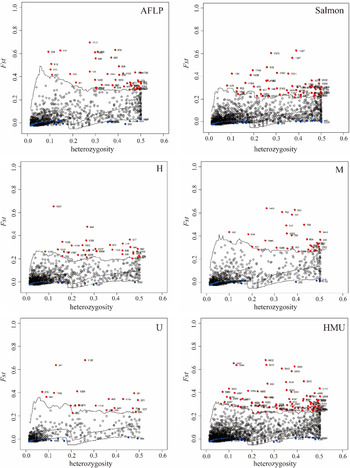
We detected adaptive loci and epiloci. Using Dfdist, 47 and 151 loci were identified with positive and negative selection in the genetic matrix, respectively. By contrast, 61 and 118 loci were detected under positive and negative selection for the Salmon matrix, 34 and 63 for the H matrix, 32 and 100 for the M matrix, 21 and 37 for the U matrix, and 93 and 226 for the HMU matrix, respectively (Figure 9).
Outliers were identified by Dfdist analysis. The red dots indicate positively selective loci.

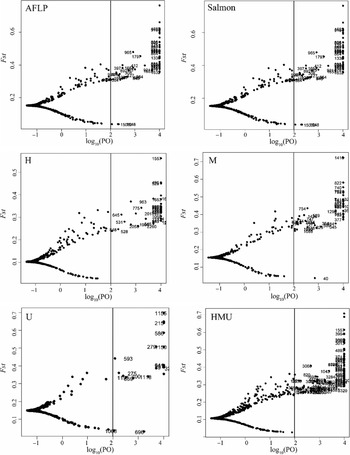
Using Bayescan, 66 and 1 loci were found to be under positive and negative selection in the genetic matrix, respectively. Comparatively, the corresponding loci were 87 and 1 for the Salmon matrix, 38 and 1 for the H matrix, 48 and 1 for the M matrix, 20 and 1 for the U matrix, and 124 and 1 for the HMU matrix, respectively (Figure 10). To ensure accuracy, only those loci that had been simultaneously identified by both Dfdist and Bayescan were finally considered as being under selection. As a result, we found 39 candidate selective loci in the genetic matrix, 56 for the Salmon matrix, 22 for the H matrix, 27 for the M matrix,15 for the U matrix, and 81 for the HMU matrix, respectively.
Candidate positively selective loci were detected by Bayescan analysis. Decisive selected loci were determined according to ln (PO) ≥ 2.

We used Samβada software to detect locus–environmental variable associations. It identified 182, 122, 13, 136, 37, and 199 candidate loci for the genetic, Salmon, H, M, U, and HMU matrices, respectively. The majority of these candidate loci were associated with multiple environmental variables. The majority of these candidate loci were further subjected to univariate linear regression model analysis. Only loci with R2 ≥ 0.5 were considered as adaptive (Figure 11), which was 11, 4, 2, 11, 1, and 17 for the genetic, Salmon, H, M, U, and HMU matrices, respectively. Among them, five loci were simultaneously detected in three matrices, and four were detected in four matrices. In total, for the six matrices, 21 adaptive loci were detected that were positively correlated with such environmental factors as soil Mn, Zn, Ni, P, and S; latitude; mean diurnal range; temperature seasonality; temperature annual range; precipitation of driest month; precipitation of driest quarter; and precipitation of coldest quarter. Of note, there were more adaptive epiloci (20) than adaptive loci (11) related to environmental factors. Moreover, LD was found in the adaptive (epi)loci (Figure 12). Our results underscore the relative importance of methylation-based epigenetic variation in the adaptive response to environmental conditions (Herrera and Bazaga Reference Herrera and Bazaga2010). Also of note, no adaptive (epi)loci were found to be solely linked to temperature, but some were simultaneously associated with both temperature and precipitation. Similar results have been obtained in other plants like black spruce [Picea mariana (Mill.) Britton, Sterns & Poggenb.] (Prunier et al. Reference Prunier, Gerardi, Laroche, Beaulieu and Bousquet2012) and European larch (Larix decidua Mill.) (Mosca et al. Reference Mosca, Eckert, Pierro, Rocchini, Porta, Belletti and Neale2012). These findings suggest that the interaction between temperature and precipitation might be more important than their separate action in causing differentiation at the adaptive (epi)loci. It has been shown that transcriptional networks responsive to dehydration and cold stresses are interconnected in Arabidopsis (Yamaguchi-Shinozaki and Shinozaki Reference Yamaguchi-Shinozaki and Shinozaki2006).
Correlation was investigated between adaptive loci and environmental factors. The correlation range was from −1 to 1. Positive and negative values indicated that loci were positively and negatively correlated with the environmental factors, respectively. The greater the absolute value, the stronger the correlation, and vice versa.

A linkage disequilibrium (LD) test was conducted among adaptive loci. Areas above and below the diagonal indicate the R2 and P-value, respectively.

Mikania micrantha was predicted to expand northward in the future (Figure 13), which is in line with previous suggestion by Hu et al. (Reference Hu, Li and Wei2014). Environmental factors, including minimum temperature of coldest month, mean temperature of coldest quarter, mean temperature of driest quarter, temperature annual range, annual precipitation, and precipitation of warmest quarter, made the greatest contribution during the expansion (Figure 14). Of them, minimum temperature of the coldest month and mean temperature of the coldest quarter were the decisive factors (contribution rate of 62.3%). More importantly, the optimum growth conditions were revealed as follows (Figure 15): minimum temperature of coldest month, 10 to 24 C; mean temperature of coldest quarter, 14 to 27 C; mean temperature of driest quarter, 16 to 23 C; temperature annual range, 8 to 20 C; annual precipitation, 1,800 to 4,900 mm; and precipitation of warmest quarter, 800 to 3,100 mm.
Current (A) and potential future distribution (B) of Mikania micrantha predicted based on Maxent.

Response curves of Mikania micrantha to environmental gradients. The edges of the red and blue curves represent the average response and the standard deviation range, respectively.

Evaluation of climate variable contribution using the jackknife test. Blue bars represent contribution of each variable; green bars, without variable; red bar, with all variables.

Soil factors have strong effects on the invasion of M. micrantha (Chen et al. Reference Chen, Su, Liao and Peng2018). Here, five soil factors (Mn, Zn, Ni, P, and S) were found to be positively related to adaptive (epi)loci. Our results not only highlight the specific selective soil components but also the candidate loci involved in the response to edaphic selection for M. micrantha.
Our findings are not unexpected considering the important functions of Mn, Zn, Ni, P, and S. Mn plays a crucial role in many redox reactions as a cofactor for enzymes (Doncheva et al. Reference Doncheva, Georgieva, Vassileva, Stoyanova, Popov and Ignatov2005). Mn deficiency may cause oxidative damage (Shenker et al. Reference Shenker, Plessner and Tel-Or2004), while excess Mn imposes toxic effects by interfering with a plant’s use of other mineral elements (Arya and Roy Reference Arya and Roy2011; Doncheva et al. Reference Doncheva, Georgieva, Vassileva, Stoyanova, Popov and Ignatov2005). Zn fulfills functions in auxin synthesis, signal transduction, transcriptional regulation, the defense against reactive oxygen species, and as component of zinc finger protein and enzymes (Bharti et al. Reference Bharti, Pandey, Shankhdhar, Srivastava and Shankhdhar2013; Cakmak Reference Cakmak2000; Cherif et al. Reference Cherif, Mediouni, Ammar and Jemal2011; Epple et al. Reference Epple, Mack, Morris and Dangl2003; Riechmann et al. Reference Riechmann, Heard, Martin, Reuber, Jiang, Keddie, Adam, Pineda, Ratcliffe, Samaha, Creelman, Pilgrim, Broun, Zhang and Ghandehari2000). Zn concentration influences germination, branch growth, and light system II (Bonnet et al. Reference Bonnet, Camares and Veisseire2000). P is a major element in soil organic matter (Herrera-Estrella and López-Arredondo Reference Herrera-Estrella and López-Arredondo2016). It participates in many metabolic processes and plays an important role in stress resistance to hostile environments. P excess will affect the absorbance of Fe, Mn, and Zn (Huang Reference Huang2004). Ni is an important micronutrient for plant growth and metabolism (Lin and Gao Reference Lin and Gao2005). Ni2+ generally leads to phytotoxicity in soils (Mishra and Kar1974; Sheoran et al. Reference Sheoran, Singal and Singh1990). Ni may reduce the photosynthetic rate and the activities of key enzymes of the photosynthetic carbon reduction cycle (Sheoran et al. Reference Sheoran, Singal and Singh1990). S represents an essential nonmetallic element for plants (Piotrowska-Dlugosz et al. Reference Piotrowska-Dlugosz, Siwik-Ziomek, Dlugosz and Gozdowski2017). Soil S excess and deficiency have serious effects on plant growth (Behera et al. Reference Behera, Shukla, Prakash, Tripathi, Kumar and Trivedi2020). Of note, S enables increased Ni2+ uptake (Hashem et al. Reference Hashem, Abbas, El-Hamed, Salem, El-Hosseiny, Abdel-Salam, Saleem, Zhou and Hu2020). This offers a clue for understanding the preference of M. micrantha for heavy metal–contaminated soils (Ho et al. Reference Ho, Patrick, Stephen, Chi, Kwai, Ka, Kin and Wai2019; Leung et al. Reference Leung, Yue, Sze, Au, Cheung, Chan, Yung and Li2019). This study also provided evidence that selective pressures resulting from soil factors were important in structuring the M. micrantha populations (Nosil et al. Reference Nosil, Egan and Funk2007).
Comparison of Neutral and Adaptive (Epi)Loci Data Sets
Our results showed that adaptive (epi)loci exhibited higher (epi)genetic diversity and differentiation than neutral (epi)loci. Importantly, epigenetic diversity was higher than genetic diversity (Table 8). Compared with neutral loci, adaptive loci data set yielded significantly higher F st values (Table 9). For neutral (epi)loci, the F st value based on the genetic matrix was greater than values based on the epigenetic matrices (Table 9); while the correlation between genetic and geographic distance was weaker than those between epigenetic and geographic distance (Table 10).
Genetic and epigenetic diversity of neutral and adaptive loci.a

a N, number of samples; N a, number of different alleles; N e, number of effective alleles = 1/(p 2 + q 2); I, Shannon’s diversity index = −1*[p*Ln(p) + q*Ln(q)]; %P, percentage of polymorphic loci; He, expected heterozygosity = 2*p*q; UHe, unbiased expected heterozygosity = [2N/(2N − 1)]*H e; DG, Dongguan; HK, Hong Kong; MA, Macao; NLD, Nei Lingding Island; SZ, Shenzhen; ZH, Zhuhai.
Analysis of molecular variance (AMOVA) based on neutral and adaptive loci.

Mantel test based on neutral and adaptive locus matrices.

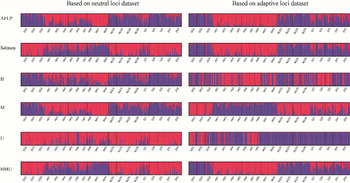
By controlling genetic distance, an isolation by geographic distance pattern still can be detected based on the Salmon matrix. After removing adaptive (epi)loci, the Hong Kong and Macao populations were more clearly clustered together based on the genetic and epigenetic matrices (Figure 16), indicating the roles of adaptive (epi)loci in M. micrantha invasion. The fine-scale spatial (epi)genetic structure was examined based on neutral and adaptive loci, respectively (Figure 17).
Structure results of neutral or adaptive loci based on the six matrices. See Table 1 for population codes.

Fine-scale spatial structure of neutral and adaptive loci based on the six matrices. An asterisk (*) indicates significance level (P < 0.05).

In conclusion, effects of environmental factors on population epigenetic differentiation of M. micrantha were first revealed by using MSAP to correlate epigenetic loci and climate/soil data. We found 20 candidate adaptive epiloci correlated with climate (precipitation and temperature) and/or soil variables (Mn, Zn, Ni, P, and S). Minimum temperature of the coldest month and mean temperature of the coldest quarter were identified as decisive factors for M. micrantha distribution. Climate is presumed to play a relatively more important role than soil in shaping the adaptive (epi)genetic differentiation. Under ongoing global warming, populations of M. micrantha are predicted to expand northward. Compared with genetic diversity, their epigenetic diversity was higher. Population-level (epi)genetic variation showed the pattern of isolation by distance and spatial structure at a small scale. Moreover, leaf shape variation was found to be related to population methylation percentage and epigenetic diversity. These results may be helpful for formulating a control strategy for M. micrantha.
Supplementary material
To view supplementary material for this article, please visit https://doi.org/10.1017/wsc.2021.13
Acknowledgments
This work was supported by the National Natural Science Foundation of China (31670200, 31770587, 31872670, and 32071781), the Natural Science Foundation of Guangdong Province, China (2016A030313320 and 2017A030313122), the Science and Technology Planning Project of Guangdong Province, China (2017A030303007), the Project of the Department of Science and Technology of Shenzhen City, Guangdong, China (JCYJ20160425165447211, JCYJ20170413155402977, JCYJ20170818155249053, and JCYJ20190813172001780), and the Science and Technology Planning Project of Guangzhou City, China (201804010389). The authors declare that they have no conflict of interest.