Introduction
Polygonum cuspidatum Sieb. et Zucc. is also called Japanese knotweed; it belongs to the Polygonaceae family and is a perennial herb widely distributed in China, Japan, Korea, and America. In ancient China, the root of Polygonum cuspidatum Sieb. et Zucc. was always used in the treatment of arthralgia, chronic bronchitis, jaundice, hypertension, and hypercholesterolemia [Reference Bralley, Greenspan, Hargrove, Wicker and Hartle1]. According to the results of modern pharmacological studies, most of the above uses of Polygonum cuspidatum Sieb. et Zucc. were due to the presence of flavonoids in it [Reference Huang, Gao, Wu, Yang, Huang, Chen and Sun2]. Moreover, flavonoids in Polygonum cuspidatum Sieb. et Zucc. had been identified to have several important biological properties, such as antioxidants [Reference Tadhani, Patel and Subhash3], anticarcinogenic [Reference Muanda, Soulimani, Diop and Dicko4], anti-inflammatory, antihypertensive [Reference Yadav and Guleria5], and as antihyperglycemic [Reference Wölwer-Rieck6]. Although some researchers had prepared flavonoids by organic synthesis methods [Reference Wang, Li and Zhao7], such as Algar–Flynn–Oyamada (AFO) method [Reference Iinuma, Tanaka, Ito and Mizuno8], Baker–Venkataraman method [Reference Barros and Silva9], and Allan–Robinson method [Reference Dreyer, Tabata and Horowitz10], the disadvantages, such as high operation requirements and serious environmental pollution, are always a challenge needs to be faced, so flavonoids extraction from Polygonum cuspidatum Sieb. et Zucc. showed an exciting prospect for the industrialized development.
In conventional extraction techniques, flavonoids were extracted from Polygonum cuspidatum Sieb. et Zucc. by hot water extraction [Reference Caunii, Pribac, Grozea, Gaitin and Samfira11], alkaline extraction [Reference Gao, Huang, Yang and Xu12], supercritical fluid extraction, accelerated solvent extraction [Reference Wang, Yang, Du and Yi13], and ultrasound-assisted extraction [Reference Huang, Xue, Niu, Jia and Wang14, Reference Novak, Janeiro, Seruga and Oliveira-Brett15, Reference Chen, Yang, Mou and Kong16]. The hot water extraction [Reference Hartonen, Parshintsev, Sandberg, Bergelin, Nisula and Riekkola17, Reference Vrchotová and Šerá18] had some advantages of low production cost and no environmental pollution, but the extracted product might contain more impurities, such as starch and polysaccharide compounds, resulting in complicated posttreatment, high energy consumption, and low extraction efficiency. The structure of flavonoids was easily destroyed by the alkaline extraction [Reference Zhao, Yang and Li19], resulting in a decrease in extraction ratio. The entrainers would be present in the product extracted by supercritical fluid extraction and accelerated solvent extraction, which could reduce the extraction ratio and purity of the product. Compared with the methods listed above, ultrasonic-assisted extraction had become the most successful and widely used technology owing to its advantages of high efficiency, time-saving, simplified manipulation, and environmental-friendly [Reference Wang, Li, Bao, You, Wang, Shi and Zhang20, Reference Wang and Weller21, Reference Zheng, Wen, Yuan and Gou22]. The cytoderm of Polygonum cuspidatum Sieb. et Zucc. would be destroyed by ultrasonic cavitation, heat and mechanical action, and flavonoids could be quickly dissolved into solvent [Reference Garcia-Castello, Rodriguez-Lopez, Mayor, Ballesteros, Conidi and Cassano23, Reference Wang, Qu, Luo, Feng, Li, Yuan, Huang, Liao, Yang and Ding24, Reference Krishnan and Rajan25]. The selection of solvent for above methods is very important for effective flavonoid extraction. The extraction ratio and purity of flavonoids were low when water was used as solvent [Reference Zhang, Hu, Yue, Lu and Lu26]. Some researchers chose alkaline solvent and organic solvents, such as sodium hydroxide aqueous solution, methanol, and acetone [Reference Huang, Xue, Niu, Jia and Wang14, Reference Zhu27, Reference Tian and Li28, Reference Chen, Huang, Li and Chong29], to extract flavonoids. Although the extraction ratio improved, above solvents would cause some environmental pollution and increase the cost of production. In contrast, ethanol, which was always considered as a green solvent, not only improved the extraction ratio but also avoided environmental pollution.
Response surface methodology (RSM) was a collection of sophisticated statistical and mathematical techniques for process optimization and modeling that established empirical models. RSM was applied to optimize response variables, which were affected by several independent variables in carefully designed experiments [Reference Rodríguez-Pérez, Gilbert-López, Mendiola, Quirantes-Piné, Segura-Carretero and Ibáñez30, Reference Yang, Cao, Jiang, Lin, Chen and Zhu31, Reference Ho, Tran, Dinh and An32]. RSM application to process optimization presented several benefits, i.e., it could decrease operating costs and the associated numerical noise and select responses that need to be optimized [Reference Bai, Yue, Yuan and Zhang33, Reference Pilkington, Preston and Gomes34]. In addition, RSM could simplify complex unknown function relationships into one or two polynomial models and continuously analyzed the various levels of the test, which could effectively solve practical problems in the production process and improve product quality [Reference Belwal, Dhyani, Bhatt, Belwal, Dhyani, Bhatt, Rawal and Pande35, Reference Maran, Manikandan, Nivetha and Dinesh36, Reference Ilaiyaraja, Likhith, Babu and Khanum37]. The aim of the present research was to develop an ultrasound-assisted extraction approach for a highly efficient extraction of flavonoids from Polygonum cuspidatum Sieb. et Zucc. The process of extraction was modeled and optimized by RSM models.
Results and discussion
Single-factor experiments
Single-factor experiments were adopted to determine whether the ethanol content, ratio of liquid to solid, extraction temperature, extraction time, and ultrasonic power could be optimized for total flavonoids yield. Then, the appropriate ranges of extraction variables were determined.
Effects of ethanol content on E r of flavonoids
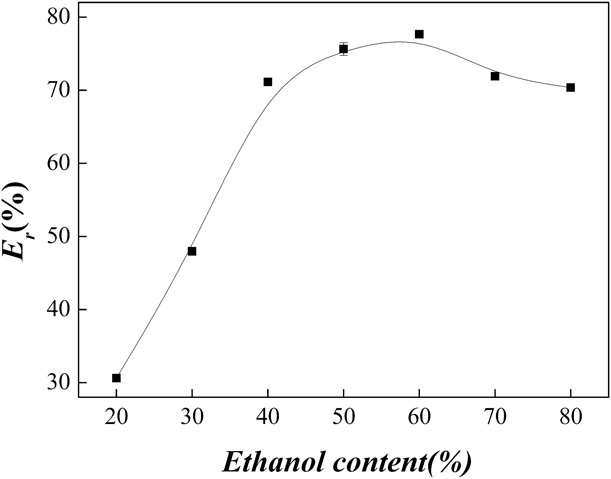
Figure 1 documented that extraction ratio (E r) increased with the augment of ethanol content till the ethanol content arrived at 60% and then it decreased. Flavonoids in Polygonum cuspidatum Sieb. et Zucc. are of two types: flavonoid glycosides and free flavonoids; majority of the free flavonoids could not dissolve in water. On the other hand, both of types of flavonoids could dissolve in ethanol [Reference Li and Sun38]. Just for this reason, a mixed solvent of ethanol and water was used in extraction to reach the aim of the increasing extraction ratio and cut the cost simultaneously. However, a maximum E r was observed in this work, which could not be understood when only considering the solubility of flavonoids. After a comprehensive analysis, we thought the reason might be ascribed to the change in the polarity match degree between the solvent and the Polygonum cuspidatum Sieb. et Zucc. powder. With the variation of ethanol content, the polarity of the solvent changed gradually, and the vapor pressure, viscosity, and surface tension of the extraction solvent would change correspondingly, which demonstrated very important physical characteristics of the solvent that influenced the efficiency of sonication [Reference Mason, Paniwnyk and Lorimer39]. With the variation of the above parameters, the interaction among the Polygonum cuspidatum Sieb. et Zucc. powder, the extraction solvent, and the sonication would vary accordingly and the efficiency would change naturally. Thus, a suitable content of ethanol appeared at 60%, which could be understood as 60% ethanol, could offer the suitable polarity match degree between the solvent and the Polygonum cuspidatum Sieb. et Zucc. powder, which would provide a well vapor pressure, viscosity, and surface tension of extraction solvent. Besides, the suitable content of ethanol could also be partially attributed to the enhanced swelling degree of water to plant matrix, because water was favorable to increase the contact surface area between the plant matrix and the solvent, which would also result in an increase in the extraction ratio [Reference Wang, Sun, Cao, Tian and Li40].
The influence of ethanol content on E r of flavonoids.

Effects of different ratio of solid to liquid on E r of flavonoids
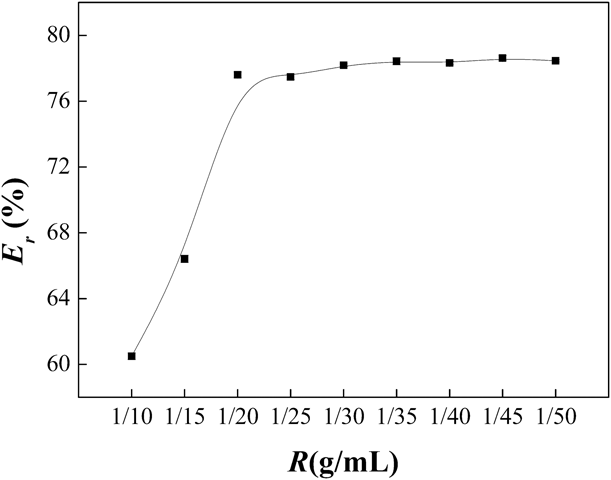
The ratio of solid to liquid was an important parameter that could influence the extraction efficiency [Reference Wang, Sun, Cao, Tian and Li40, Reference Jing, Dong and Tong41]. Numerous studies have demonstrated that a suitable ratio of solid to liquid could contribute to the extraction of flavonoids [Reference Huang, Xue, Niu, Jia and Wang14, Reference Zhang, He and Hu42]. Flavonoids in Polygonum cuspidatum Sieb. et Zucc. could be completely extracted when the ratio of solvent to material was at an appropriate extent. As shown in Fig. 2, the yield of flavonoids increased greatly when the ratio increased from 1/10 to 1/20 (g/mL) and then increased slightly when the ratio of solid to liquid increased beyond 1/20 (g/mL). When the proportion of solvent was smaller, the concentration difference between two phases was smaller, and the mass transfer driving force would improve with the increase in the ratio of solid to liquid, but the production cost and the subsequent processing will be difficult; thus, the proportion of solvent should not be too high. So the best solid-to-liquid ratio was chosen as 1/20.
The influence of solid–liquid ratio (R) on E r of flavonoids.

Effects of different extraction temperatures on E r of flavonoids
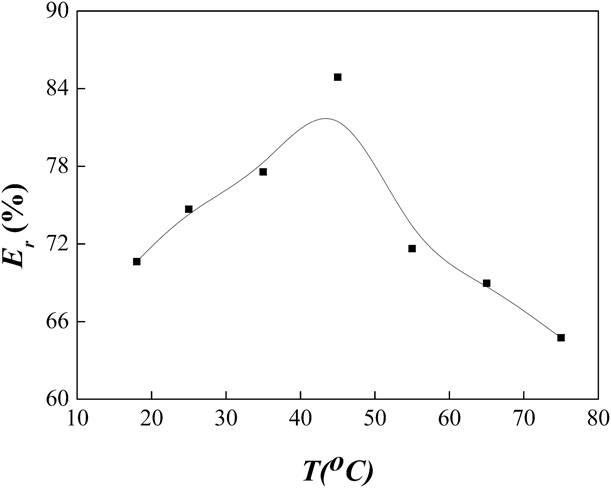
The influence of temperature on E r is displayed in Fig. 3. It shows that the extraction ratio of flavonoids increased and then decreased, and a maximum extraction ratio was obtained at 45 °C. It was well known that the solubility of flavonoids increased with the increase in temperature [Reference Jing, Dong and Tong41], which meant that at low temperatures, even though flavonoids could move freely, they could not be extracted effectively because of low solubility, which would result in a lower content of flavonoids in the extraction naturally. With the increase in temperature, both the solubility and diffusion would increase and E r increased accordingly. Besides, higher temperature would be beneficial to the swelling of the Polygonum cuspidatum Sieb. et Zucc. powder, and the effect of ultrasonic damage to the cytoderm would be strengthened accordingly because of the increased denudation of ultrasonic wave to the plants matrix and cytoderm, which would also enhance the extraction ratio [Reference Hemwimol, Pavasant and Shotipruk43]. However, with the further increase in extraction temperature, the chemical decomposition of the flavonoids would occur [Reference Wang, Sun, Cao, Tian and Li40], which would decrease the quantities of flavonoids and finally result in a decrease in appearance extraction ratio. So the best extraction temperature was chosen as 45 °C.
The influence of extraction temperature (T) on E r of flavonoids.

Effects of different extraction times on E r of flavonoids
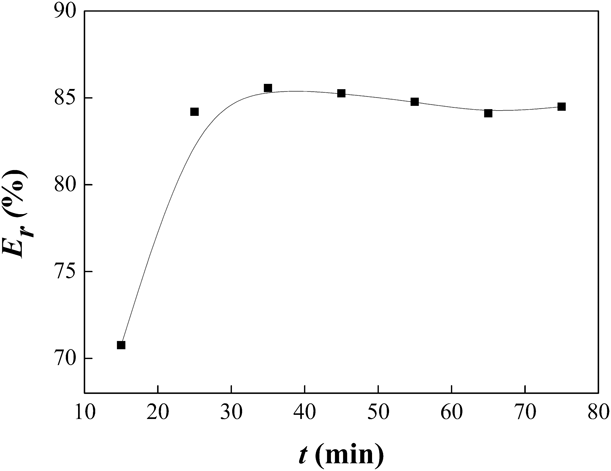
The influence of extraction time on the extraction ratio of flavonoids is shown in Fig. 4. With the increase in extraction time, the extraction ratio increased quickly till it was extended to 35 min. When the ultrasonic extraction time was too short, it would lead to the low degree of plant cytoderm breaking, and the large steric hindrance would hold back flavonoids leached from Polygonum cuspidatum Sieb. et Zucc. correspondingly. With the increase in extraction time, the contact area between the sample and solvent would increase and improve the mass transfer rate of effective ingredients from a solid phase to a liquid one by the cavitation function of the ultrasonic power and the extraction ratio increased lucratively. When the cytoderm of the plant was destroyed completely, the flavonoids would be released freely. At this condition, the equilibrium distribution would become the major influence factor of the extraction ratio, and the increased degree of extraction ratio decreased as a constant, correspondingly. So the best extraction time was chosen as 35 min.
The influence of extraction time (t) on E r of flavonoids.

Effects of different ultrasonic power on E r of flavonoids
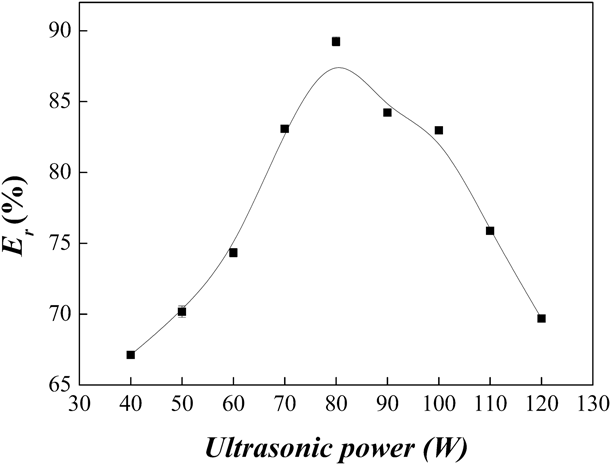
The influence of ultrasonic power (P c) on extraction ratio is shown in Fig. 5. The E r increased rapidly with the increase in P c and reached the maximum as P c arrived at 80 W, then it reduced rapidly with the further increase in P c. At the low levels of P c, the cavitation intensity was too small to break cytoderm, and many cytoderm would not be broken or were broken incompletely; thus, the diffusion of flavonoids from Polygonum cuspidatum Sieb. et Zucc. to extract solution would be at a low level because of a high steric hindrance. With the increase in P c, the cavitation intensity increased accordingly, which would lead to a majority of cytoderm broken naturally, and as a result, numerous flavonoids would release into the extraction solution because of the decreased steric hindrance. However, as the increase in P c exceeded a certain value, cavitation would tend to saturate, and at this condition, a large number of produced bubbles would hinder the ultrasonic propagation in the liquid and reduce the intensity of cavitation, which resulted in the cytoderm broken trend decreased [Reference Hu, Li, Zheng, Lu, Meng, Liu and Rehman44] and E r decreased again because of a high diffusion resistance. Besides, the dissociation of flavonoids sourced from high P c was another reason [Reference Hu, Li, Zheng, Lu, Meng, Liu and Rehman44]. So the best ultrasonic power was chosen as 80 W.
The influence of ultrasonic power on E r of flavonoids.

Effects of different extraction times on E r of flavonoids
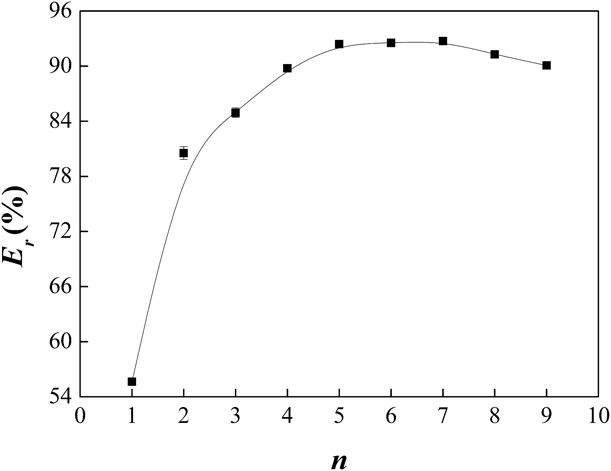
The effects of a number of replications on the extraction ratio are shown in Fig. 6; it indicated that the highest extraction ratio could be achieved when the number of replications arrived at 5 and then it decreased. The increase in E r could be understood easily that more and more flavonoids would be extracted with the increase in replication according to the distribution principle, but the decrease in E r could not be understood conveniently. After analysis in detail, we ascribed to the decrease in appearance E r to the decomposition of some very bioactive flavonoids and the interference of some of the existed impurities to absorbency [Reference Wang, Sun, Cao, Tian and Li40].
The influence of extraction times (n) on E r of flavonoids.

Optimization by RSM
In the present study, the central composite design (CCD) was used to optimize the extraction parameters. All the response values obtained from the 30-run-experiment and the predicted data are shown in Table SI. The similarity between the experimental and predicted values shows the accuracy of the model. Maximum yield of flavonoids was recorded during Run No. 3 at 94.49%.
The ANOVA (analysis of variance) results are shown in Table SII. For any terms in the model, a large regression coefficient (R 2 = 0.9513) and a small P-value indicate a more significant effect of that term on the respective response variable [Reference Yuan, Huang, Wu, Tong, Xie, Duan and Qin45]. A second-order polynomial regression model was used to express the extraction ratio of total flavonoids as a function of the independent variables:
 $${E_{\rm{r}}} = 93.48 - 0.37A - 0.73B - 0.78C - 0.87D - 1.80AB + 1.423\left( {E - 0.03AC} \right) - 0.39AD - 1.49BC - 1.09BD + 0.87CD - 2.09{A^2} - 1.59{B^2} - 2.12{C^2} - 1.83{D^2}\quad .$$
ANOVA for the quadratic regression models indicated that the models were very significant (P < 0.0001). The quality of fit of the model was usually evaluated by the determination coefficient (R 2), predicted determination coefficient (R 2pred), and adjusted determination coefficient (R 2adj). The values of the determination coefficient (R 2 = 0.9513) of the quadratic regression model indicated that only 4.87% of the total variations could not be explained by the model. The adjusted determination coefficient (R 2adj = 0.9058) showed the high degree of correlation between the experimental and predicted values. The models also showed a statistically insignificant lack of fit (P = 0.2195). Based on the factors above, it was deduced that the model was appropriate to predict the responses. The influence order of each factor was ultrasonic power > extraction time > extraction temperature > ethanol concentration.
Analysis of response surfaces
Three-dimensional response surface plots drawn by Design Expert Software of Version 8.0.5 were constructed to investigate the main and the interactive effects on the extraction ratio of flavonoids [Reference Yuan, Huang, Wu, Tong, Xie, Duan and Qin45].
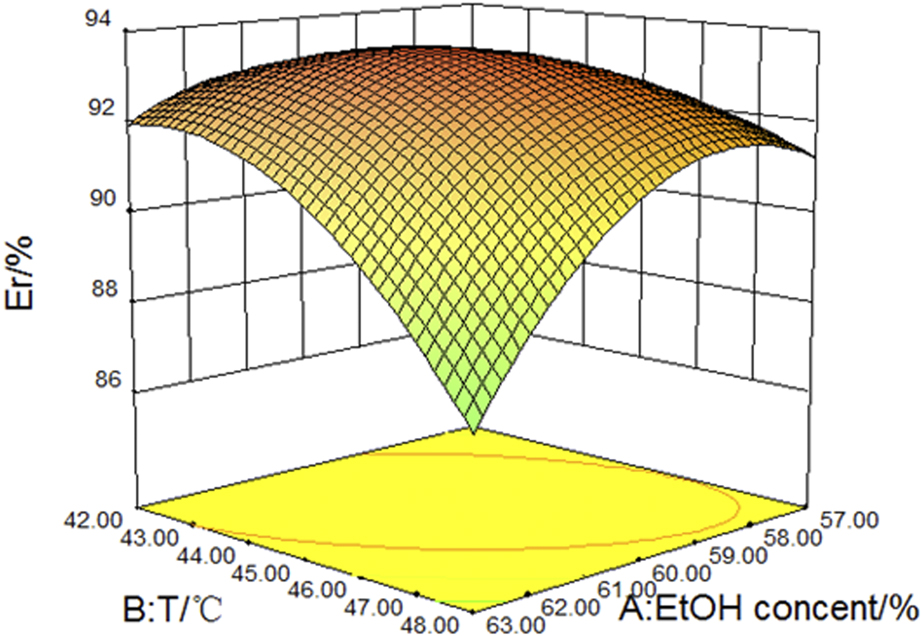
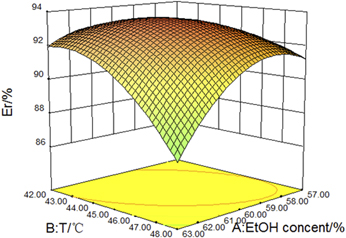
The effects of the ethanol content interaction with the factors of extraction temperature, extraction time, and ultrasonic power on the extraction ratio of flavonoids are shown in Figs. 7(a), 9(b), and 9(c). Ethanol content exerted a quadratic effect on the extraction ratio of the flavonoids. The yield of flavonoids increased to the highest value with an ethanol content from 58% to 61%, extraction temperature in the range of 43–47 °C, ultrasonic power from 75 to 85 W, and extraction time of 30–40 min. The extraction ratio of flavonoids would decrease when the ethanol content was over 60%, and this phenomenon could be ascribed to the similar polarity between flavonoids molecules and a 60% ethanol solution with compounds [Reference Jing, Dong and Tong41].
Response surface plots (3D) showing the effects of variables on flavonoids extraction (T: temperature, t: extraction time, Power: ultrasonic power).

For the extraction temperature, as can be seen from Figs. 7(a), 9(d), and 9(e), a quadratic effect was detected for all response variables, and the extraction ratio of flavonoids increased from 42 to 45 °C. The yield of flavonoids increased to the highest value with extraction temperature in the range of 43–47 °C, ethanol content from 58 to 61%, ultrasonic power from 75 to 85 W, and extraction time of 30–40 min. This might be due to the increase in temperature accelerating the mass transfer [Reference Shin, Liu, Nock, Holliday and Watkins46, Reference Ebrahimzadeh, Pourmorad and Bekhradnia47]. However, an immoderate increase in temperature would be a disadvantage to extraction; flavonoids could be damaged and decomposed at high temperatures [Reference Jing, Dong and Tong41], which would also decrease the extraction ratio, eventually.
In Figs. 7(b), 9(d), and 9(f), when the response surface plots were developed for the extraction time interaction with the other three factors, ethanol content, extraction temperature, and ultrasonic power, it can be seen that the maximum extraction ratio could be achieved with the extraction time ranging from 30 to 40 min, the ethanol content from 58% to 61%, the extraction temperature in the range of 43–47 °C, and ultrasonic power from 75 to 85 W.
Verification of predictive model
The optimum ultrasound-assisted extraction conditions for the flavonoids were obtained by the model: The ratio of solid to liquid was 1/20, the number of replications for higher extraction ratio was 5, ethanol concentration was 59.77%, extraction temperature was 45.13 °C, extraction time was 33.69 min, and ultrasonic power was 76.94 W. Three experiments were operated under the optimum ultrasound-assisted extraction conditions, and the results were 94.68%, 94.11%, 94.72%, respectively. The predicted results (94.49%) matched well with the average experimental values (94.50%) obtained using optimum extraction conditions.
The extraction thermodynamic investigation
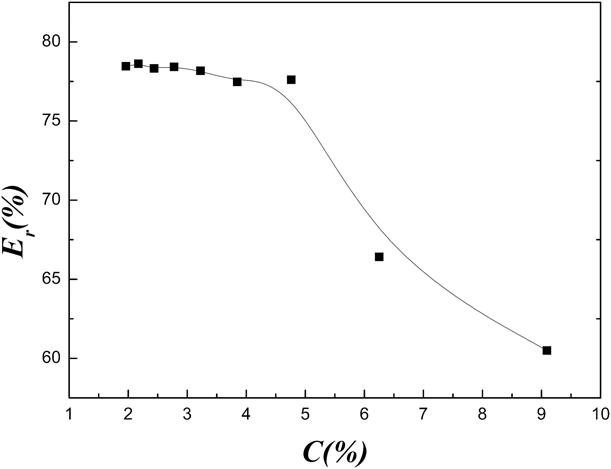
The relationship of concentration of Polygonum cuspidatum Sieb. et Zucc. and E r is shown in Fig. 8. The thermodynamic data of the extraction process could be calculated by the following equation:
 $${K^0} = {{{m_1}} \over {m - {m_1}}}\quad ,$$
 $$Ln{K^0} = {{\Delta {S^0}} \over R} - {{\Delta {H^0}} \over {RT}}\quad ,$$
 $$\Delta {G^0} = - RTLn{K^0}\quad ,$$
where m and m 1 (g) are the quality of total flavonoids in Polygonum cuspidatum Sieb. et Zucc. and extraction solution, respectively; ΔH 0 (kJ/mol) is enthalpy change; ΔS 0 [J/(mol K)] is entropy change; ΔG 0 [kJ/(mol K)] is Gibbs free energy change; R [8.314 J/(mol K)] is the ideal gas constant; T (K) is the temperature; and K 0 is the equilibrium distribution coefficient.
The relationship of concentration of Polygonum cuspidatum Sieb. et Zucc. and E r.

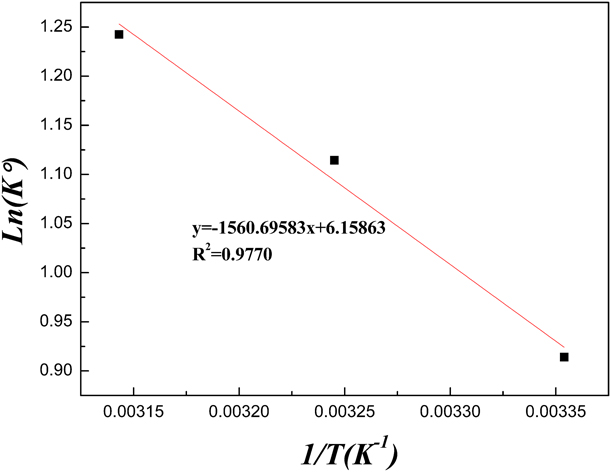
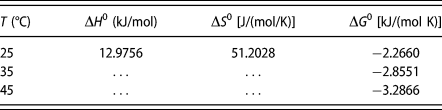
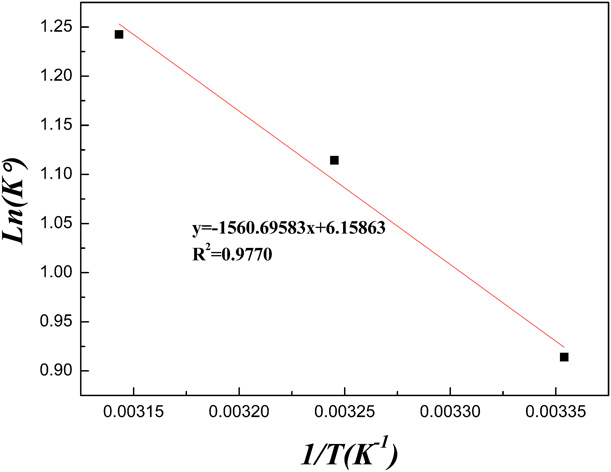
The K 0 at different temperatures could be calculated according to Eq. (2), and ΔG 0 of the extraction process was obtained according to Eq. (4). The ΔH 0 and ΔS 0 of the extraction process could be calculated by LnK 0 and 1/T from Fig. 9. The thermodynamic results are shown in Table I. It could be seen from Table I that the extraction process could proceed spontaneously and was endothermic.
The thermodynamic simulation results of the extraction process.
The thermodynamic parameters of extraction process.

Conclusion
Based on the single-factor experiment, RSM was used to optimize the extraction variables. The second-order model developed for the yield of flavonoids from Polygonum cuspidatum Sieb. et Zucc. was extremely significant. The optimum extraction parameters were 60% ethanol aqueous solution as solvent with 1/20 solid to liquid ratio and under ultrasonic power of 80 W for 34 min at 45 °C for 5 times the extraction. Finally, the extraction results indicated that the highest extraction ratio of flavonoids by the ultrasound-assisted extraction could arrive at 94.50%. The results obtained from the study provided that the ultrasound-assisted technique could be used as an effective method to extract flavonoids from Polygonum cuspidatum Sieb. et Zucc. This study provides that the influence of the factors on the extraction of flavonoids was ultrasonic power > extraction time > extraction temperature > ethanol concentration. Besides, the extraction thermodynamic investigation showed that the extraction process was endothermic and could proceed spontaneously.
Materials and methods
Materials
Polygonum cuspidatum Sieb. et Zucc. was obtained from Anhui Bozhou herbs wholesale market (Anhui, China). NaNO2, NaOH, and Al(NO3)3 were all of analytical grade (AR) and were purchased from Tianjin Chemical Reagent Co., Ltd. (Tianjin, China). CH3CH2OH is an industrial pure reagent and provided by Lanzhou LS Group Co., Ltd. All reagents were used as received. Rutin (Ru, purity ≥99%) was purchased from Shaanxi Sciphar Natural Products Co., Ltd. (Xi'an, China). Distilled water was laboratory self-restraint.
Preparation of standard solution
10.0 mg of rutin was weighed and dissolved in 70% ethanol aqueous solution and transferred into a 100 mL volumetric flask and then brought to volume by 70% ethanol aqueous solution. The standard solution with a concentration of 0.10 mg/mL was obtained.
Characterization of the maximum absorption wavelength
One milliliter the above prepared standard solution was transferred to a 25 mL volumetric flask and diluted to 4 mL with 70% ethanol aqueous solution and then 1 mL of 5% NaNO2 aqueous solution and 1 mL of 10% Al(NO3)3 aqueous solution were added into the volumetric flask. The flask was shaken at 30 °C for 5 min in a constant temperature vibrator and stood for another 6 min thereafter and then 10 mL of 4% NaOH aqueous solution was added. After that, the volumetric flask was brought to volume with 70% ethanol aqueous solution. Keeping the chromogenic reaction at 30 °C for 15 min in the constant temperature vibrator again, the maximum adsorption wavelength was characterized by an ultraviolet (UV) spectroscopy by full wavelength scanning method and found that the maximum absorption wavelength was 505 nm. The relationship between absorbency and wavelength of rutin solution is shown in Fig. S1.
Preparation of the standard curve of flavonoids
0.00, 0.10, 0.25, 0.50, 1.00, 1.50, 2.00, 2.50, 3.00, and 3.50 mL of the above prepared standard solution were put into a series of 10 mL volumetric flasks, respectively, and the same operation as was illustrated in “Characterization of the maximum absorption wavelength” section was carried out, except the absorbance was determined at 505 nm. Fitting the relationship between concentration and the relative absorbance with the linear model, a linear relationship standard curve of A = 8.6509C + 0.0006 [R 2 = 0.9992; A is the absorbance and C denotes concentration (mg/mL)] was obtained. The relationship between absorbency and concentration is shown in Fig. S2.
Ultrasound-assisted extraction experiments
Dried Polygonum cuspidatum Sieb. et Zucc. was first ground into powder with the particle sizes smaller than 60 mesh and then 10 g of the above sample was soaked in 40 mL of 60% ethanol aqueous solution in a 500 mL Erlenmeyer flask for 12 h with a state of sealed and absence of light, then the system was placed in a 45 °C ultrasonic bath and extracted at 80 W for 35 min. Filtering the system with a 100 mesh nylon mesh after extraction, the solution was saved while the solid was extracted again for five times with the same volume of fresh solvent. The above solutions were extracted with petroleum ether to remove other lipid soluble impurities, then the ethanol phase was collected and the absorbance by UV spectroscopy was tested in the same manner presented in “Preparation of the standard curve of flavonoids” section; the concentration and the extraction ratio of flavonoids were calculated according to the standard curve and Eq. (5), respectively.
Extraction ratio
 $${E_{\rm{r}}} = {{{C_j} \times {V_j}} \over {\sum\limits_{i = 1}^n {{m_i}} }} \times 100\% \quad ,$$
E r (%) is the extraction ratio of flavonoids from Polygonum cuspidatum Sieb. et Zucc., C j (mg/mL) is the concentration of the total extraction solution after j times, V j (mL) is the total volume of extraction solution after j times, m i (mg) is the weight of the flavonoids extracted from the same Polygonum cuspidatum Sieb. et Zucc. powder for i times, and extraction process continues until flavonoids are undetectable in the extraction liquid after n times.
Experimental design of CCD
A four independent variable, five-level central composite response surface design (CCD) (Design Expert Software, Version 8.0.5; Cabit Information Technology Co., Ltd., Shanghai, China) was used for the optimization of the extraction conditions. The four selected independent variables were the ethanol content (%, A), the extraction temperature (°C, B), the extraction time (min, C), and the ultrasonic power (W, D). The factors and levels for each independent variable are shown in Table SIII. The coded levels of the independent variables are shown in Table SI.
Thermodynamic experiment
To investigate the thermodynamic property of the extraction system, a series of Polygonum cuspidatum Sieb. et Zucc. were accurately weighed under different concentration (C) of Polygonum cuspidatum Sieb. et Zucc.; the process was similar to that of “Ultrasound-assisted extraction experiments.” Then, the extraction experiment was carried out under the following conditions: the concentration of Polygonum cuspidatum Sieb. et Zucc. was 5%, temperature was 25 °C, 35 °C, and 45 °C, and other conditions were optimal conditions. After that, the concentration of flavonoids in the extract was tested, and the thermodynamic parameters, such as ΔH 0, ΔS 0, and ΔG 0, were calculated.
Supplementary material
To view supplementary material for this article, please visit https://doi.org/10.1557/jmr.2019.144.
Acknowledgment
This work was supported by the National Natural Science Foundation of China (Grant No. 51563015).