


Introduction
Climate change induces complex responses in most of the Earth’s systems, of which the cryosphere, loosely defined as the frozen water and soil on the surface of the Earth (e.g. Reference Bamber and PayneBamber and Payne, 2004), has been recognized as very important. Small alpine glaciers constitute a large water resource that is fast dwindling in size on a worldwide scale (e.g. Reference HoughtonHoughton and others, 2001). Monitoring and estimating future changes in glacier volume in response to warmer climate are of major importance because the rapid decrease in glacier size contributes to sea-level rise (e.g. Reference Dyurgerov and MeierDyurgerov and Meier, 2000) but is also a further constraint on water resources in many areas relying on water derived from snow and ice melt in mountains (e.g. Reference Liniger, Weingartner and GrosjeanLiniger and others, 1998). Furthermore, glaciers may be regarded as key indicators of climate change (Reference Haeberli, Cihlar and BarryHaeberli and others, 2000). To understand the process coupling between glacier volume change and large-scale (e.g. global) climate change, long-term records of glacier mass balance are of vital importance. The ongoing, currently 58 year, mass-balance record of Storglaciären, Sweden, (e.g. Reference Holmlund and JanssonHolmlund and Jansson, 1999) is the world’s longest continuous record of mass balance determined using the direct glaciological method (Reference Østrem and BrugmanØstrem and Brugman, 1991). As with most longterm observational records, changes in the observing and evaluating personnel as well as in data-measurement and -processing techniques can cause both gradual and sudden changes in the accuracy and precision of the reported data (e.g. Reference MobergMoberg, 1996). Hence, it is important not to treat long-term mass-balance data as a constant but to critically re-analyze the data for artefacts introduced by changing methodologies.
We have recalculated the Storglaciären mass-balance series based on refined topographic maps to remove the effects of poorer-quality maps used in calculating, primarily, the earlier part of the series. This has the additional benefits of increasing the accessibility of the dataset through digitization, and making the methodology more transparent. We have discovered a gradual decrease in divergence over time between the old official dataset (e.g. Reference Holmlund and JanssonHolmlund and Jansson, 1999) and the new recalculated dataset (this paper), with the largest deviation occurring in the 1940s and 1950s. The new data are slightly less negative, but the changes do not significantly influence the climatic conclusions to be drawn from the series. However, the relationships between, for example, net balance and equilibrium-line altitude (ELA) are improved by the recalculation.
Mass-Balance Measurements
Storglaciären
Storglaciären is a 3.1 km2 well-studied polythermal valley glacier in the Kebnekaise massif in northern Sweden (see reviews of dynamics and hydrology (Reference JanssonJansson, 1996), mass balance (Reference Holmlund and JanssonHolmlund and Jansson, 1999) and polythermal structure (Reference Pettersson, Jansson and HolmlundPettersson and others, 2003)). The annual mean temperature is approximately -6.0˚C at the average ELA (1945/46-2002/03: 1469 m a.s.l.). The glacier is surrounded by permafrost except at the forefield where the permafrost is discontinuous (Reference Holmlund, Burman and RostHolmlund and others, 1996; Reference Isaksen, Holmlund, Sollid and HarrisIsaksen and others, 2001). The average thickness of Storglaciären is 95 m and the maximum thickness is 250m. The climate of the area is characterized by prevailing westerly winds (e.g. Reference EnquistEnquist, 1916; Reference Pohjola and RogersPohjola and Rogers, 1997). The glacier has been in steady retreat since ∼1910 when it reached a maximum in response to the cooling during the late 19th century (Reference HolmlundHolmlund, 1987). The cumulative net balance curve for Storglaciären (e.g. Reference Jansson and LinderholmJansson and Linderholm, 2005, fig. 4) provides a scenario for the volume change for the time span of the mass-balance record. The retreat was interrupted by periods of higher winter precipitation in the mid-1970s, which translated into a complete halt in retreat during the 1980s. Since then, during the late 1980s and 1990s, another period of higher winter precipitation has caused large changes in volume but no major net change in either terminus position or surface elevation.
The mass-balance measurement system
When the mass-balance programme started in spring 1946 (Reference SchyttSchytt, 1947) it built on experiences gained by Reference Ahlmann and TryseliusAhlmann and Tryselius (1929) and Reference WallénWallen (1948) on Kårsaglaciären, and by Reference SverdrupSverdrup (1935) and Reference AhlmannAhlmann (1946) from Spitsbergen. The accumulation was determined by means of a large number of snow-depth probings and snow-density pits before melting occurred in mid-May. Ablation during the following summer was determined by a combination of stake readings and snow-pit studies (in the accumulation area). The programme was revised around 1960 by increasing the probing points to exceed 100 per km2 and by reducing the number of pits, in line with observations showing that the accumulation pattern on Storglaciären is much more complicated than the strongly elevation-dependent ablation pattern. In 1966 the system was changed by the introduction of a 100 × 100 m2 system of gridpoints. Snow-depth probings have been made every year at each gridpoint, resulting in 100 probing points per km2. Ablation stakes were also established at such points but at a density of about 20 per km2. The relative position of each stake was kept fixed (moving with the ice) for a 30 year period. When the stake net was renewed in 1986, the geometry was in accordance with the original 1966 system but kept semi-stationary by reinserting stakes at the original position when they melted out. Since 2001, new shorter, 5 m, stakes have been inserted every year at given points in the grid.
Methods of Calculating the Old Mass-Balance Record
The processing of mass-balance data involves turning all point measurements of accumulation and ablation into their water equivalent and interpolating the point measurements into a distribution over the glacier surface (e.g. Reference JanssonJansson, 1999). Analogue methods such as counting mm squares on graphing paper or using a planimeter were used for most of the mass-balance calculations. Digital methods for calculating areas were introduced in 1996 and form the basis for the re-analysis in this paper. We have used digitized map distributions as input for our re-analysis. This means that our calculation does not involve a re-evaluation of the field data, but a recalculation of the areas. This is elaborated upon below.
Reference JanssonJansson (1999) has discussed problems and errors associated with the conversion of discrete field measurements to the calculated distributed mass balance. Good-quality maps are crucial for this process, especially for longer-term records since the glacier geometry changes with time. However, as mass-balance programmes progress, new maps can be constructed but they may quickly become outdated (e.g. by strong retreat due to climate change).
Several maps have been used for the mass-balance measurements on Storglaciären. Figure 1 shows the periods of use for all the maps in the old mass-balance series and in our re-analysis. The first detailed and reliable map of the Kebnekaise area was produced by the Swedish Tourist Association (STF) in response to the interest both of scientists and of a growing tourist market in the early 20th century. Terrestrial oblique photographs were taken in 1910 and 1922 to produce a map printed in 1925 at a scale of 1 : 100 000 (STF, 1925). This was the only existing detailed map of the area when the mass-balance programme was initiated in 1946, and was used, in a slightly refined version through glacier front measurements and geodetic surveys, for mass-balance calculations during the 1940s. The Swedish Air Force took vertical photos in 1946 and 1949, and the first map for scientific use was printed in 1952 (Reference WoxnerudWoxnerud, 1951) and used for the 1950s calculations. The datum level of this map is about 8 m lower than that of later maps. During the 1950s the glacier retreated rapidly and the terminus thinned significantly. In 1959 the Swedish Land Survey took black-and-white vertical photographs over the area, and a sketch map, never printed, was produced and used for the mass-balance measurements between 1961 and 1973. The construction of the map suffered from the featureless white snow in the accumulation area, and contour lines were misinterpreted. This problem was corrected 20 years later by Reference HolmlundHolmlund (1996). In 1969 a new set of aerial photographs was taken and a two-colour 1.10000 map was printed in 1973 (V. Schytt, unpublished map, available at Department of Physical Geography, Stockholm University). This 1969/73 map was used until 1986. In 1980 the entire Kebnekaise massif was photographed from 9200, 4600 and 1500 m. A detailed 1 : 10 000 map covering the entire Tarfala drainage basin, which includes Storglaciären, was constructed for scientific use (Reference HolmlundHolmlund, 1987). This map was used until 1992. In 1990 another extensive photographic programme was executed. A 1.10000 map of Storglaciären, Isfallsglaciären and Kebnepakteglaciären was printed in 1992 (Reference HolmlundHolmlund, 1996). The geodetic base is the same as that used for the 1980 map. The contours outside the glaciers were taken from the 1980 map and not reinterpreted. Thus, the geodetic base is identical for the 1959, 1980 and 1990 maps. The 1990 map is still in service. New vertical photographs were taken in 1999 but have yet to be evaluated to produce a map. The 1990 map is still a good representation of the glacier since the glacier has been in quasi-steady state during most of the period. Glacier terminus surveying and levelling of profiles across the ice surface (Tarfala Research Station, unpublished data) also indicate very little change in ice surface elevation.
Upper line: map base for the old official mass-balance series of Storglaciären (e.g. Reference Holmlund and JanssonHolmlund and Jansson, 1999; Reference Haeberli, Frauenfelder, Hoelzle and ZempHaeberli and others, 2003). Lower line: map base for the recalculated mass-balance series of Storglaciären (this paper). Years denote year of acquisition of the aerial photographs for each map.
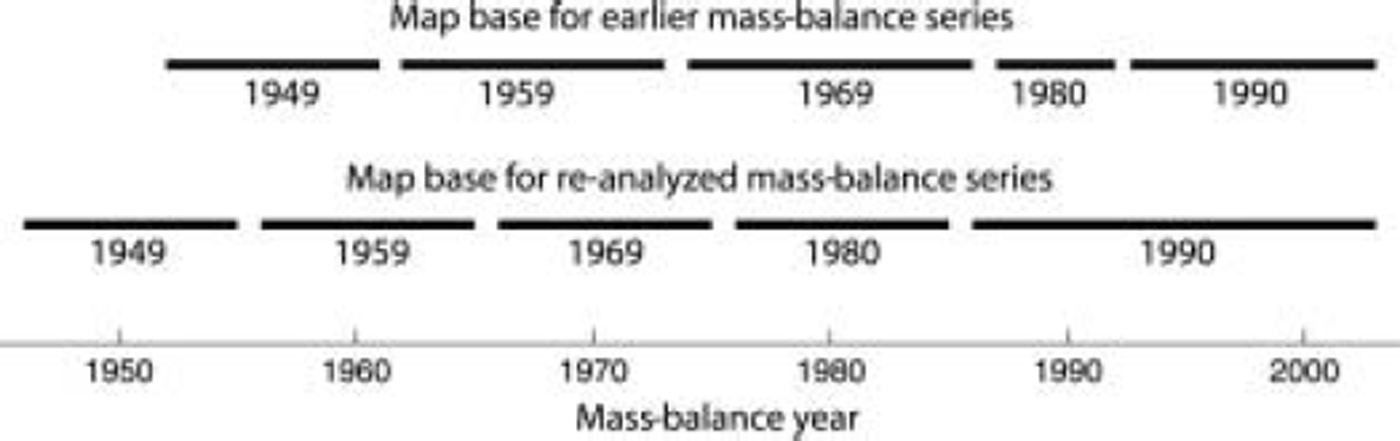
The coverage of maps is summarized in Figure 1 . It is evident that the periods of use of the maps are not optimal. We have therefore adopted a scheme where maps are considered valid for a 4 year period before, and 5 year period after, the year when the aerial photographs were taken. This is also illustrated in Figure 1. Hence, the following recalculation of the Storglaciären mass balance involved using better-constrained maps and shifting the periods over which the maps are used to centre around the date of the aerial photographs.
Methods
The re-analysis of the mass-balance data for Storglaciären includes digitization of old water equivalent contour maps of the winter and summer mass balance, interpolation of the digitized contour maps onto an evenly distributed glacier surface grid, and combining the mass-balance grids with a digital elevation model (DEM) of the glacier to calculate the height-distributed mass balance.
The water equivalent contour maps were digitized by scanning and georeferencing the scanned map using fixed points with known coordinates marked on the map. The digitized contours were then interpolated onto a 20 × 20 m grid using kriging interpolation routines (Reference Deutsch and JournelDeutsch and Journel, 1992). A linear semivariogram model was used in the interpolation of all grids. The slope of the variogram model was automatically fitted to the experimental semivariogram using a least-squares fitting method.
The calculation of the net mass balance using the interpolated grids assumes that each grid node in the equal-sized winter balance, summer balance and elevation grids corresponds to certain areas determined by the grid spacing. The height-distributed mass balance was found by searching the DEM for grid nodes on the glacier that lie within defined elevation intervals and extracting the mass-balance values at the same grid nodes from the mass-balance grids. Thus, the mass balance for a single elevation interval containing n nodes can be calculated as:
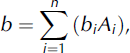
where b is winter or summer balance for the whole elevation interval and bi and Ai are the mass balance and area for individual nodes within the elevation interval, respectively (Jansson, Reference Jansson1999). The net balance for each elevation interval is found by subtracting the winter balance from the summer balance, and the total mass balance for the glacier is found by summing all the elevation intervals.
Results
The old and the re-analyzed datasets are shown in Figure 2a and b, respectively. It is apparent that small differences exist; the difference between the two datasets is shown in Figure 2c. The largest adjustments have occurred in the mass balances from the 1940s and 1950s by up to 0.8 m w.e. After about 1960, changes are much smaller, generally <0.1 m w.e., with the exception of a few specific calculations with errors <0.4mw.e. Since all three balances are shown, it is easy to identify which of the winter and summer balances have been poorly calculated. Although both winter and summer balances are well represented, more summer than winter balances appear to be incorrect. This may be an effect of the different sampling strategies for winter and summer balance. Errors in ablation values affect results more than errors in accumulation values because of the difference in sampling density between the two datasets.
Earlier reported (a) and recalculated (b) mass-balance series for Storglaciären. The difference between (a) and (b) (old – new) is shown in (c). Winter balance: white bars; summer balance: grey bars; net balance: black bars. Solid lines are 5 year running means.
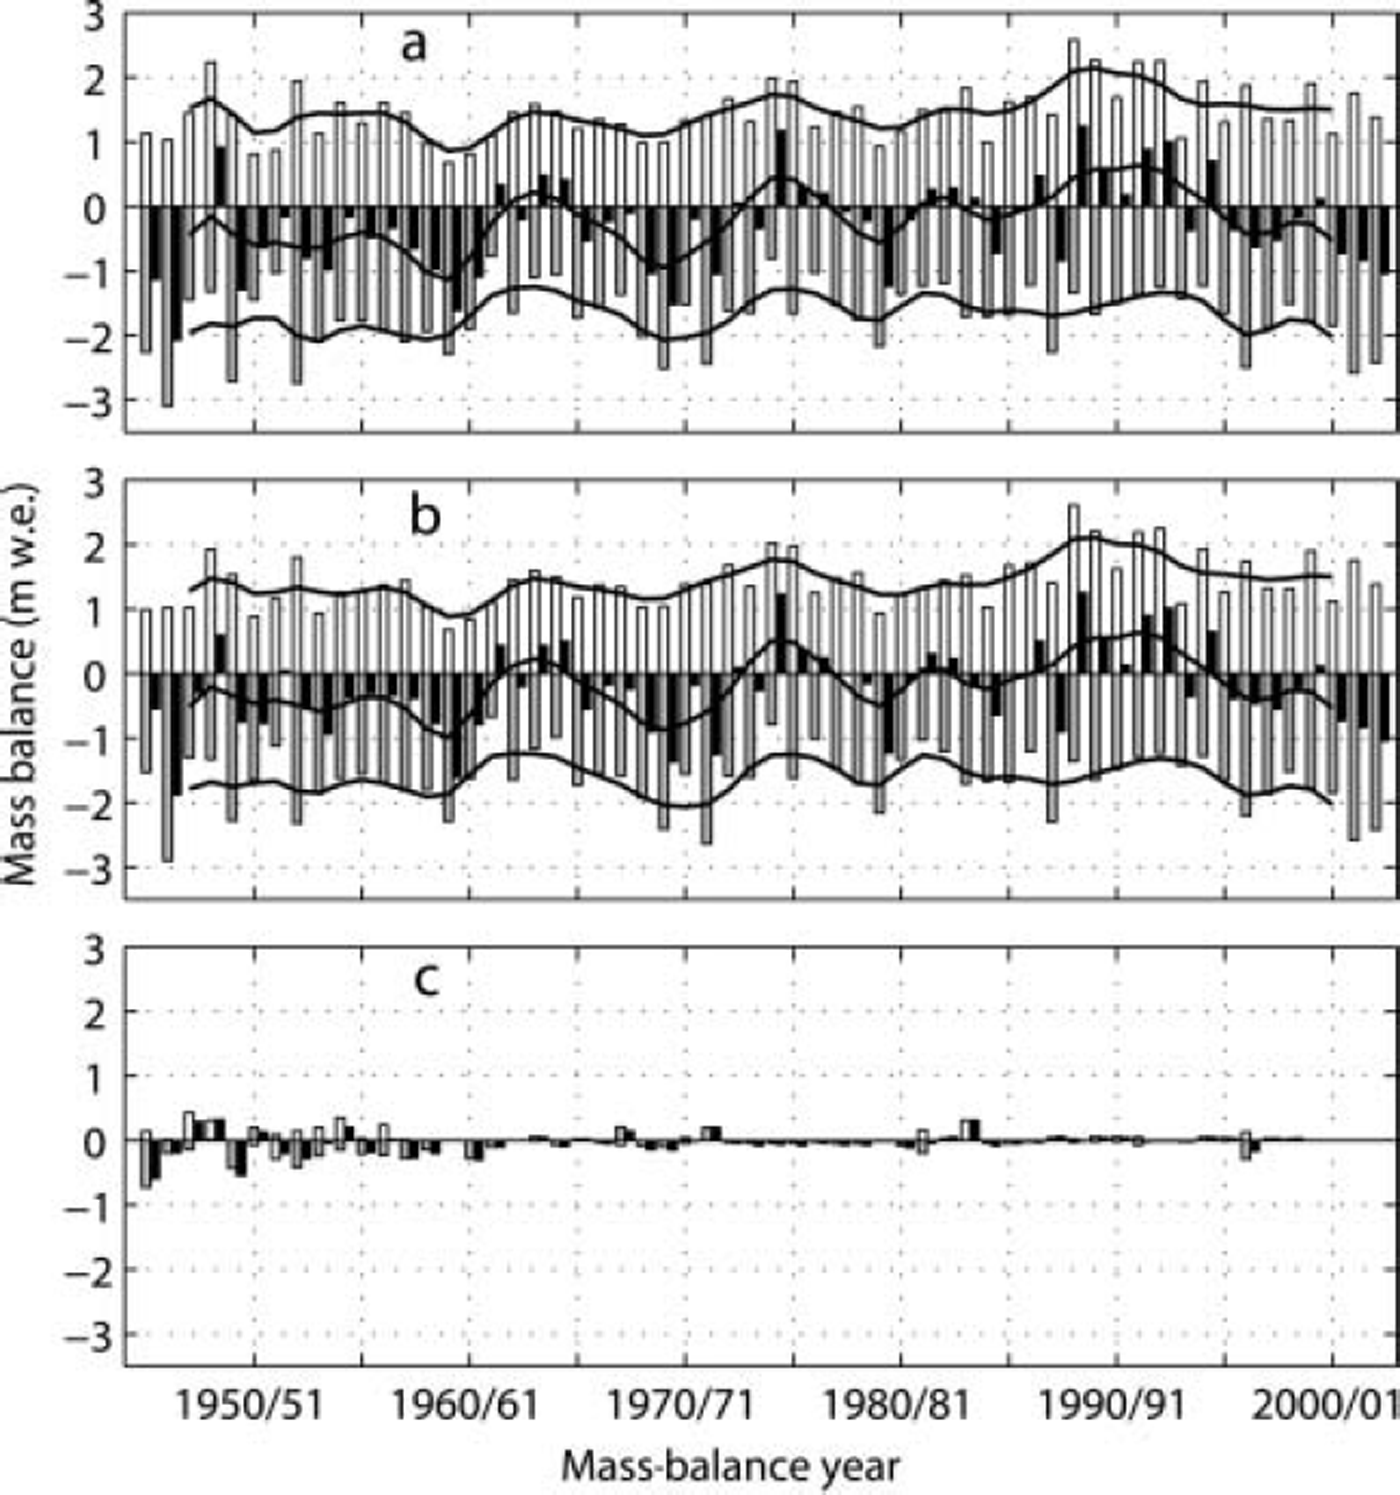
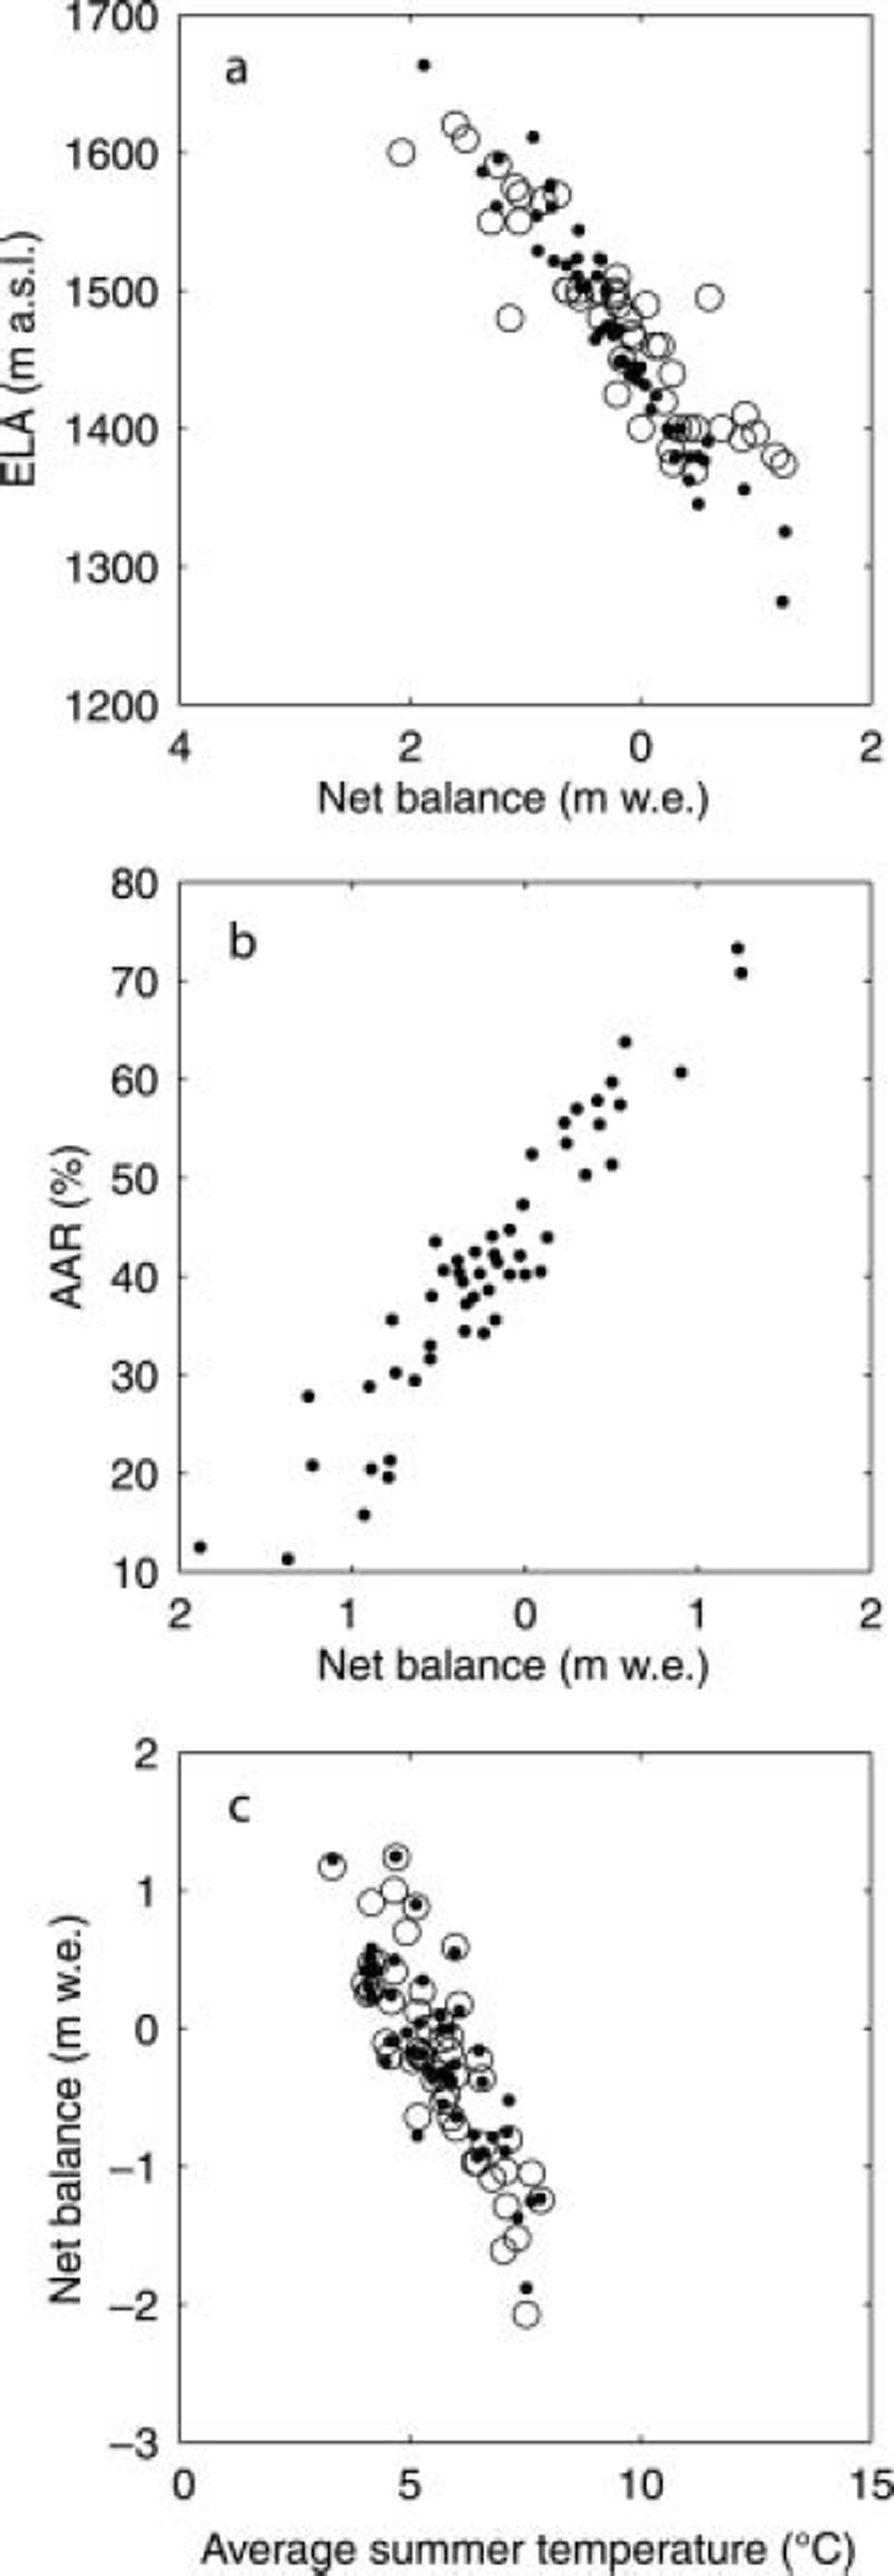
Figure 3 shows the resulting relationships between net balance and ELA, accumulation-area ratio (AAR) and average summer temperature. The relationship between net balance and ELA shows significantly smaller scatter for the re-analyzed dataset compared with the old dataset, indicating an improvement in the dataset (Fig. 3a).
Comparisons of earlier (open circles) and recalculated (filled circles) data of (a) net balance and ELA; (b) net balance and AAR; and (c) average summer temperature in Tarfala and net balance. The AAR values were calculated from the distributed balances, and AAR value data for the old series are incomplete and not shown.
Analysis of the New Mass-Balance Record
The striking feature of the mass-balance series is its temporal variation (Fig. 2). We have employed traditional spectral analysis and the newer wavelet analysis to elucidate any repetitive signals in the new mass-balance data.
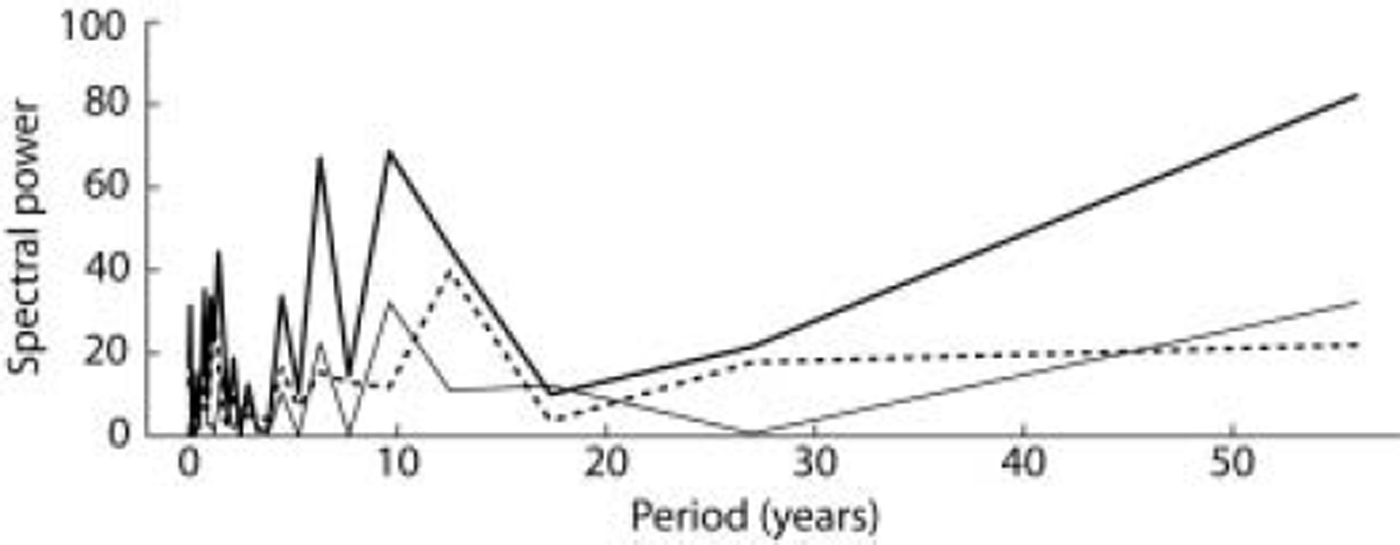
The cyclic signal present in the mass-balance record was analyzed by applying traditional power spectrum analysis (e.g. Press and others, Reference Press, Teukolsky, Vetterling and Flannery1992; Carr, Reference Carr1995), which decomposes the time domain signal into its frequency domain components. The resulting power spectrum is shown in Figure 4. Winter balance does not yield major peaks, except possibly at 10 years. However, summer balance yields several larger peaks at approximately 2-3, 7 and 10years, the latter being the strongest. Of these, only the 7 and 10year cycles are relevant, since the 2-3 year cycle is close to the Nyquist frequency (e.g. Churchill and Brown, Reference Churchill and Brown1987) and hence is strongly influenced by year-to-year noise. The net balance also shows a peak at 13 years, which most probably is a result of small peaks of winter and summer balances interacting with each other. The cycles in the net balance result predominantly from the strong cycles in the summer balance.
Power spectrum of winter (thin solid line), summer (thick solid line) and net (dashed line) balance from Storglaciären.
The wavelet analysis was made by employing a Mexican hat wavelet function of the form

(e.g. Reference DaubechiesDaubechies, 1992), where x is the time-dependent variable. The choice of wavelet model was based primarily on its simplicity, but the non-orthogonal characteristic of the Mexican hat wavelet also makes it suitable for time-series analysis. Calculations were made using the Mathworks MatlabTM Wavelet Toolbox.
We have analyzed both winter and summer balances and the resulting net balance (Fig. 5). The wavelet analysis yields wavelet coefficients akin to correlation coefficients between the signal and the applied wavelet. The coefficients contain information on both scale and position (time in the case of a time series). The wavelet is rubber-banded to fit different timescales while its amplitude characteristics are maintained by applying a scaling function. The results of applying a wavelet transform to a signal such as that of a glacier balance (bW, bS or b N) is a two-dimensional field of wavelet coefficients.
Wavelet analysis for winter (b W) (a–c), summer (b S) (d–f) and net (b N) (g–i) balance for the Storglaciären mass-balance series 1945/46– 2002/03. (a, d, g) The wavelet coefficient field for different wavelet scales (1–16 years). The greyscale is calibrated to ten equal steps between the maximum (lighter shades) and minimum (darker shades) coefficient values. (b, e, h) The respective balances for reference. (c, f, i) Curves for each scale (1–16 years) at which the analysis is performed. The curves correspond to the fields in (a, d, g) and show how the different scales relate to the original data, from which they are decomposed.
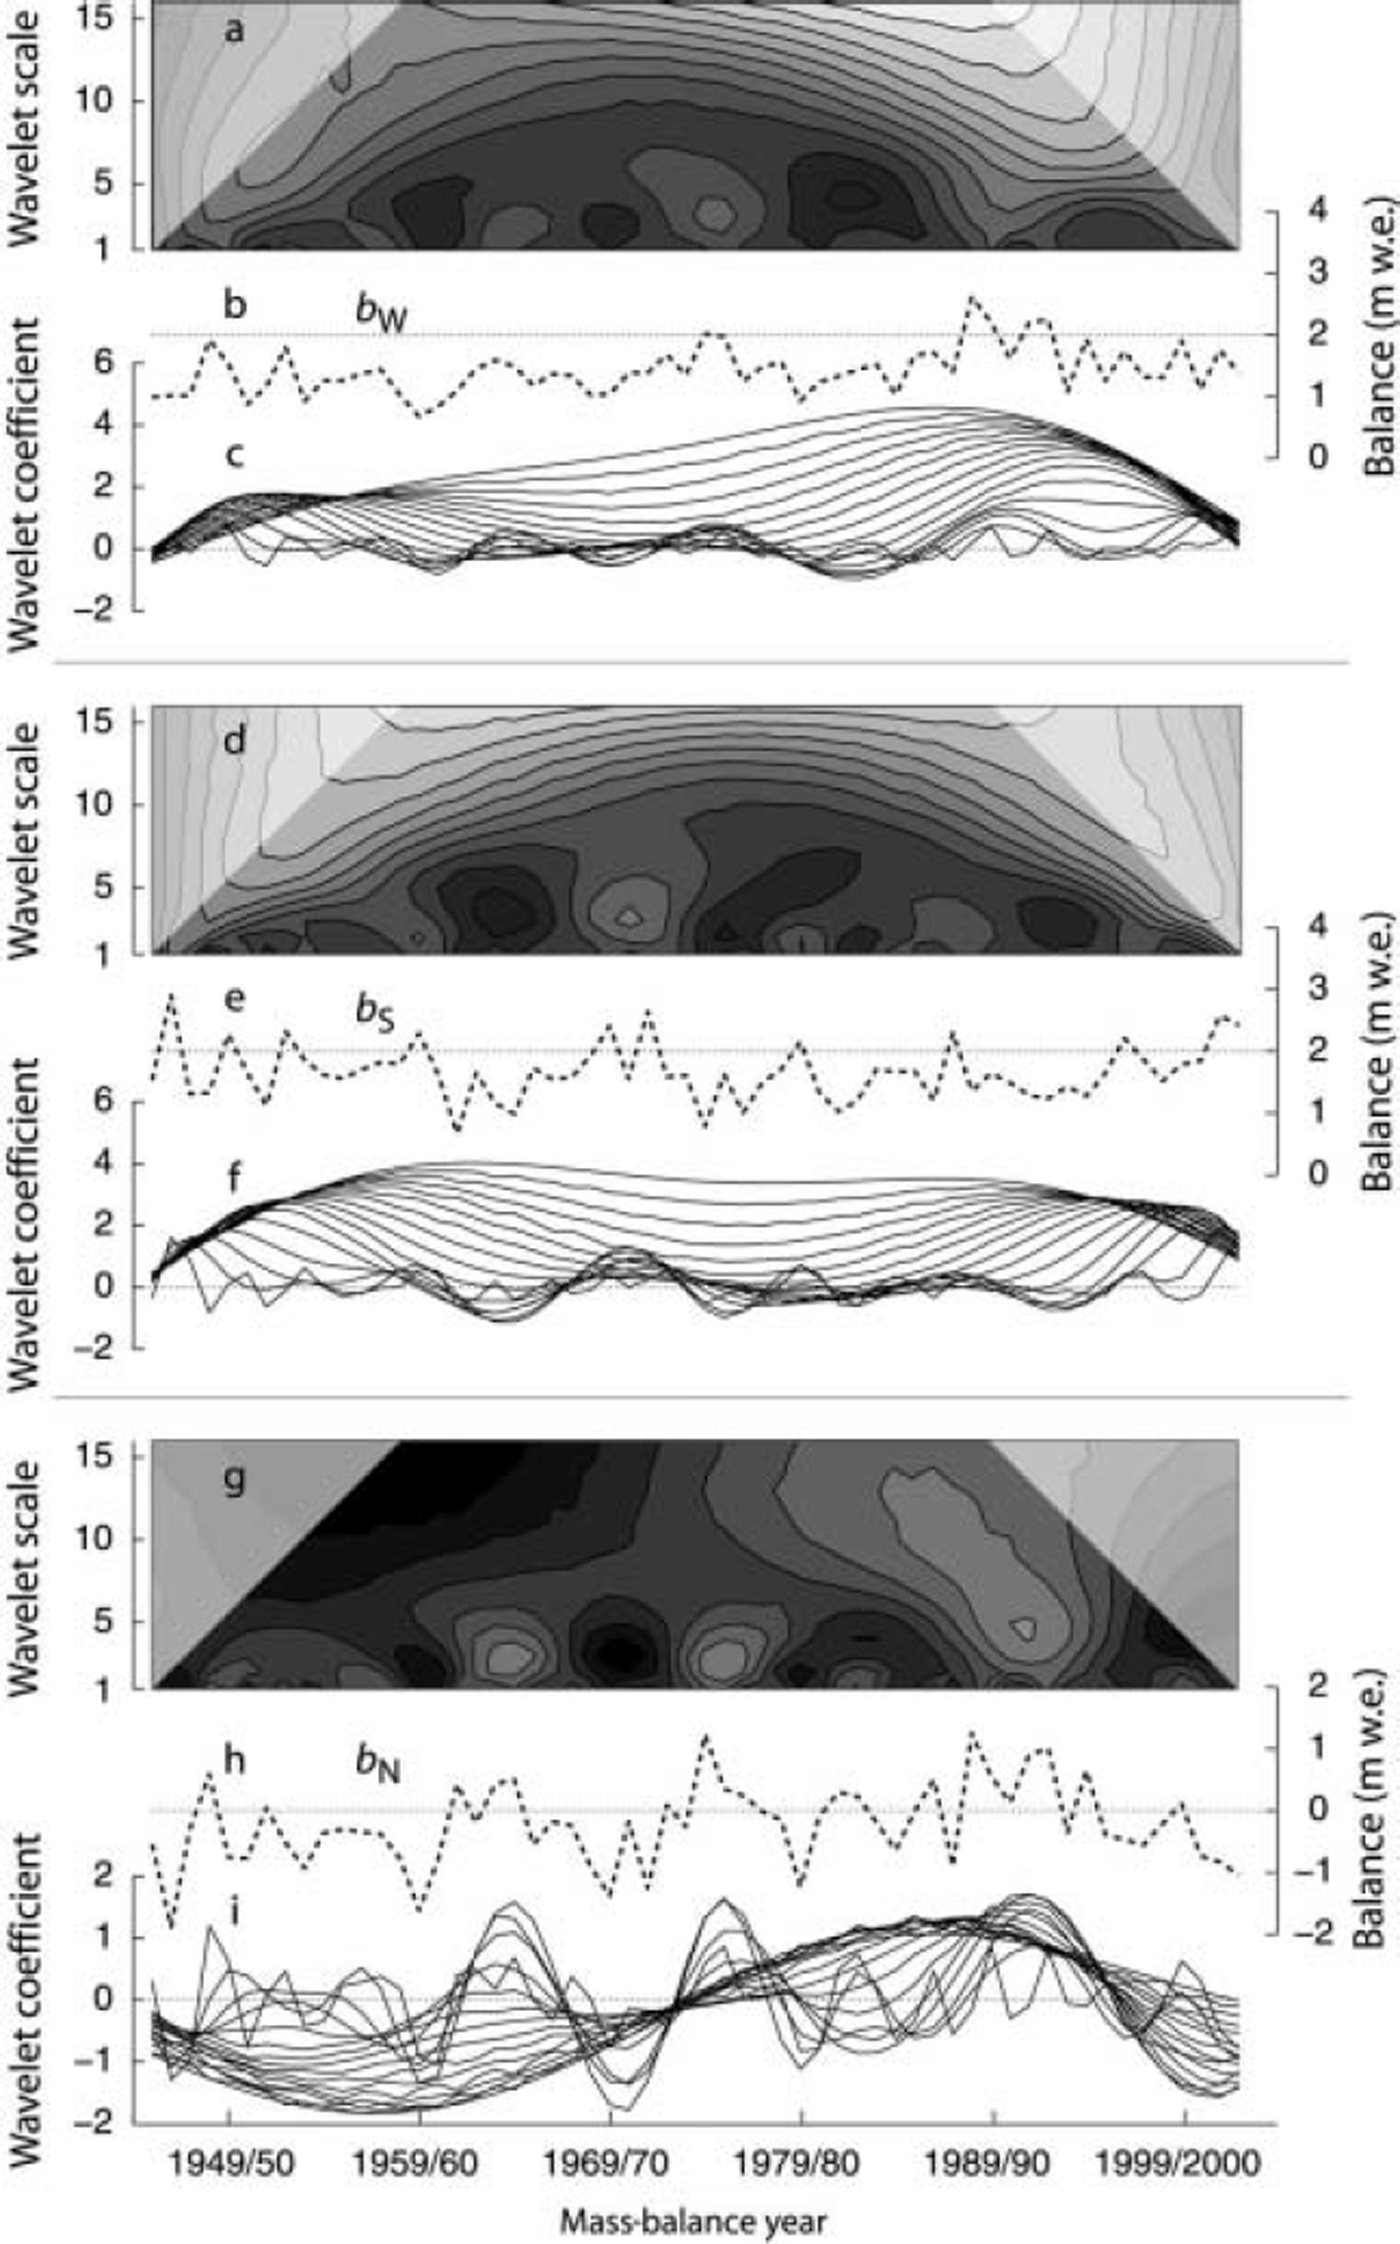
The results (Fig. 5a, d and g) indicate the record is highly variable on a scale <4-5 years, with some hints of periodicity only in parts of the record. Above this scale, the short-term signal contains fewer variations, but there is no strong cyclic signal in either of the balances. The apparent periodicity suggested by visual inspection of the running mean curves of Figure 2 thus lacks substance.
Conclusions
The re-analysis of the Storglaciären mass-balance record yielded significant changes in mass balance by up to 0.8mw.e. in the early part of the record. Such errors can be expected because the early mass balances were evaluated on sub-standard base maps. Occasional errors were discovered in more recently calculated mass balances that are probably attributable to problems arising from manual calculations. Such errors are <0.4 m w.e. We strongly recommend re-analysis of other long-term mass-balance records to improve the database used for different estimates of effects of glacier volume change on the environment.
Acknowledgements
We thank all those, mostly unpaid students and volunteers, involved in measuring and evaluating the mass-balance data over the years. The Tarfala Research Station and its mass-balance monitoring programme has been supported by funding from the Swedish Research Council (VR; formerly the Swedish Natural Science Research Council (NFR)) and by the Wallenberg Foundation. Comments by L. Rasmussen significantly helped to improve the paper. Further details on the dataset and updates are posted on a regular basis at www.glaciology.su.se.



