Introduction
Alien plant invasion is widely acknowledged as a significant threat to the integrity of natural ecosystems, with detrimental impacts on native plant community structure (Zheng et al. Reference Zheng, Burns, Liao, Li, Yang and Chen2018, Shiferaw et al. Reference Shiferaw, Schaffner, Bewket, Alamirew, Zeleke and Teketay2019). Plant invasion is also a driver of global environmental change through reductions in forage availability and the decline of native species diversity and ecosystem functioning (Bellard et al. Reference Bellard, Cassey and Blackburn2016, Early et al. Reference Early, Bradley, Dukes, Lawler, Olden and Blumenthal2016). Despite numerous efforts in governance at the regional, national and global levels to address these threats (Pyšek et al. Reference Pyšek, Hulme, Simberloff, Bacher, Blackburn and Carlton2020), there is no indication that the global accumulation of invasive alien plant species (hereafter ‘invasive species’) is starting to abate (McGeoch et al. Reference McGeoch, Butchart, Spear, Marais, Kleynhans and Symes2010, Seebens et al. Reference Seebens, Blackburn, Dyer, Genovesi, Hulme and Jeschke2017).
Of great concern is the propensity for the anthropogenic disturbance and degradation of natural processes to enable invasive species to establish and propagate rapidly (Foxcroft et al. Reference Foxcroft, Pyšek, Richardson, Genovesi and MacFadyen2017). Investigations coordinated by the Scientific Committee on Problems of the Environment (SCOPE), going as far back as the 1980s, show that even protected areas (PAs) across different ecological regions are not immune to invasions (Macdonald & Frame Reference Macdonald and Frame1988), which is amply evident from several recent studies based in the tropics (Choudhury et al. Reference Choudhury, Deb, Singha, Chakdar and Medhi2016, Nath et al. Reference Nath, Sinha, Lahkar and Brahma2019, Bhatta et al. Reference Bhatta, Joshi and Shrestha2020). The threat of invasive species in PAs has increased the workload of forest managers and often poses insurmountable problems in habitat management (Shackleton et al. Reference Shackleton, Foxcroft, Pyšek, Wood and Richardson2020).
PAs remain vulnerable to invasions because species may be introduced as ‘stowaways’ (e.g., in tourist cars), via ‘corridors’ (e.g., roads, trails) and by natural processes (e.g., dispersal by wind and water). Such increases in propagule pressure may explain the high infestation rates of alien species in tourist-heavy sites (Anderson et al. Reference Anderson, Rocliffe, Haddaway and Dunn2015). However, the invasibility of ecosystems may vary, and this depends on multiple intrinsic or extrinsic factors such as native species diversity, fire, disturbance and the influence of climatic changes (Davis et al. Reference Davis, Grime and Thompson2000, Agrawal & Kotanen Reference Agrawal and Kotanen2003, MacDougall & Turkington Reference MacDougall and Turkington2005). A site with complex vegetation physiognomy may resist alien invasions (Kennedy et al. Reference Kennedy, Naeem, Howe, Knops, Tilman and Reich2002), while degradation may mobilize resources and space in favour of intruders (Hobbs & Huenneke Reference Hobbs and Huenneke1992, Cadenasso & Pickett Reference Cadenasso and Pickett2001). The outcome of competitive interactions between native and alien species (MacDougall & Turkington Reference MacDougall and Turkington2005) would then vary depending on species attributes such as reproductive traits (Rejmánek & Richardson Reference Rejmánek and Richardson1996) and environmental variables (Alpert et al. Reference Alpert, Bone and Holzapfel2000, Thuiller et al. Reference Thuiller, Richardson, Rouget, Procheş and Wilson2006).
Managing invasive species therefore requires understanding of both site susceptibility to invasions and the potential impacts of invaders on the native plant communities. Here, we study the possible increase in infestation by two widespread invasive plant species – Chromolaena odorata (L.) R.M. King & H. Rob. and Mikania micrantha Kunth – in India’s Manas National Park (MNP), a 519km2 conservation site in north-eastern India that is considered critical for the survival of several threatened and endemic flora and fauna (Jain & Hajra Reference Jain and Hajra1975, DebRoy 1991). These invasive species, native to the neotropics, were introduced into India in the latter half of the 20th century and are considered a major threat to native vegetation (Chandrasekaran & Swamy Reference Chandrasekaran and Swamy2010, Lahkar et al. Reference Lahkar, Talukdar and Sarma2011, Adhikari et al. Reference Adhikari, Tiwary and Barik2015, Choudhury et al. Reference Choudhury, Deb, Singha, Chakdar and Medhi2016). C. odorata is a perennial shrub in the Asteraceae family (Gautier Reference Gautier1992) and is included in the list of the 100 worst invasive species by the International Union for Conservation of Nature’s (IUCN) Invasive Species Specialist Group. M. micrantha is a perennial non-woody creeping climber and is recognized for its rapid and aggressive growth, high reproductive rate and preference for sites with high fertility and humidity (Swamy & Ramakrishnan Reference Swamy and Ramakrishnan1988). Prior research on these species indicates high densities in distinct sites across MNP, with substantial overlap between the two species’ ranges (Das et al. Reference Das, Banerjee and John2019, Nath et al. Reference Nath, Sinha, Lahkar and Brahma2019).
Although specific invasive plant species distributions can span regional and sub-continental scales, the clues to understanding the increase in range and abundance may lie at smaller (landscape) scales, typically being caused by local changes in vegetation and land use. If environmental factors have a major influence on the invasibility of an ecosystem (Foxcroft et al. Reference Foxcroft, Pyšek, Richardson, Genovesi and MacFadyen2017), then the spatial patterns of plant invasions should be strongly linked to environmental changes. Predictive niche models may thus track fine-scale environmental aspects to quantify susceptibility to invasion, but such approaches to forecasting plant invasions have met with mixed success (Das et al. Reference Das, Banerjee and John2019, Nath et al. Reference Nath, Sinha, Lahkar and Brahma2019, Bhatta et al. Reference Bhatta, Joshi and Shrestha2020). Here, we report findings from a study that involves extensive field sampling of invasive species composition and abundance at a fine scale in MNP undertaken at two time points 8 years apart – in 2011 and 2019.
We hypothesize that changes in vegetation, moisture stress and several agents of disturbance including fires, floods, roads and edge effects are the key determinants of invasive species abundance in the short and long term. Being typically non-woody, fast-growing and rapidly dispersing species, invasive plants can respond quickly to changes in environmental factors and exploit favourable conditions better than native plants. Accordingly, we hypothesize that sites that are located further away from disturbance at habitat edges such as a PA boundary or road or river networks would show lower infestation (Anderson et al. Reference Anderson, Rocliffe, Haddaway and Dunn2015). Similarly, we predict that relatively undisturbed sites with intact native vegetation would resist plant invasions. The asymmetric competitive advantages of native plants or life historical attributes of invasive species such as shade intolerance or requirements for open habitat conditions and high resource availability may make it difficult for invasive species to establish and grow in less disturbed, intact habitats (Zhang et al. Reference Zhang, Ye, Cao and Feng2004, Quan et al. Reference Quan, Mao, Zhang, Xie, Xu and An2015). It is also expected that the greater niche complementarity of species-rich plant communities would provide fewer opportunities for invading species to exploit, so the higher native plant density of intact vegetation should be associated with lower invasive species abundance. At smaller spatial scales, soil water availability is often affected by numerous environmental factors, such as soil type, landscape position and topography (Jacobs Reference Jacobs, Mohanty, Hsu and Miller2004), and water availability will affect the relative performance of invasive and native plant species (Guo et al. Reference Guo, Xu, Li, Ren, Liu and Guo2020). In Terai habitats such as those in MNP, seasonal floods may inundate some sites for several weeks or even months. How such seasonal floods affect the composition and diversity of native grass and woody species or the abundance of invasive species is not well understood (Das et al. Reference Das, Banerjee and John2019). To capture the habitat and topographical effects on water availability and the potential influence of seasonal inundation, we quantified the spatial patterns of flooding, elevation, slope and a satellite-derived drought stress index (Wang & Qu Reference Wang and Qu2007) as explanatory variables. Increased soil moisture conditions aggravate the competitive effects of invasive plants (Guo et al. Reference Guo, Xu, Li, Ren, Liu and Guo2020), so we predicted that the variables associated with soil moisture would be strongly correlated with invasive species abundance.
We used robust statistical models to simultaneously test the relative strengths of these environmental and habitat factors in predicting invasive species abundance for the entire MNP landscape. We then derived invasive species risk maps that would be useful not only to forest managers, but also for understanding the changes in invasive species abundance. Overall, our aim was to provide strong grounds for invasive species management in MNP and other PAs in this region.
Methods
Study area
MNP is a 519km2 protected wildlife conservation area in the foothills of the Bhutan Himalayas in north-eastern Assam in India (Fig. 1). Located at 26.60°–26.82°N and 90.81°–91.24°E, it shares its northern border with the broadleaf hill forests of Bhutan’s Royal Manas National Park. The southern border of the MNP transitions sharply to densely inhabited villages and agricultural lands in Assam, and to the east and west are reserve forests in Assam that are generally fragmented and susceptible to varying degrees of human use.
Study area map of Manas National Park (Assam, India) showing the overall location, habitat types and locations of sample plots.

MNP is a UNESCO World Heritage site and a critical wildlife habitat located at the eastern edge of the Terai–Duar Savanna and Grasslands ecoregion (Olson et al. Reference Olson, Dinerstein, Wikramanayake, Burgess, Powell and Underwood2001). Despite being protected, local people collect forest resources such as grasses and reeds and graze their cattle in some sites near the southern boundary. Forest managers use grass fires in the winter dry season to stop woody encroachment in grasslands, but this is not carried out systematically (Banerjee et al. Reference Banerjee, Das and John2021). In some parts of MNP, people may use fire to remove dried, unpalatable biomass and promote the fresh growth of grasses.
Despite its location at the Himalayan foothills, the altitude is as low as 6 m above sea level near the southern boundary of MNP, but this rises to 305 m at the northern edge. The Indian monsoon brings heavy rainfall (mean 2400 mm a year over 2011–2020), mainly between June and October, but pre-monsoon showers in April and May are also significant. The winter dry season begins in November and lasts until March, during which the mean monthly rainfall is c. 26 mm. The temperature ranges from a mean maximum of 32°C in the summer to a minimum of 7°C in the winter.
Field methods
We undertook the first vegetation sampling exercise in 2011–2012 and installed 134 sampling plots of 30 m × 30 m in size (hereafter ‘30-m plot’). The plot locations were chosen randomly (2D Poisson) to capture the heterogeneity of vegetation and habitats, but the final locations of several plots had to be adjusted based on access and terrain (for details, see Das et al. Reference Das, Banerjee and John2019). During the second sampling exercise carried out from November 2019 to February 2020, we attempted to resample the original 134 plots. However, due to logistical constraints, road abandonment, dense undergrowth and swampy conditions, we could resample only 83 of those original plots. We increased our sampling effort in this session by adding 24 new plots in feasible nearby locations to the previous plots, which raised the total to 107. In each of these plots, we further installed two quadrats of 5 m × 5 m in size (hereafter ‘5-m quadrat’) at the distal ends to sample herbaceous and understory plants.
Surveys showed that C. odorata and M. micrantha were the two most frequent and abundant invasive plants in MNP. We estimated the abundances of these two invasive species as the number of clumps (genets could not be clearly distinguished) inside the two (or three for the 2011 survey) 5-m quadrats of each 30-m vegetation plot. Clump sizes were very similar within species, so species abundance could be reliably and consistently counted across all quadrats. We expressed the mean density for the two invasives in each 30-m plot using these mean density values in the 5-m quadrats.
Change in invasive species density from 2011 to 2019
During the survey in 2011–2012, we counted invasive species in three 5-m quadrats in each 30-m plot and computed plot-level means. Using these two datasets, we computed the following to quantify changes over the 8-year period. For plots with non-zero invasive species abundance in 2011–2012, we computed the ratio of current (2019) density to prior density for each plot for each species. Thus, we tallied the number of plots in each of the following categories for both species.
-
(1) Ratio less than one (<1): coded as showing decrease in invasive density;
-
(2) Ratio equal to one (1): plots where the invasive species was absent for both surveys: coded as no change;
-
(3) A ratio greater than one (>1) but less than two (<2): coded as moderate increase;
-
(4) A ratio greater than two (>2): coded as a high increase;
-
(5) Plots where invasive species were absent during the initial survey but present in the second survey: coded as newly invaded.
There were no plots where invasive species were lost after being found in the initial survey.
Environmental predictors of invasive species abundance
We tested the importance of several variables as predictors of invasive species range and abundance in MNP. Mean annual inundation period (to quantify seasonal flooding), elevation and slope (to measure topographical influence) and cumulative number of fire events (Fire-frequency) over the short term (over 2 years) and long term (over 19 years) were derived directly from remotely sensed data. The monthly value (mean) of the normalized difference vegetation index (NDVI) for the pre-monsoon (February/March) and post-monsoon (November) was used to capture the density of vegetation, and the normalized multi-band drought index (NMDI) for February/March was used to indicate dry season moisture stress. These variables were calculated as raster images at their original data resolutions and finally resampled at 30-m resolution for the 519km2 MNP area (for full details, see Appendix S1).
We digitized the road and river networks using a combination of actual road tracking on the ground with a GPS device and Google Earth Pro and Landcover classification maps of MNP. Using these data, we generated two raster maps, one in which pixel values were the proximity (distance) to the nearest road (Distance to Road) and the other where pixel values were the distance to the river channel (Distance to River). We also created a raster map with pixel values indicating the distance to the southern boundary of the park to capture the distance to human settlements (Distance to Settlements).
Environmental determinants of invasive species abundance
We performed multiple regressions to determine the nature and strength of the potential influence of environmental factors on the current (2019) abundances of C. odorata and M. micrantha. We computed regressions independently for the two species, with the log-transformed invasive species abundance in the 30-m plots as the response variable and the corresponding values of environmental variables as predictors. This was done to determine the directionality and the degree of influence of these variables on the abundance of invasive species.
Next, we used the random forest (RF) regression and prediction framework based on the abundance of invasive species measured in the 107 vegetation plots to estimate their distributions and abundances for the MNP landscape. RF is an ensemble-based decision-tree algorithm for classification and regression, accessible in R (4.1.1) as the software package randomForest (Liaw & Wiener Reference Liaw and Wiener2002). To perform this regression, we randomly allocated the 107 plots to a training dataset of 67 plots and a testing dataset of 40 plots. By ‘random’ we mean that any plot could have been chosen to be in the training or test data with equal probability and in proportion to the number of data points in each component. We next used the training dataset to run RF regressions for each invasive species, with log-transformed clump density values as the response variable and the associated predictor values derived from the ‘stack’ of predictor raster files. The computed regression model was then used to predict for the testing data points (40 points here), and the goodness of fit between the predicted and observed (test data) values was measured using mean squared error (MSE) and R2 values.
We calculated the importance of each environmental predictor by scoring the increase in MSE upon removing that predictor from the regression model. This was implemented by using the variable importance function in randomForest. Finally, we used the fitted RF regression models to predict invasive species abundance at the 30-m pixel resolution for the entire park and thereby also mapped the distributions of the two species. We did this by using the computed regression and raster maps of environmental parameters and implementing the predict function in randomForest.
The association between invasive species and native plant diversity
We tested whether invasive species were associated more often with sites of lower native plant diversity. To do this, we selected the 30-m plots in which only one of the two 5-m quadrats had non-zero abundance of a specific invasive species. These plots, therefore, had both invaded and non-invaded quadrats placed closely together, but they were otherwise expected to have similar characteristics. We found 21 such plots for C. odorata and 23 for M. micrantha. We enumerated all plants (grasses, herbs, climbers, shrubs, tree seedlings and saplings), including invasive species in each quadrat. For grasses, we counted the number of recognizable clumps of each species. Large woody plants were already sampled for the entire 30-m plot. Excluding M. micrantha and C. odorata from the data, we computed species richness, species composition and species diversity. To test the association between native species diversity and invasion, we compared species richness and Shannon’s index and Simpson’s index values of the species diversity of the invaded and non-invaded quadrats using paired-sample t-tests (see data in Appendix S2).
Results
Change in invasive species density from 2011 to 2019
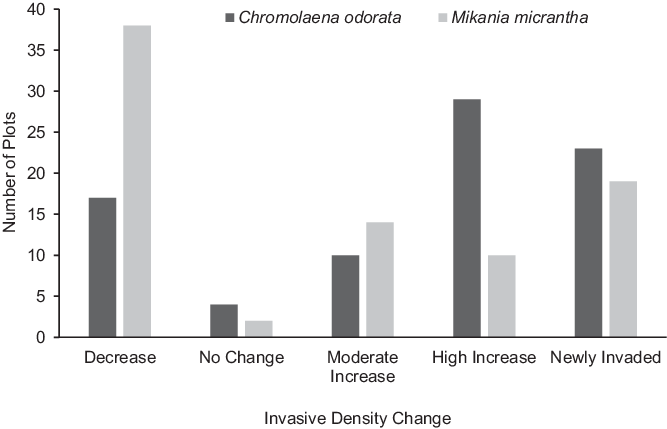
The repeat sampling of 83 plots revealed a decrease in C. odorata density in 20% of the plots, whereas new invasions of C. odorata were recorded in 28% of the plots. In almost half of the plots, C. odorata density increased by a moderate (12%) or high (35%) value. Only a few plots remained uninvaded by the species at the end of the 8-year period (Fig. 2).
The change in density of Chromolaena odorata and Mikania micrantha observed in 83 vegetation plots over the 2011–2019 period.

For M. micrantha, we recorded a decrease in density in c. 46% of the plots, while the species newly invaded 23% of the resampled plots. During the 8 years, the abundance of M. micrantha increased in 29% of the plots (16% moderate increase and 13% high increase), while there was no change in its density in two plots (Fig. 2).
Environmental determinants of invasive species abundance
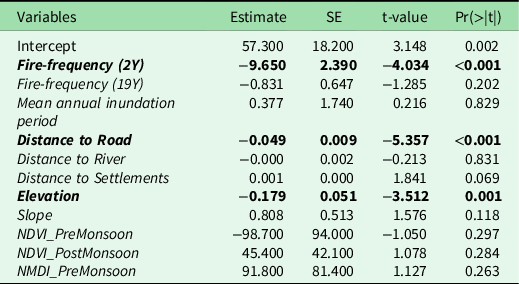
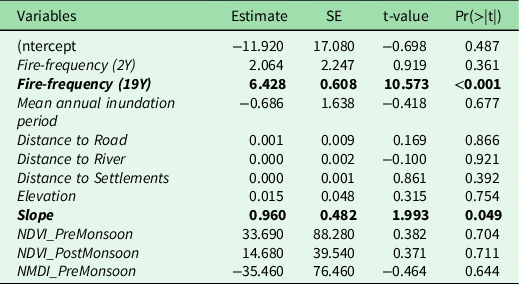
Multiple regressions of invasive species density in 30-m plots with the corresponding environmental predictors (11 variable) were statistically significant for both C. odorata (adjusted R2 = 0.499, n = 107, p < 0.001; Table 1) and M. micrantha (adjusted R2 = 0.738, n = 107, p < 0.001; Table 2). Three variables (distance to the nearest road, fire frequency in the last 2 years and elevation) showed significant predictive power for C. odorata abundance, with negative coefficients for all three predictors (Table 1). For M. micrantha, the fire frequency over 19 years and slope had significant influences on species abundance, with positive coefficients for both predictors (Table 2).
Multiple regression of Chromolaena odorata abundance per 30-m plot for 107 plots as a function of environmental variables. Fire-frequency (number of events per 500m cell) was computed for the recent (last 2 years (2Y)) and over the long term (last 19 years (19Y)) using remotely sensed data. Mean annual inundation period was the number of months in a year a 30-m pixel was recorded as having standing water. The mean was computed over the 5-year period from 2015 to 2019. Distance to Road and Distance to River were computed as the distance of each 30-m pixel to the nearest road or river. Distance to Settlements was computed as the distance of each 30-m pixel to the southern boundary of the park. Elevation and Slope were computed for each 30-m pixel from Terra Advanced Spaceborne Thermal Emission and Reflection Radiometer (ASTER) Digital Elevation Model (DEM) Ver. 3 data. The NDVI_PreMonsoon and NMDI_PreMonsoon values were monthly means taken for February or March depending on data quality, and NDVI_PostMonsoon was the mean for November. Statistically significant variables are indicated in bold. See Appendix S1 for further details.

Multiple regression of Mikania micrantha abundance per 30 m plot for 107 plots as a function of environmental variables. The variables are explained in Table 1. Statistically significant variables are indicated in bold.

Invasive species distribution and abundance and infestation risk mapping
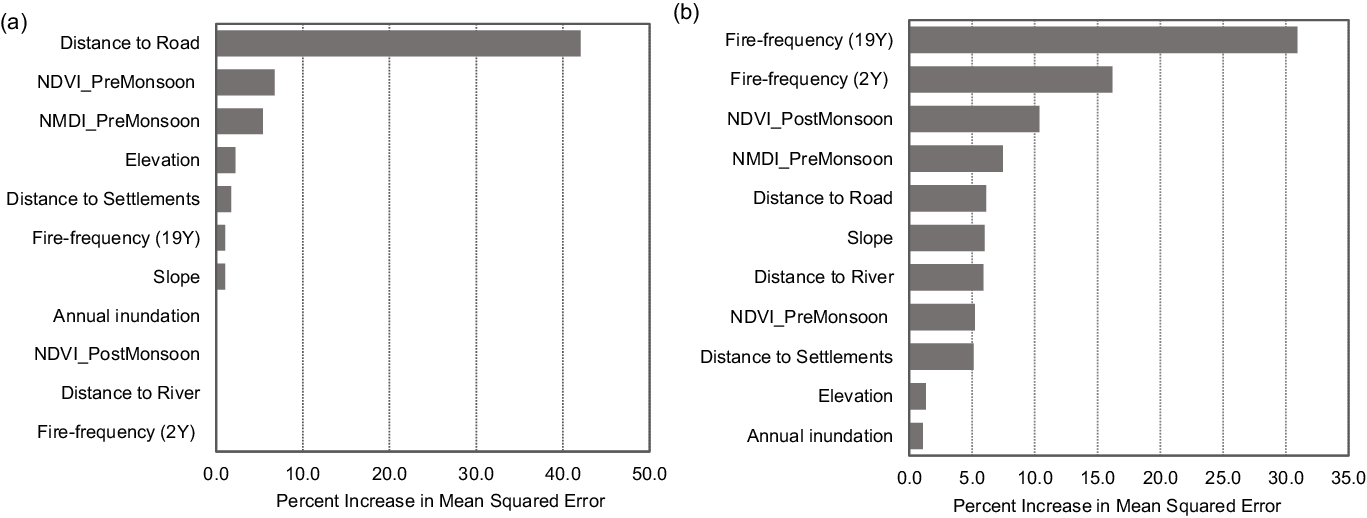
In the RF regression, several environmental variables showed statistically significant explanatory power in describing the variation in invasive species abundance. For C. odorata, the RF regression yielded R2 values of 67.08% for the training data and 54.53% for the testing data. According to the variable importance analysis, distance to the nearest road was the most important predictor of C. odorata abundance, with a 42% increase in the MSE of the regression when it was excluded as a predictor. Variable importance (Fig. 3a) was much lower for all other variables, with only pre-monsoon NDVI (8%) and dry season NDMI (7%) showing >5% losses of explanatory power when excluded.
The variable importance plot for (a) Chromolaena odorata and (b) Mikania micrantha obtained from random forest regression. The numeric axis indicates the percentage increase in mean squared error upon dropping the given variable from the regression. The variable descriptions are given in Table 1. The variable Mean annual inundation period is shown here as Annual inundation for brevity. For C. odorata, dropping some variables had negligible and inconsistent impacts on mean squared error, so they are not shown.

The density of M. micrantha also varied significantly with the environmental predictors (RF regression R2 values of 68.76% for the training data and 52.06% for the testing data). Long-term fire impact (Fire-frequency (19Y)) was the most important predictor, with an over 30% increase in the MSE of the regression when it was dropped from the list of predictors. Two other variables, density of recent fire events (Fire-frequency (2Y); 17%) and NDVI post-monsoon (11%), showed >10% increases in the MSE when excluded, while several other variables showed >5% increases in the MSE when excluded (Fig. 3b).
We used the fitted RF regression model for the spatial prediction of C. odorata and M. micrantha abundances in the MNP landscape. The predicted raster map at 30-m resolution for C. odorata density shows high densities along the roadsides within MNP. The forested northern part of MNP also exhibited high infestation and therefore represented a high-risk zone for the intensification of C. odorata invasion (Fig. 4a). The infestation or risk map of M. micrantha density across the park shows relatively high densities in the grassland areas of the eastern zone and the central part near the southern boundary, covering more than half of the area of MNP (Fig. 4b). The forested northern part had lower M. micrantha density than the other areas.
The predicted density risk maps for (a) Chromolaena odorata and (b) Mikania micrantha in Manas National Park obtained from random forest regressions and predictions. The numbers indicate the expected number of clumps per 30-m pixel in the landscape. The density map for M. micrantha has a visibly larger pixel size because the strongest predictors were the two Fire-frequency variables, and these variables were computed for 500-m pixels. Although these predictors were downscaled to 30 m to achieve parity with the other predictors, this is a trivial downscaling because all of the 30-m pixels within a 500-m pixel have the same value.

The association of invasive species with native plant diversity
In the invaded and non-invaded quadrats, we found a total of 79 plant species (excluding C. odorata and M. micrantha) from 44 families. Segregating invaded from non-invaded quadrats yielded a cumulative number of 70 plant species in non-invaded quadrats and 68 species in invaded quadrats. Of these, 57 species were shared between the non-invaded and invaded quadrats, while 11 species were only found in invaded quadrats and 13 species were only found in non-invaded quadrats. Despite comparable cumulative numbers of species in invaded and non-invaded quadrats, there were statistically significant differences in species richness between the two classes for both C. odorata (t = 8.80, n = 21, p < 0.0001) and M. micrantha (t = 2.72, n = 23, p = 0.0124). The average species richness values in quadrats with and without C. odorata invasions were 7.6 and 10.1, respectively (Table S1), whereas these values for M. micrantha were 7.9 and 9.2, respectively (Table S2). The Shannon diversity index (H') values were 1.507 and 1.675 in quadrats with and without C. odorata invasion, respectively (Table S1), and 1.486 and 1.554for M. micrantha invasions, respectively (Table S2).
Discussion
C. odorata increased in abundance in almost half of the resampled plots, it invaded multiple plots where it was not found during the initial survey and it was present in a substantial fraction of the newly surveyed plots. M. micrantha also increased its abundance in some plots and had newly invaded a few plots. Although M. micrantha had declined in abundance in some plots, it was still present in all of these plots and was not lost in any of the resampled plots. These findings strongly indicate the persistence and proliferation of these two invasive species in MNP. The plots where M. micrantha decreased in density were also those that experienced very few or no fires during the 8 years, which suggests that fire may operate as a stressor for native plants in moist environments and allow invasive species to expand. Conversely, native species populations appear to recover in the absence of persistent burning (Alpert et al. Reference Alpert, Bone and Holzapfel2000).
The strong relationship of C. odorata abundance with proximity to roads did not come as a surprise, as we often observe high densities of the species near the edges of roads and steady declines away from these roads to the interior. Roadside habitats are frequently disturbed by maintenance operations (e.g., removal of ground vegetation), but edge effects and the connectedness of road networks may also favour the spread of invasive species (Adhikari et al. Reference Adhikari, Tiwary and Barik2015, Nath et al. Reference Nath, Sinha, Lahkar and Brahma2019). Roadways create habitat edges and pathways for the spread of invasive plant species (Neubert & Parker Reference Neubert and Parker2004), and the seeds of invasive species are known to be transferred over short or long distances by motor vehicles passing through PAs (Von Der Lippe & Kowarik Reference Von Der Lippe and Kowarik2007). The relatively low prevalence of M. micrantha along roadsides is intriguing given that roadside openings and disturbance tend to promote invasive species. Competitive interactions with C. odorata could be a possible reason for this observation (Qin et al. Reference Qin, Zheng, Valiente-Banuet, Callaway, Barclay and Pereyra2013), but we also found that in MNP M. micrantha is typically found creeping on grass and tree canopies and seldom on open ground. This may explain in part why the species is less abundant along roadsides compared to C. odorata (Qin et al. Reference Qin, Zheng, Valiente-Banuet, Callaway, Barclay and Pereyra2013), as the vegetation canopy is absent or sparse along roadsides.
Among all of the environmental variables, fire has been most frequently invoked to explain the spread of invasive species, and in our case it is also considered a prominent ecological factor that shapes Terai grassland and savanna ecosystems. However, we do not have long-term historical data to link the spread of invasive species with fire in Terai ecosystems. The presence and distribution of fire itself are mostly known from remote sensing satellite data, and these data are only available for the last two decades (Takahata et al. Reference Takahata, Amin, Sarma, Banerjee, Oliver and Fa2010, Banerjee et al. Reference Banerjee, Das and John2021). Our field observations and data indicate that M. micrantha is not negatively affected by fires and continues to show a high reproductive rate. Preliminary data (unpublished) from our experiments on flammability show that M. micrantha is among the least flammable of plants. It retains a high moisture content during the dry season, and even the dried plant material does not ignite or burn easily. Therefore, periodic vegetation burning that is prevalent in the Terai lowland grasslands might indirectly aid the spread of M. micrantha by supressing more susceptible native species. Our study shows that high fire incidence on these decadal timescales has a significant positive influence on M. micrantha abundance. For C. odorata, on the other hand, the multiple regression model showed that it was negatively impacted by greater occurrence of fires over the short term (2 years), which might be due to the destruction of invasive plants by recent fires. In the long run, however, fire is known to promote invasion by this species (te Beest et al. Reference Cromsigt, Ngobese and Olff2012).
Hydrological and topographical attributes may affect invasibility at fine scales, so we studied the influence of the duration of inundation, elevation and slope on invasive species abundance. These attributes only had weak influences on the abundance of the two invasive species. Our multiple regression results showed that elevation has a significant negative influence on C. odorata and that terrain slope positively influences M. micrantha abundance. However, RF analyses showed that elevation and slope had negligible influences on these two species. The satellite-derived drought index (NMDI) for the dry season also showed a negligible influence, so we have no evidence that variation in these attributes affects invasive species density at these scales. We also expected to find a significant negative relationship between the density of native vegetation (as captured by NDVI) and M. micrantha density, but the multiple regression model did not reveal such a relationship for either species. However, dropping post-monsoon NDVI as a predictor of invasive species abundance from the RF regression increased the MSE of the model substantially. There are differences in the statistical inferences that can be drawn from the multiple regression and RF regression, and we argue that these are largely because multiple regression is a strictly linear model while RF is not, being based on an ensemble of decision trees. As a result, the decision boundary built in the RF model is not a linear function of the important variables.
We could only test the association of invasive species with the native plant community structure in a small number of paired quadrats, but the results show clear and significant patterns. The cumulative numbers of native plant species are comparable in non-invaded and invaded plots, but in pairwise comparisons native plant diversity was consistently lower in invaded quadrats. This result is open to interpretation regarding the important causal relationship – do plant invasions lead to a reduction in native plant diversity or do decreases in native plant diversity due to other factors facilitate greater invasion? Further experimental studies are needed to distinguish these two possibilities, but our results add to the knowledge on the determinants of invasive species distributions from the Terai landscape, having relevance to other parts of the world as well (Hejda et al. Reference Hejda, Pyšek and Jarošík2009, Agboola & Muoghalu Reference Agboola and Muoghalu2015, Thapa et al. Reference Thapa, Kaewchumnong, Sinkkonen and Sridith2016, Bhatta et al. Reference Bhatta, Joshi and Shrestha2020). The small dataset of just 23 data points is a limitation for comparative analyses, and more comprehensive data are needed for a rigorous test of the possible reciprocal effects between plant invasions and native plant diversity.
Our study provides forest managers with the most up-to-date invasive species risk or infestation maps for C. odorata and M. micrantha in MNP. Monitoring and controlling invasive alien species in predicted high-risk zones will be critical for habitat management. The maps can assist in locating and investigating regions that have seen recent expansions. In the Terai region, PA managers often practise manual uprooting to control invasive species (Ghosh Reference Ghosh2015, Sinha et al. Reference Sinha, Nath, Lahkar, Brahma, Sarma and Swargowari2022), and they use fire to control these species. It is very likely that fire acts as a stress factor for native plants in moist environments. Therefore, the suppression of native species combined with the high density of propagules of invasive species can lead to rapid expansion of invasive species’ range and abundance, particularly in the moist and swampy sites of the Terai. Burning can only help if the propagules in the soil are also killed. Manual uprooting of the plants before flowering and seed set may be effective but is impractical at large scales. Nevertheless, manual uprooting has been used for control in specific, high-density sites such as roadsides and swamps. A combination of manual uprooting and controlled burning may be a simple way forward until more sophisticated methods are devised. This has been successfully applied for controlling C. odorata (see te Beest et al. Reference Cromsigt, Ngobese and Olff2012), but it requires careful calibration of burning practices based on site conditions. Frontline workers in PAs should be informed about the ecology and impacts of invasive plants so that the methods employed for containing them can be monitored and modified for the management and possible eradication of these harmful species.
Supplementary material
To view supplementary material for this article, please visit https://doi.org/10.1017/S0376892923000024.
Acknowledgements
We thank the Assam Forest Department and Durrell Wildlife Conservation Trust for their support through field visits. We also want to thank Mr Dwipendra Dev and Mr Amal Deka for helping us to carry out fieldwork at Manas National Park.
Financial support
This work was supported by Grant No. EMR/2017/002769 awarded to RJ by SERB-DST, Government of India, and Rufford Small Grant No. 21980-1 awarded to SB by the Rufford Foundation.
Competing interests
The authors declare none.
Ethical standards
None.