I. INTRODUCTION
Test and commercial-level fusion reactor designs contain materials to fuel the fusion reaction (e.g., deuterium and tritium) as well as materials to confine the reaction, which can include both the magnetic confinement components and the plasma-facing walls (first wall and diverter). Reference El-Guebaly, Aasen and Olsson1 For these walls or plasma-facing materials (PFMs), considerable effort has gone into their evaluation given that they must endure impacts from a wide range of radiation sources: neutrons, alpha particles, electrons, ions, and electromagnetic radiation (IR, UV, visible, and x-ray). Reference Federici, Skinner, Brooks, Coad, Grisolia, Haasz, Hassanein, Philipps, Pitcher, Roth, Wampler and Whyte2 For ions, this evaluation has focused primarily on their role in the sputtering of material away from the wall, which can inject impurities into the fusion plasma or trap fuel components within redeposited wall layers. Sputtering of PFMs, however, is an inherently above-surface aspect of the ion–target interaction, and it ignores routes for the below-surface energy deposition by the ions. Although subsurface energy deposition does not directly influence the fusion reaction, the overall energy budget of the PFM and its ability to withstand thermal cycling must account for this route of energy transfer.
For singly charged ions, subsurface energy deposition has been extensively studied and can be reliably calculated using stopping power (S(E)) formulations which, depending on the ion velocity, manifest as either nuclear stopping (S n(E)) or electronic stopping (S e(E)). The readily available code SRIM (Stopping and Range of Ions in Matter) incorporates this route effectively and can be configured for most ion–target combinations. Reference Ziegler, Ziegler and Biersack3 In a man-made fusion reaction, however, other ion charge states will appear, much as they do in the natural fusion reactions of the stellar environment. Reference Savage, Sembach, Jenkins, Shull, York, Sonneborn, Moos, Friedman, Green, Oegerle, Blair, Kruk and Murphy4–Reference Ayres, Brown, Osten, Huenemoerder, Drake, Brickhouse and Linsky6 A significant amount of the energy transported by these ions can shift, as a function of charge state Q, from the ion's kinetic energy to its potential energy. The dissipation of an ion's potential energy upon impact with a PFM is not a simple process, as it can begin well outside the target material through electron transfer and secondary deexcitations (electron and photon) and can continue as the ion penetrates the target and slows in the subsurface region. Significant postmortem analysis has focused on the above-surface components of this energy dissipation, looking at surface feature formation and sputtering. Reference Aumayr, Burgdorfer, Hayderer, Varga and Winter7–Reference Sporn, Libiseller, Neidhart, Schmid, Aumayr, Winter, Varga, Grether, Niemann and Stolterfoht15 Similarly, the above-surface charge exchange component has been successfully treated through the so-called over-the-barrier model. Reference Niehaus16–Reference Vancura, Marchetti, Perotti and Kostroun20 Below the surface, however, little data or theoretical treatments exist, and those that do point to a Q-dependent role for the ion stopping which has not been explored in depth. Reference Biersack21–Reference Schenkel, Hamza, Barnes and Schneide23
In the work presented here, we seek to demonstrate that semiconductor device platforms can be utilized to track subsurface energy deposition by ions, in particular for multiply charged ions (MCIs). Semiconductor devices have a long history in radiation effects testing, which was indirectly initiated by U.S. and Soviet high-altitude nuclear detonation tests in the early 1960s. These nuclear tests led to the failure of a communications satellite, Telstar I, whose onboard transistor operation had been altered by the increased levels of radiation. Ground-based efforts at understanding this failure led to a successful repair scheme that involved modifying the bias protocol for the satellite's onboard transistors. While the satellite ultimately failed due to further radiation exposure, the experience contributed to a shift from the traditional approach of making radiation-effect studies on bulk properties of semiconductor materials and devices toward directed efforts at understanding the effects of radiation on the operational characteristics of these devices.
For satellite systems, the move in technology from bipolar transistors to metal–oxide–semiconductor field effect transistors (MOSFETs) also shifted the emphasis on radiation effects studies. Metal–oxide–semiconductor (MOS) devices in particular were found to be a powerful tool to study the effects of radiation. For example, changes observed in the MOS capacitor threshold and flatband voltages led to the conclusion that the major effects of radiation on these devices were the buildup of positive charge in the oxide which was able to drift under an applied electric field. By examining silicon-based MOS structures under many types of radiation (Co60 γ rays, low-energy electrons, high-energy electrons, ultraviolet rays, and x-rays), it was concluded that any ionizing radiation with an energy greater than the band gap of SiO2 (∼8 eV) leads to the buildup of positive space charge within the oxide and the creation of interface states at the oxide/semiconductor interface.
While MCIs can be more accurately described as “ionized radiation”, they too can generate electron–hole pairs and lead to charge buildup within a MOS structure. In the following sections, we describe an experimental setup aimed at tracking the dependence of ion-induced radiation effects on the ion energy and charge state for embedded insulators within MOS devices. We use both singly charged and multiply charged ions for this study, with the MCIs coming from a new electron beam ion trap (EBIT) ion source at Clemson University. As shown in these data, there occurs within an irradiated MOS structure a spatially dependent shift in the capacitance–voltage (C–V) signature that is correlated with the current density profile of the incident ion beam. These results are consistent with internal radiation damage inflicted by the ions, and by tracking this damage for different energies and charge states, we find that the MOS can record the subsurface component of the kinetic and potential energy dissipation for incident ionic radiation.
II. EXPERIMENT
We have probed radiation damage in oxides due to low-energy ion impacts by measuring capacitance–voltage (C–V) characteristics of MOS devices. Specifically, we have irradiated as-grown oxide-on-semiconductor samples (SiO2/Si) and then encapsulated them postirradiation with metal dots to fabricate MOS devices (Al/SiO2/Si). Irradiations of the oxides focused on separate investigations of ion kinetic energy effects for focused beams of singly charged ions in the few keV range and the ion potential energy effects for MCIs with a fixed kinetic energy. Below, we describe our multistep sample fabrication–irradiation–encapsulation procedure and present the details of the irradiation and characterization techniques used.
A. Fabrication
Raw materials (3-inch p-type Si <100> wafers) were purchased from Silica-Source, Inc. with resistivities of 1–10 Ω cm. Prior to the SiO2 oxide growth, these wafers were cleaned to remove any organic surface contaminants. The cleaning procedure was a standard RCA clean (1:1:5 solution of NH4OH + H2O2 + H2O) for five minutes under ultrasonic agitation. The cleaned surface was then etched with dilute 1% HF for two minutes to remove any native oxide followed by a triple rinse in deionized water for a total of six minutes. A thick oxide layer was grown on these cleaned wafers in an oxidation furnace at 1000 °C under steam flow. For the singly and multiply charged ion irradiations, the oxide thicknesses were 1900 Å (1887 Å ± 43 Å) and 1750 Å (1746 Å ± 41 Å), respectively. Following the oxide layer growth, a metal film was deposited on the backside of the wafer as an Ohmic contact. The Ohmic contact deposition involved etching the wafer backside with 1% HF solution to remove any native oxide and then growing a 0.5 µm Al contact using a thermal evaporator. The contact was sintered at 450 °C in a nitrogen environment. The completed wafers were diced into 12 mm square samples to conform to the sample mounting requirements of our ion beamline setups.
B. Singly charged ion irradiation
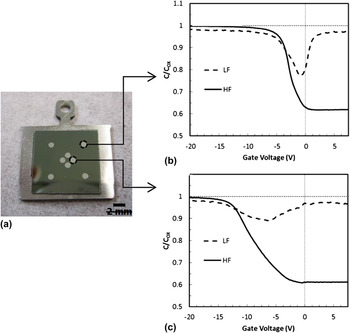
Singly charged Na+ ions were used to irradiate the 1900 Å SiO2 samples at kinetic energies of 1–5 keV to investigate MOS device sensitivity to kinetic energy induced damage. The ion source and beamline used to carry out these irradiations are described in detail elsewhere. Reference Ray, Lake, Moody, Magadala and Sosolik24 Briefly, the Na+ ions were obtained from an aluminosilicate emitter (Heatwave Labs, Inc.) by thermionic emission which was mounted in a custom-built ion source. The SiO2 samples were mounted in the beamline just beyond the ion source section on a translator that was custom-designed for these irradiations. The sample mount included a plate with two holes of 0.25″ diameter which could be moved into the path of the beam. The first hole on the plate served as a mask for the irradiation, with the sample mounted directly behind it. The second hole served as an initial focus point for the beam, where the ion source's einzel lens and Wien filter were used to focus the ion beam into a Faraday cup mounted behind the plate. During initial setup, a beam viewer was temporarily placed in the Faraday cup position to determine the spatial profile of the ion beam. A circular current density profile which approximately matched the diameter of the focusing aperture within the sample plate was obtained in this way. The total beam current was ∼5 nA and the on-sample doses for the irradiations were in the range of 6 × 10¹² to 8 × 10¹² ions/cm2. The pressure in the source and beamline during these irradiations was 5 × 10⁻⁷ Torr. Following each irradiation, the SiO2 target was removed from the beamline so that MOS top contacts of Al could be deposited in a thermal evaporator. We note that the deposition, which occurred at a pressure of 5 × 10⁻⁶ Torr, led to a sample frontside temperature no higher than 80 °C, as based on prior characterization measurements. For these depositions, a custom-built mask was used which placed four Al top contacts in the central, irradiated region and four Al top contacts in the corner, unirradiated regions of the target, as shown in Fig. 1(a). The diameter of the metal dots is 1 mm, and the dots in the central, irradiated region are placed symmetrically at a distance of 1 mm from the center.
(a) A diced, oxidized Si sample mounted on an Omicron-style sample holder showing four central (irradiated) and four corner (unirradiated) MOS devices. (b) HF and LF capacitance–voltage (C–V) curves for an unirradiated device. (c) HF and LF C–V curves for a device encapsulating an oxide layer irradiated by 3 keV Na+ ions.

C. MCI irradiation
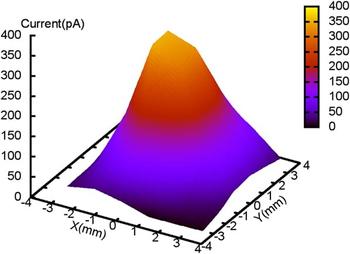
Irradiations of the 1750 Å SiO2 samples by MCIs were carried out in the CUEBIT facility at Clemson University, which is described in detail in Ref. Reference Shyam, Kulkarni, Field, Srinadhu, Cutshall, Harrell, Harriss and Sosolik25. For these irradiations, the SiO2 targets were exposed to the focused beams of Ar Q+ with charge states of Q = 1, 4, 8, and 11. The potential energy of these ions, which is the sum of the ionization energies of the electrons that have been removed from the neutral Ar atom, varies from 15 eV (Q = 1) to 2004 eV (Q = 11). During the irradiation process, the targets were load-locked into the target region of the CUEBIT beamline (base pressure 1 × 10⁻⁸ Torr). Argon ions of the desired charge state were selected by an analyzing dipole magnet and then transported down the beamline to the target area for the irradiation. As the cross-section for charge transfer for MCIs is three to four orders of magnitude higher than that for singly charged ions, the pressure in the beamline was maintained in the low 10−9 Torr range to avoid neutralization during transport. Space charge spreading of the beam was also avoided by floating the beamline to a transport voltage (−3 kV) and then decelerating the ions at the entry point to the target chamber using a custom-designed deceleration lens (Dreebit, GmbH). The kinetic energy for all of the incident charge states was fixed at 1 keV. Beam currents at the target position were measured using a Faraday cup mounted in the sample plane and were found to vary for different charge states from tens of pA for Q = 11 to ∼100 pA for Q = 4 and Q = 8. As in the singly charged ion irradiations, beam profiles, like the one shown in Fig. 2, were obtained using a beam viewer (HRBIS-4000 from Beam Imaging Solutions) as well as a Faraday cup.
Typical beam profile for Ar Q+ irradiation (Q = 8 is shown).

To isolate the radiation damage dependence on charge state or potential energy, the dose dependence for each charge state was recorded across multiple exposures with doses ranging from 5 × 10¹¹ to 5 × 10¹² ions/cm2 for Q = 4, 8, and 11 ions. One control point for singly charged Ar (Q = 1) ions was also recorded. The listed dose range was chosen based on those used in the singly charged Na+ work, both for comparison and to avoid saturating the MOS device flatband response. Following each irradiation, top metal contacts were deposited on the sample by moving the sample from the target region and into a thermal evaporator. A 5 × 5 grid of Al dots, each with a diameter of 1 mm and a center-to-center distance of 2.5 mm, was deposited on the sample to complete the fabrication of the MOS devices.
D. Device characterization
Both the singly charged ion and MCI irradiation–encapsulation steps produced samples that contained multiple MOS devices. These spatially separated Al-capped regions represented pristine and irradiated regions of the targets which were characterized using C–V measurements. High-frequency (HF) and low-frequency (LF) C–V measurements were carried out on all samples, and Figs. 1(b) and 1(c) show typical C–V curves for pristine and irradiated devices, respectively. Details about the C–V data are discussed in detail in the following sections, and here, we mention only the details specific to the C–V measurement technique. A micromanipulator probe station connected to a HP4280A for HF measurements and a HP4140B for LF measurements was used to obtain the C–V characteristics of each individual MOS device. Each sample was loaded on the chuck of the micromanipulator, where the backside Ohmic contact was connected through suction provided by a small vacuum pump. The top Al contact was connected using a probe tip mounted on the manipulator. A characteristic C–V curve was recorded for each device on a sample, and shifts in the curve shape were found to correspond to the level of irradiation damage at that position on the sample. To quantify these curve shifts, the flatband voltage (V FB) was determined for each sample, where V FB was calculated based on the average doping concentration of the underlying Si substrate (5 × 1016 cm−3) as described in Ref. Reference Shyam26. The difference in flatband voltages (ΔV FB) taken relative to a pristine (unirradiated) device/sample region was tracked for different samples across dose and charge states explored in these measurements.
III. DISCUSSION
Here, we discuss separately the two measurements performed for irradiations of thick SiO2 by singly or multiply charged ions, looking at the kinetic energy dependence and the potential energy dependence of the results, respectively.
A. Singly charged ion irradiation
For the irradiations performed with singly charged ions, the 1900 Å oxide samples were exposed to well-defined beams of Na+ ions as described above. Each SiO2/Si sample was then capped with Al metal dots to form finished MOS devices that were C–V characterized. For these measurements, variations in the C–V curves are taken as the recorded shift in the flatband voltage, ΔV FB, which is determined relative to a reference or unirradiated result.
The flatband value, V FB, was chosen as a standard comparison point for these measurements as it is a universally accepted reference point on the C–V curve of MOS devices. Reference Nicollian and Brews27 Physically, V FB corresponds to the point where, for an ideal system, the gate voltage equals the work function difference between the Al gate and the Si substrate. In this case, an ideal pristine device of Al and Si would have a V FB value of −0.8 V; however, in our pristine devices a value of −3.8 V was obtained for V FB across all samples. This shifted value can be attributed to charge trapping which occurs during the device fabrication. Quantitatively, a flatband shift of −3.8 V for the unirradiated devices relative to the ideal value (−0.8 V) corresponds to a trapped charge concentration of approximately 3.43 × 1011 cm−2 at the oxide–semiconductor interface, which is considered an acceptable value for the thick oxides utilized here.
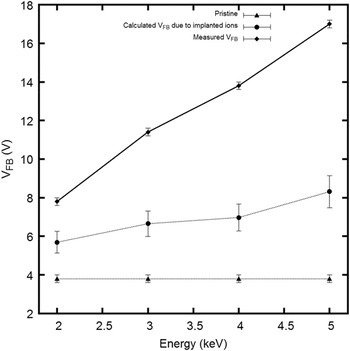
For the irradiated samples, the masked areas at the sample corners produced MOS devices which gave V FB values of −3.8 V, indicating that they were pristine or unirradiated in those positions. In contrast, the central sample areas gave MOS devices whose V FB values were consistently shifted to more negative values, indicating shifts induced by the ion irradiation at those positions. Figure 3 shows the V FB values as well as the shifts or ΔV FB values obtained for the irradiated MOS device positions on the samples as a function of the incident kinetic energy of the Na+ ions. The observed trend is approximately linear in energy for the dose and energy ranges in this study.
Measured flatband voltages (V FB) for pristine and irradiated MOS devices, plotted with respect to the incident energy of the Na+ ions. The expected contribution of the implanted Na+ ions on the overall flatband is also plotted and was determined using the experimental ion dose and device area along with depth profiles obtained from SRIM. Reference Ziegler, Ziegler and Biersack3

Before considering the role of kinetic energy dissipation for the observed ΔV FB trend in these Na+ results, it must be noted that alkali ions, in general, are considered to be an “ionized impurity” within SiO2. Therefore, the presence of these ions in the subsurface region can lead to a measurable shift in V FB relative to a pristine device unexposed to Na+ ions. To account for this possibility, we calculated the V FB shift that would be introduced by the Na+ ions, assuming that they were distributed in the SiO2 layer at implantation depths given by SRIM. Reference Ziegler, Ziegler and Biersack3 For the kinetic energy range used here (2–5 keV), the ions are implanted at a mean depth ranging from 6 to 12 nm, respectively, which is confined to the top 5% of the oxide layer. Therefore, the ions account for no more than 25% of the measured shift in V FB and these results are included in Fig. 3.
After accounting for the possibility of an ionic impurity component in the V FB shift, it is clear that the remaining shift and observed linear trend with respect to kinetic energy are directly attributable to the loss of kinetic energy by the stopped Na+ ions within the SiO2 layer. Microscopically, this can be considered as reflecting the energy lost per unit length by the ions as they travel through the layer, which is defined as the stopping power (S(E) = −dE/dx). While stopping power is traditionally divided into two components: nuclear stopping and electronic stopping, it is not immediately clear that our measurements can distinguish between them. However, if we focus on the known fact that a MOS-encapsulated oxide is sensitive to electron–hole pair excitations above a certain threshold then we can assume that electronic stopping of the ions is the most probable route to those excitations. For SiO2, the threshold energy required to create an electron–hole pair is 18 eV Reference Ausman and Mclean28 and the transport of electron–hole pairs induced by radiation energy losses is well described by the columnar recombination model. Reference Oldham and Mclean29–Reference Oldham31 This model is represented as
 $${{\partial {n_ \pm }} \over {\partial t}} = {D_ \pm }{\nabla ^2}{n_ \pm } \mp {\mu _ \pm }E{{\partial {n_ \pm }} \over {\partial x}} - \alpha {n_ - }{n_ + }\quad {\rm{,}}$$
where n ± represents the hole (+) or electron density (−) and the terms on the right-hand side are, from left to right, the diffusion term, the drift term, and the recombination term. D represents the diffusion constant, µ is the mobility of carriers (µ− = 40 cm2/V s and µ+ = 10−11 cm2/V s) in SiO2, E is the applied/internal field, and α is the recombination coefficient. For our measurements, we first note that the mobility of electrons is much higher than that of holes. Therefore, we can assume a process where recombination can take place initially with surviving electrons being swept away into the semiconductor substrate. Considering that we are not applying a gate voltage, we can neglect the electric field term in the model and arrive at a uniform distribution of holes in the oxide.
Looking at our data, we can then interpret our measured ΔV FB as a representation of a hole distribution within the oxide and we can calculate an “experimental” density of holes (N H-EXPERIMENTAL). Here, we simply adapt the standard formalism for the flatband shift in a MOS device and assume that the entire hole concentration is represented by a charge sheet centered at half the depth of the oxide, which gives
 $${N_{{\rm{H - EXPERIMENTAL}}}} = {{2 \times \Delta {V_{{\rm{FB}}}} \times {C_{{\rm{ox}}}}} \over e}\quad {\rm{,}}$$
where C ox is the maximum capacitance of the oxide per unit area and e is the electron charge.
Using SRIM, we can compare with N H-EXPERIMENTAL by calculating the energy lost to electronic stopping in the oxide and converting that value to an expected density of holes. To do so, we obtain a theoretical hole density (N H-SRIM) due to the energetic ions as
 $${N_{{\rm{H - SRIM}}}} = {{{\it{D}} \times {\mathop{\rm d}\nolimits} E/{\mathop{\rm d}\nolimits} x} \over {18}} {{\int\limits_0^{{x_{{\rm{ox}}}}} {G(\mu ,\sigma ) \times x} {\mathop{\rm d}\nolimits} x} \over {\int\limits_0^{{x_{{\rm{ox}}}}} {G(\mu ,\sigma )} {\mathop{\rm d}\nolimits} x}}\quad {\rm{,}}$$
where D is the dose (ions/cm2), and dE/dx is the electronic loss (units of eV/Å) obtained from SRIM calculations. A Gaussian distribution of holes obtained from SRIM (G(µ,σ)) is also included and is weighted by the depth x to account for linear energy loss of the ions across the oxide thickness, x ox.
By comparing the experimental and theoretical yields for holes, we define the fractional yield of holes that have survived the initial recombination step as
 $$f(E) = {{{N_{{\rm{H - EXPERIMENTAL}}}}} \mathord{\left/ {\vphantom {{{N_{{\rm{H - EXPERIMENTAL}}}}} {{N_{{\rm{H - SRIM}}}}}}} \right. \kern-\nulldelimiterspace} {{N_{{\rm{H - SRIM}}}}}}$$
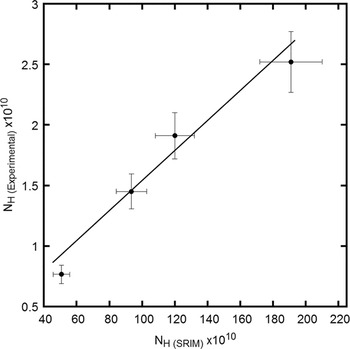
Figure 4 shows this fractional yield as the slope of a linear fit to the plot of N H-EXPERIMENTAL versus N H-SRIM. The value obtained is 0.0124, which is comparable to the fractional yield for holes within SiO2 obtained using different forms of radiation excitation. Reference Oldham and McGarrity30
Hole density determined experimentally from C–V flatband shifts (ΔV FB) versus the predicted hole density using SRIM and expected ion energy loss. The slope represents the fractional yield, f(E).

We note that annealing of our irradiated samples at 200 °C in the presence of a bias removed the observed shifts in V FB, leading to a full recovery of pristine V FB voltage values. This is clear evidence that the subsurface energy loss of the ions causes reversible damage in the SiO2 layer in the form of trapped charge. This has been observed in other radiation studies of MOS devices Reference Fleetwood, Reber, Riewe and Winokur32 and can be explained by the thermally initiated release and subsequent neutralization of the trapped charge in the oxide.
B. MCI irradiation
As with the singly charged ion irradiations, our MCI data consisted of C–V results obtained after individual SiO2/Si samples were irradiated, encapsulated, and probed through multiple Al/SiO2/Si devices that had been deposited on each sample. Specifically, we have irradiated 1750 Å thick SiO2 layers with Ar Q+ ions (Q = 1, 4, 8, and 11) at a fixed kinetic energy of 1 keV.
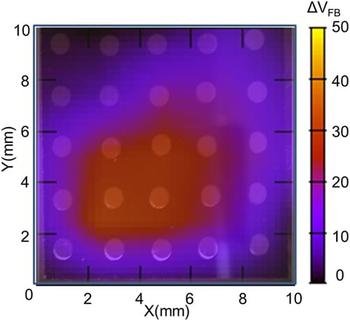
To accommodate the target chamber requirements of CUEBIT, no mask was used during these MCI irradiations. Instead, the entire sample was exposed to the beam and then capped with a larger grid of metal dots as shown in Fig. 5. The C–V results, expressed as ΔV FB, are also shown in Fig. 5, plotted as a function of position for a single sample. It is clear from this figure that the ΔV FB values are spatially varying and that this variation is consistent with the typical spatially resolved intensity of the MCI beam such as the example in Fig. 2. To compare these observed shifts in V FB on any given sample to the respective fluence used to dose that sample, an across-sample average was calculated. Additionally, in calculating the fluence for each sample, a correction for Faraday cup area, which was used to measure the dose, was applied. In general, a two-dimensional Gaussian function can be used to fit the beam profiles, and by extension, the observed spatially varying ΔV FB results. The average shift in ΔV FB across the sample was calculated as
 $$\Delta {V_{{\rm{FB}},{\rm{avg}}}} = {{\int\!\!\!\int {_AV({\rm{Gaussian - fit}})dA} } \over {\int\!\!\!\int {_A{\mathop{d}\nolimits} A} }}\quad {\rm{,}}$$
where V (Gaussian-fit) represents the two-dimensional Gaussian function fit to the measured ΔV FB data and A represents the area of the sample. The calculated average ΔV FB,avg corresponds to the shift that would have resulted for devices on the sample if the incident MCI beam had been spatially uniform with a flat, non-Gaussian profile. Geometrically, the definition above corresponds to the volume under the interpolated surface of the ΔV FB profile over the area of the sample, and ΔV FB,avg represents the height of a rectangular prism with cross-sectional area of the sample that would contain the same volume.
An interpolated image of the measured V FB shifts obtained from HF C–V spectra of MOS devices deposited on an Ar4+ irradiated SiO2/Si wafer (1750 Å oxide layer). Units for the color scale are volts and the positions of the deposited Al dots can be seen as circles superimposed on the interpolated image.

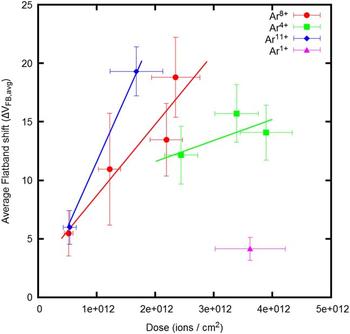
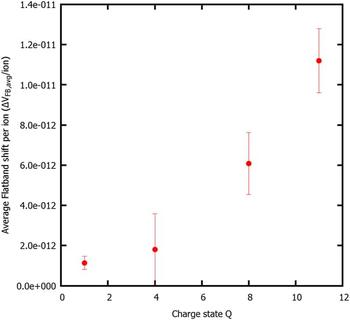
Figure 6 shows the dependence of ΔV FB,avg on fluence for different charge states. The linear dependence observed for each charge state indicates that the fluences used here are within a linear regime for radiation dosing of these devices. That is, each MCI has an independent and additive effect on the flatband shift, and the slope of these lines can be used to quantify this effect per ion. The clear differences in slopes also indicate a nonlinear charge state dependence which can be seen in Fig. 7 where the ΔV FB,avg shift per ion is plotted as a function of MCI charge state. If the shift caused by Ar1+ ions is taken as a kinetic energy control and the remaining charge states are plotted relative to this point, we obtain a power law (V FB ∼ Q 2,2) for the flatband shifts due to MCI irradiation. This near quadratic dependence of ΔV FB,avg on the charge state could be an indicator that the stopping power of MCIs depends on Q via an intrinsic power law.
Average flatband voltage shift (ΔV FB) plotted versus dose for Ar Q+ ions for charge states (Q = 1, 4, 8, and 11). The average shift was calculated from a Gaussian fit to the interpolated, two-dimensional flatband voltage image obtained from individual C–V curves.

Normalized flatband voltage shift per ion obtained from dose dependence data shown in Fig. 6 for Ar Q+ charge states (Q = 1, 4, 8, and 11).

A comparison of our result with other efforts Reference Biersack21–Reference Schenkel, Hamza, Barnes and Schneide23,Reference Schenkel, Lo, Weis, Schuh, Persaud and Bokor33,Reference Herrmann, Cocke, Ullrich, Hagmann, Stoeckli and Schmidt-Boecking34 to investigate the charge state dependence for stopping power shows that this is an open question. In particular, Herrmann et al. found no Q-dependence as described in Ref. Reference Herrmann, Cocke, Ullrich, Hagmann, Stoeckli and Schmidt-Boecking34, while Schenkel et al. have found evidence of Q-dependent stopping as described in Refs. Reference Schenkel, Briere, Barnes, Hamza, Bethge, Schmidt-Böcking and Schneider22 and Reference Schenkel, Hamza, Barnes and Schneide23. Most of these experiments involved the passage of MCIs through a thin foil and the subsequent measurement of their kinetic energy and charge. As such, the requirement of foil penetration and emergence places a fundamental limit on the kinetic energy required to pass through the foil and can be considered a nonviable method for low-kinetic energies. The nearest experiment to our subsurface result is that described in Ref. Reference Schenkel, Lo, Weis, Schuh, Persaud and Bokor33 where a difference in the range of Sb25+ and Sb1+ ions implanted in SiO2 was measured by SIMS (Secondary Ion Mass Spectroscopy) and used as a measure of enhanced stopping power within the oxide. We also note that a quadratic dependency of electronic stopping power on effective charge state has been previously used in the literature. Reference Brandt and Kitagawa35 Finally, using extensions of the theory behind the SRIM code, Biersack has predicted a Q 4 dependence of stopping power. Reference Biersack21
IV. SUMMARY AND CONCLUSIONS
The as-grown samples of SiO2 were irradiated with singly and multiply charged ions to investigate the use of C–V measurements in tracking kinetic and potential energy deposition within the subsurface region of a target material. By encapsulating irradiated oxide samples with Al contacts, spatially resolved signatures of the ionic radiation below the surface were revealed in shifted C–V characteristics. These shifts scaled linearly with the ion dose and kinetic energy. The potential energy, however, gave rise to C–V shifts that, when calibrated for dose, appear to follow a power law in a charge state with an exponent of ∼2.2. This result is at odds with prior data obtained with similar ions that had penetrated thin foils. Overall, our results indicate that MOS encapsulation and C–V measurements can serve as a method to track low-kinetic and potential energy deposition by ions into the subsurface regions of a solid.