Milk contains about 30, 20 and 10 mm calcium, inorganic phosphate and citrate, respectively. In milk, the precipitation of calcium phosphates is prevented by the presence of caseins that form stable casein micelles containing nanoclusters of micellar calcium phosphate (Holt et al. Reference Holt, Wahlgren and Drakenberg1996). However, the precipitation of calcium phosphates occurs in some dairy liquids (cheese wheys and filtrates) that are supersaturated in calcium and phosphate ions (Pouliot et al. Reference Pouliot, Landry and Giasson1991; Saulnier et al. Reference Saulnier, Ferrero, Bottero and Linden1995). Depending on the pH, temperature, ionic strength and reaction time, several crystallised calcium phosphates can form from solutions: dicalcium phosphate dihydrate (DCPD; CaHPO4·2H2O), octacalcium phosphate (OCP; Ca8(HPO4)2(PO4)4·5H2O) and hydroxyapatite (HAP; Ca10(PO4)6(OH)2) (Elliott, Reference Elliott1994). In some conditions, the formation of poor crystallised forms of HAP called calcium deficient apatite (CDA), and amorphous calcium phosphate (ACP) often encountered as transient phase, can also occur (Wang & Nancollas, Reference Wang and Nancollas2008).
However, the precipitation processes (nucleation, crystal growth and aggregation) of calcium phosphates are modified by the presence of proteins (Kumura et al. Reference Kumura, Minato and Shimazaki2006) and some salts like sodium chloride (NaCl) or organic molecules like citrate (Cit) which are naturally present in dairy products. In numerous studies, NaCl is often used for adjusting the ionic strength of aqueous solutions but its specific effect on the precipitation of calcium phosphate is little described. In contrast, several studies reported that citrate exerts an inhibitory effect on the crystallisation of calcium phosphates. Indeed, the presence of citrate inhibits the formation of calcium phosphate crystals that can serve as nuclei for the formation of kidney stones (Ashby & Sleet, Reference Ashby and Sleet1992). Citrate also plays a key role in the control of the biomineralisation process (Tang et al. Reference Tang, Darragh, Orme, Guan, Hoyer and Nancollas2005). The yield and the nature of calcium phosphates recovered from wastewaters are also altered in the presence of citrate (Van der Houwen & Valsami-Jones, Reference Van der Houwen and Valsami-Jones2001; Van der Houwen et al. Reference Van der Houwen, Cressey, Cressey and Valsami-Jones2003). However, few studies were conducted for the purpose of calcium phosphate precipitation in the presence of citrate in a dairy context (Yamamoto et al. Reference Yamamoto, Kumagai, Fujii and Yano1993, Reference Yamamoto, Kumagai, Suzaki and Arai1994; Rosmaninho & Melo, Reference Rosmaninho and Melo2006). Moreover, most of those studies were conducted under various conditions of pH, temperature and in some cases in complex systems where interference with the ions of the ionic environment could influence the characteristics of the precipitating phases.
The present study aimed to investigate the effects of NaCl (100·0 mm) and citrate (10·0 mm) on the size, crystallinity and morphology of calcium phosphates obtained from model solutions at pH 6·70 maintained constant or left to drift. The saturation indexes of the solutions with respect to different salts were assessed by calculating the ion speciation using a theoretical model developed previously (Mekmene et al. Reference Mekmene, Le Graët and Gaucheron2009a). The size distributions of the suspended particles were measured using laser light scattering. The crystalline and chemical structure of the precipitates was examined by X-ray diffraction (XRD) and Fourier transform infrared (FTIR) spectroscopy and their morphology and microstructure by scanning electron microscopy (SEM) and by transmission electron microscopy (TEM).
Materials and Methods
Calcium phosphate precipitation
In order to study the precipitation of calcium phosphate, supersaturated solutions containing calcium and phosphate ions were prepared in the absence or presence of NaCl or citrate. The precipitation experiments were performed by adding 30·0 mm calcium chloride to 19·5 mm sodium hydrogenphosphate (Sigma, Tokyo, Japan) whose pH was previously adjusted to 6·70 (these concentrations and pH are those commonly found in milk). The experiments were performed in the absence or presence of 100·0 mm NaCl or 10·0 mm trisodium citrate (Sigma, Tokyo, Japan). The initial pH (6·70) was drifting or maintained constant by the addition of NaOH (2 mol l−1) using a pH-stat system (Metrohm, 702 SM Titrino model, Herisau, Switzerland). The experiments were conducted under continuous stirring (200 rpm), at 22±0·5°C, during 3 h. The detailed experimental procedure was presented in a previous paper (Mekmene et al. Reference Mekmene, Quillard, Rouillon, Bouler, Piot and Gaucheron2009b). In the present study, the precipitation process was scaled up (final volume 400 ml) to enable further analyses on the suspensions. All experiments were performed in duplicate.
Calculation of the saturation index
Spontaneous precipitation of calcium phosphate occurs when sufficient supersaturation is reached. The saturation of the solution with respect to different calcium phosphate phases can be assessed by calculating the saturation index (SI) using the following (Eqn 1). When SI=0, the solution is in equilibrium; SI<0, the solution is undersaturated; SI>0, the solution is supersaturated. Spontaneous precipitation could occur only in this last case.

where K sp is the thermodynamic solubility product. The values considered for calculations were K sp(DCPD)=2·09×10−7 (Marshall & Nancollas, Reference Marshall and Nancollas1969), K sp(OCP)=3·98×10−49 (Tung et al. Reference Tung, Eidelman, Sieck and Brown1988) and K sp(HAP)=1·67×10−59 (McDowell et al. 1977). IAP is the ionic activity product which is calculated for the different salts as follows:



where a i is the ionic activity, calculated from the concentration C i and the activity coefficient γi of the ion (i):

γi depends on the ionic strength (I) of the solution and can be calculated from the extended Debye–Hückel formula:


A is the effective ion size parameter (nm) whose values were taken from Holt et al. (Reference Holt, Dalgleish and Jenness1981). The ionic strength (I) is calculated from the concentrations and charge number (z i) of the ionic species including free ions and ion-pairs resulting from the interactions of cations (Ca2+, Na+ and H+) with anions (Cl−, OH− and the ionised forms of phosphate and citrate) present in the solution. These interactions are mainly governed by the association constants of the different ionic species and the dissociation equilibria of phosphate and citrate as a function of pH. The association/equilibrium constants considered for calculations in the present study and the computer program used for the resolution of the system of mass balance equations were described in a previous paper (Mekmene et al. Reference Mekmene, Le Graët and Gaucheron2009a).
Particle size determination
The resulting suspensions after 3 h of precipitation were immediately analysed for their size distributions at 22±2°C by laser light scattering using a MasterSizer 2000 (Malvern Instruments, Malvern, UK). About 10 ml of sample were introduced in the circulating cell (1500 rpm) containing demineralised water. A refractive index of 1·629 and 1·333 were used for calcium phosphate particles and for the aqueous phase, respectively (Malvern guide, 1997). The size measurements were recorded as volume distributions and volume-weighted average diameters D4,3 (ISO 9276-2, 2001). Results of the particle size distribution were obtained with 2 independent samplings and three successive measurements. The mean value ±sd was given for each sample.
Filtration of the suspensions and lyophilisation of the precipitates
The suspensions were filtered (Whatman 42 filter papers) without washing to avoid possible dissolution of part of the solid. The precipitates were lyophilised (RP2 V, SGD Sérail, Argenteuil, France) and stored in sealed containers at room temperature before analyses.
Characterisation of the lyophilised precipitates using XRD, FTIR, SEM and TEM techniques
The XRD patterns were recorded using a Philips PW 1830 X-ray generator fitted with a PW 1050 (θ/2θ) goniometer and a PW 1711 Xe detector. The data were acquired using Ni-filtered copper Kα radiation in a step-by-step mode with initial 2θ=8°, final 2θ=60°, step 2θ=0·02° and time per step=1·2 s.
The FTIR spectra were obtained on a Nicolet Magna II 550 FTIR spectrometer equipped with a deuterated triglycine sulphate (DTGS) detector and a purifying air setup (CO2 free air generator, Domnick Hunter CO2RP 280). The experimental conditions were 400–4000 cm−1 for the spectral range, with 4 cm−1 resolution and 32 cumulated scans. About 1 mg of sample was mixed with powdered KBr (300 mg) and pressed to obtain a pellet (KBr pellet technique). The spectrum of each sample was recorded against a fresh background spectrum obtained from 300 mg KBr pellet.
The morphology of the precipitates was observed using SEM technique (LEO 1450 VP, Carl Zeiss SMT, Oberkochen, Germany) as described in a previous paper (Mekmene et al. Reference Mekmene, Quillard, Rouillon, Bouler, Piot and Gaucheron2009b).
Microstructural characterisation by TEM was performed using a JEOL JEM1010 microscope, operating with an accelerated voltage of 100 kV. Selected area electron diffraction (SAED) study was performed at 100 kV using a double tilt holder. The corresponding diffraction constant was calibrated using an evaporated aluminium film as a standard. Energy-dispersive X-ray spectroscopy (EDX) measurements were performed at 100 kV, using an Oxford Instruments Link ISIS spectrometer, equipped with an ATW2 ultrathin window (energy resolution: 142 eV at 5·9 keV). For the TEM and EDX studies, powdered samples were dispersed in pure grade ethanol, and a few drops of the resulting suspensions were deposited on nickel grids covered with a holey carbon film. For each sample, about 5 to 10 EDX microanalyses were performed on different crystals, and the mean values were determined for the measured atomic concentration ratios. For quantitative analyses of atomic ratios, the experimental K factors were standardised for calcium, phosphorus, and sodium from analyses performed in the same conditions on sodium pyrophosphate (Na4P2O7), β-tricalcium phosphate (β-Ca3(PO4)2), and octacalcium phosphate (Ca8H2(PO4)6, 5H2O) standards.
Results
Saturation indexes of the solutions
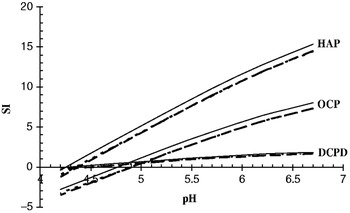
Saturation indexes (SI) with respect to DCPD, HAP and OCP were calculated in the solutions in the absence or presence of NaCl or citrate (Fig. 1). At pH 6·70 (pH of starting solutions), calculations showed that the system was supersaturated (SI>0) with respect to all these salts. The supersaturation was different from one salt to another in the order HAP>OCP>DCPD. Moreover, the supersaturation was slightly and similarly reduced in the presence of NaCl or citrate. As the spontaneous precipitation of calcium phosphate resulted in the decrease of pH due to the release of protons (Mekmene et al. Reference Mekmene, Quillard, Rouillon, Bouler, Piot and Gaucheron2009b), the supersaturation was calculated as a function of pH decrease. It was shown that SI of all salts decreased with pH decreasing (Fig. 1). However, the SI decreased markedly with respect to OCP and HAP and the system became undersaturated with respect to these salts at about pH 4·90 and 4·40, respectively. Finally, DCPD which had a lower supersaturation at pH 6·70 seemed to be more stable at acidic pH.
Saturation index (SI) calculated for the solutions of 30·0 mm calcium and 19·50 mm phosphate in the absence (−) or presence of 100·0 mm NaCl (- - -) or 10·0 mm citrate (…). The curves obtained in the presence of NaCl or citrate are almost superposed.

Particle size
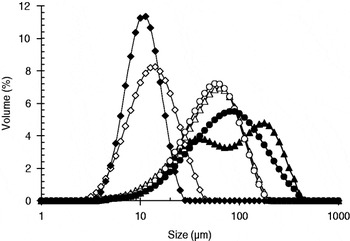
The size distributions of the suspended calcium phosphate particles, in the absence or presence of NaCl or citrate, after 3 hours of precipitation are shown in Fig. 2 and the corresponding average size D4,3 are summarised in Table 1. The size distribution profiles of the particles were symmetrical and unimodal in all samples except in case of the suspension with NaCl at drifting pH (final pH 4·99). In this sample 2 populations of particles were observed with peaks at about 41 and 185 μm. The mean size of the particles obtained in the absence or presence of NaCl were almost 2 times higher at pH 4·99 than at pH 6·70 (Tab. I), suggesting the formation of larger crystals at drifting pH. The presence of citrate in the suspensions obtained at drifting or constant pH reduced by about 9 and 4 times the mean particle size, respectively. This suggested an inhibitory effect of citrate on the growth of calcium phosphate crystals/aggregates. Moreover, the shape of the particle size distribution became narrower in the presence of citrate (Fig. 2).
Size distribution of calcium phosphate particles in the suspensions after 3 hours of precipitation: at pH 6·70 maintained constant in the absence (○) or presence of NaCl (Δ) or citrate (◊); at drifting pH in the absence (●) or presence of NaCl (▲) or citrate (⧫).

Characteristics of the calcium phosphate suspensions and precipitates obtained from solutions at pH 6·70 maintained constant or left to drift. The solutions contained 30·0 mm calcium and 19·5 mm phosphate (PCa) in the absence or presence of 100·0 mm NaCl or 10·0 mm citrate

† Ca/P atomic ratio±sd determined by TEM/EDX analyses
‡ Traces
§ Poorly crystallised
Morphology
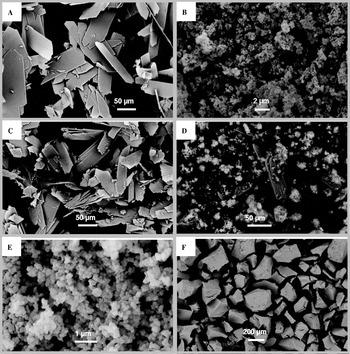
SEM micrographs showed large differences in shape, crystallinity and size of the precipitates obtained at drifting or constant pH in the absence or presence of NaCl or citrate (Fig. 3).
SEM images of calcium phosphate precipitates obtained from solutions of calcium (30·0 mm) and phosphate (19·5 mm) in the absence (a and b) or presence of NaCl (c and d) or citrate (e and f). The initial pH (6·70) of the solutions was constant (right side) or drifting (left side).

At drifting pH, in the absence or presence of NaCl, large (∼100 μm) plate-like crystals characteristic of DCPD were observed (Figs. 3a & 3c). In the presence of citrate, spherical nano-sized particles (∼200 nm), resembling to those of ACP, were observed (Fig. 3e). In suspension, these nano-sized particles occurred as agglomerates of several micrometers (Fig. 2).
At constant pH, in the absence of additives, precipitates with non-structured morphologies were observed (Fig. 3b). Very similar morphologies were observed in the precipitate obtained in the presence of NaCl with, in addition, the presence of large plate-like crystals (Fig. 3d). Finally, in the presence of citrate, very large (>200 μm) irregular and non-crystallised aggregates were observed (Fig. 3f).
Chemical structure
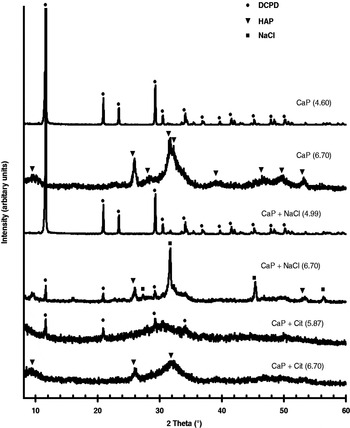
XRD analyses were used to examine the crystallinity of the calcium phosphate precipitates obtained from the solutions in the absence or presence of NaCl or citrate. The analyses showed qualitative and quantitative differences of the XRD patterns (Fig. 4).
XRD patterns of calcium phosphate precipitates obtained from solutions of calcium (30·0 mm) and phosphate (19·5 mm) in the absence or presence of NaCl (100·0 mm) or citrate (10·0 mm). The initial pH (6·70) of the solutions was maintained constant or left to drift; the final pH is indicated in parentheses. The peaks were assigned to DCPD (●), HAP (▼) and NaCl (■).

At drifting pH, DCPD was detected as the main crystalline phase formed in the samples in the absence or presence of NaCl where final pH values were 4·60 and 4·99, respectively. The presence of citrate clearly reduced the crystallinity of the precipitate as indicated by XRD patterns showing an amorphous-like background with small peaks of brushite (Fig. 4).
At constant pH, XRD pattern with poor crystallinity was obtained (Fig. 4); all the peaks detected were those of HAP, suggesting a formation of CDA. In the presence of NaCl, small amounts of crystalline phases corresponding to DCPD, CDA and NaCl were identified. Finally, in the presence of citrate, the crystallinity of the precipitate was highly reduced. The XRD patterns showed an amorphous-like background with very small peaks of HAP.
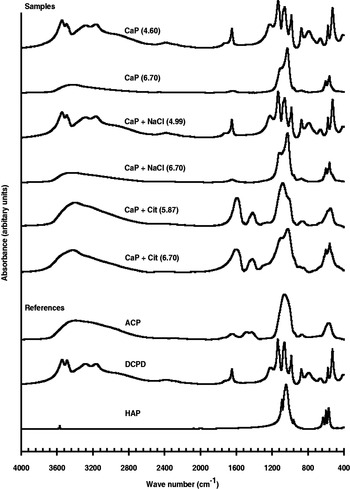
FTIR spectroscopy, used as a complementary technique to XRD analyses, gave the main functional groups thus enabling the identification of both crystalline and amorphous phases present in the precipitates.
At drifting pH, in the absence or presence of NaCl, all bands were assigned to phosphate groups that are characteristic of brushite confirming the XRD results. In the presence of citrate, a FTIR spectrum very similar to that of ACP taken as reference, was obtained (Fig. 5). The broad band at 3400 cm−1 can be assigned to OH stretching of H2O contained in ACP. The regions with maxima at about 1420 and 1600 cm−1 may correspond to carboxyl groups (C=O stretching) from citrate. The absorption at these regions may be due to the incorporation of citrate into the calcium phosphate phase as reported by López-Macipe et al. (Reference López-Macipe, Gomez-Morales and Rodriguez-Clemente1998a) and Martins et al. (Reference Martins, Santos, Almeida and Costa2008).
FTIR spectra of calcium phosphate precipitates obtained from solutions of phosphate (30 mm) and calcium (19·5 mm) with absence or presence of NaCl (100·0 mm) or citrate (10·0 mm). The initial pH (6·70) of the solutions was maintained constant or left to drift; the final pH is indicated in parentheses.

At constant pH, FTIR spectra corresponding to CDA were obtained from the precipitates formed in the absence or presence of NaCl. In the latter, the presence of DCPD shown by XRD analyses was not detected by FTIR spectroscopy. In the presence of citrate (at constant pH), results showed very similar profile to that obtained at drifting pH in the presence of citrate. However, the appearance of a shoulder at about 600 cm−1 suggested the presence of CDA as shown by XRD analyses.
TEM and EDX studies confirmed the results obtained by XRD and FTIR analyses and provided additional information on the microstructure of calcium phosphate precipitates.
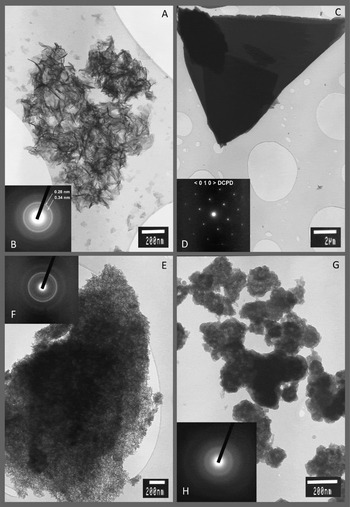
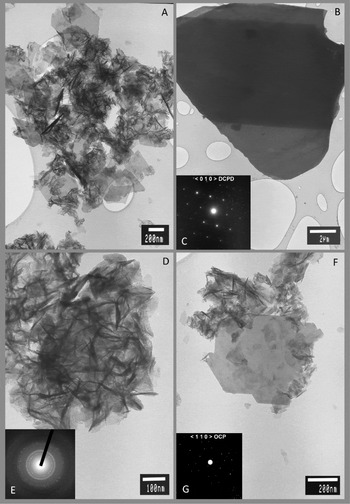
At drifting pH, in the absence or presence of NaCl, large plate-like crystals corresponding to DCPD were observed (Figs. 6c & 7b). This observation was confirmed by the electron diffraction (ED) patterns corresponding to a zone axis along the 〈0 1 0〉 crystallographic axis of the DCPD structure (Figs. 6d & 7c). Moreover, the average Ca/P atomic ratio (Table 1), obtained from EDX analysis performed on several crystals, was in accordance with the chemical composition of DCPD crystals. In the presence of citrate (at drifting pH), poly-crystalline particles of about 100 nm size were observed (Fig. 6g). They exhibited ED patterns with a strong diffuse ring indicating an amorphous structure (Fig. 6h). The average Ca/P atomic ratio determined from EDX analysis for these crystallites was 1·61±0·3, close to that of ACP or CDA (Table 1).
TEM images of calcium phosphate precipitates and their corresponding ED patterns obtained from solutions of calcium (30·0 mm) and phosphate (19·5 mm): in the absence of NaCl and citrate at pH 6·70 maintained constant (a and b) or left to drift (c and d); in the presence of 10·0 mm citrate at pH 6·70 maintained constant (e and f) or left drift (g and h).

TEM images of calcium phosphate precipitates and their corresponding ED patterns obtained from solutions of calcium (30·0 mm) and phosphate (19·5 mm) in the presence of 100·0 mm NaCl at pH 6·70 maintained constant (a, d, e, f and g) or left to drift (b and c).

At constant pH, in the absence of NaCl and citrate, typical apatitic poly-crystals having an aspect of “desert-rose” were observed (Fig. 6a). They exhibited a typical ED pattern (Fig. 6b) with intense diffraction rings at interreticular distances of 0·34 and 0·28 nm. This pattern is interpreted as the characteristic diffraction reflexions on the (002) and (112/211/300) crystallographic planes of an apatitic structure. The EDX measurements performed on several areas of agglomerated crystals led to an average Ca/P atomic ratio of 1·41±0·02, in agreement with that of CDA. Traces of sodium and chloride were also detected. At constant pH, in the presence of citrate, large agglomerates of small and poorly crystallised particles of CDA were obtained (Fig. 6e) as indicated by their corresponding ED patterns having less intense and more diffuse diffraction rings of an apatitic structure (Fig. 6f). EDX analysis showed a Ca/P atomic ratio of 1·62±0·03 close to that of CDA.
In the presence of NaCl at constant pH, TEM study revealed the presence of CDA and OCP (Fig. 7a). Fig. 7d shows typical poly-crystals of CDA having a “desert-rose” aspect and ED patterns corresponding to an apatitic structure (Fig. 7e). Figure 7f shows thin and small plate-like crystals identified as OCP from the ED patterns (Fig. 7g) according to a zone axis along the 〈1 1 0〉 crystallographic axis of the OCP structure. EDX analysis gave an average Ca/P atomic ratio of 1·30±0·05 close to that of OCP and/or strongly calcium deficient CDA crystals.
Discussion
Our results showed that the presence of NaCl or citrate at acidic or near-neutral pH greatly modified the type, size, crystallinity and morphology of calcium phosphate precipitates (Figs. 1–5). In the absence of NaCl and citrate, the results showed that large plate-like crystals of DCPD are formed at drifting pH whereas poor crystallised CDA are formed at constant pH. These results are in agreement with those reported and widely discussed in a previous paper (Mekmene et al. Reference Mekmene, Quillard, Rouillon, Bouler, Piot and Gaucheron2009b).
The presence of NaCl or citrate slightly reduced the saturation indexes of the solution with respect to DCPD, OCP and HAP (Fig. 1). NaCl addition acted by increasing the ionic strength and consequently decreasing the activity coefficients (Eqns 2–7), whereas citrate addition lowered the supersaturation of calcium phosphates by sequestering a part of ionic calcium (Mekmene et al. Reference Mekmene, Le Graët and Gaucheron2009a).
As expected, the presence of NaCl did not influence the formation of DCPD at drifting pH since the acidic final pH (4·99) was favourable to the formation of this salt. However the co-presence of DCPD, OCP and CDA in the precipitate obtained with NaCl at constant pH was surprising and not expected since only CDA was formed in the corresponding control. To our knowledge, the possible promoting effect of NaCl on the formation of DCPD at constant pH 6·70 has not been described in literature and few studies are available on the effect of ionic strength on the qualitative formation of calcium phosphates. This point merits further investigation in order to establish a possible relationship between the concentration of NaCl and the type of calcium phosphate formed at constant near-neutral pH.
The presence of citrate significantly reduced the size and crystallinity of the calcium phosphate precipitates and greatly altered their morphologies, in agreement with previous findings (Yamamoto et al. Reference Yamamoto, Kumagai, Fujii and Yano1993, Reference Yamamoto, Kumagai, Suzaki and Arai1994; Van Der Houwen & Valsami-Jones, Reference Van der Houwen and Valsami-Jones2001; Rosmaninho & Melo, Reference Rosmaninho and Melo2006). These modifications can be explained by the inhibitory effect of citrate which can occur in 3 ways:
(i) At drifting pH, citrate, due to its buffering capacity in the pH range of the study, withstood the decrease in pH (final pH 5·87 vs. 4·60 in the control) thus disadvantaging the formation of DCPD. Using simulated milk ultrafiltrate (SMUF) solutions, Rosmaninho & Melo (2006) concluded that the absence of citrate was responsible for the decrease in the solution pH and thus the formation of DCPD. On contrary, the presence of citrate in urine increased its pH, thus promoting the precipitation of calcium phosphate which is involved in kidney stones formation (Fleisch, Reference Fleisch1978; Grases et al. Reference Grases, Costa-Bauza and Prieto2006).
(ii) Citrate is a calcium-chelating agent capable of binding part of ionic calcium in solution and reduce its association with phosphate. Indeed, citrate has a higher association constant (22·104m−1) towards calcium than HPO42− and H2PO4− ions (442 and 21 m−1, respectively) (Mekmene et al. Reference Mekmene, Le Graët and Gaucheron2009a). The chelation of calcium ions by citrate resulted in the decrease in the saturation index shown by calculations, but the concentration of citrate used in the present study was not sufficient to make the solution undersaturated with respect to calcium phosphate salts (Fig. 1). Investigating the role of citrate complexes in preventing urolithiasis, Ashby & Sleet (Reference Ashby and Sleet1992) concluded that citrate prevented the kidney stones formation by inhibiting the agglomeration and growth of crystals rather than any significant reduction in the saturation index of calcium phosphate in urine.
(iii) Citrate inhibited the growth of the precipitating solid by binding the active growth sites of newly formed nuclei (Van der Houwen & Valsami-Jones, Reference Van der Houwen and Valsami-Jones2001). Thus, citrate acted as an impurity which adsorbed to edges and terraces of the growing surface thus reducing the growth rate (Wang & Nancollas, Reference Wang and Nancollas2008). The adsorption of citrate onto HAP surfaces takes place by ionic exchange of phosphate by citrate ions at the solid–solution interface. This ability is due to a higher affinity of citrate than phosphate species towards the calcium-sites on the HAP surface (López-Macipe et al. Reference López-Macipe, Gomez-Morales and Rodriguez-Clemente1998b; Yamamoto et al. Reference Yamamoto, Kumagai, Suzaki and Arai1994). Martins et al. (Reference Martins, Santos, Almeida and Costa2008) also reported that citrate adsorbed preferentially onto the facets of HAP crystals leading to an oriented crystal growth and consequently to a modification of the size and morphology of the crystals, in agreement with our results. Similarly, Tang et al. (Reference Tang, Darragh, Orme, Guan, Hoyer and Nancollas2005) showed that citrate interacts with DCPD crystals and dramatically increased the induction times thereby retarding nucleation and crystal growth. The proposed mechanism was that citrate acted as an impurity decreasing the growth rate by altering the interfacial energies required for crystallisation (Tang et al. Reference Tang, Darragh, Orme, Guan, Hoyer and Nancollas2005).
In our study, the adsorption of citrate onto the nuclei surfaces can be considered as the most likely cause of the crystallisation inhibition of calcium phosphate. Indeed, citrate was detected in precipitates using FTIR spectroscopy (regions with maxima at about 1420 and 1600 cm−1 in Fig. 5).
Conclusion
The present study investigated the effects of some additives (NaCl and citrate) found in dairy products on the physicochemical properties of calcium phosphate precipitates. The results showed that the presence of NaCl or citrate at drifting or constant pH (6·70) greatly modified the type, size, crystallinity and morphology of calcium phosphate precipitates.
In the absence of NaCl and citrate, the results showed that large crystals of DCPD are formed at drifting pH whereas poor crystallised CDA is formed at constant pH. In the presence of 100·0 mm NaCl, DCPD was formed at drifting pH whereas the co-presence of DCPD, OCP and CDA was revealed at constant pH.
The presence of citrate had a pronounced inhibitory effect on the crystallisation of calcium phosphates both at drifting and constant pH. The size of the suspended aggregates and the crystallinity were reduced and the morphology of the precipitates was modified. The inhibitory effect of citrate mainly acted by the adsorption of the citrate molecules onto the surfaces of newly formed nuclei of calcium phosphate, changing thereby the morphology of the growing particles.
These findings are of relevance to the recovery of calcium phosphates from dairy byproducts that contain NaCl and citrate.