

1. Introduction
To address the challenge that ‘seeing a doctor is too difficult and expensive’, the Chinese government launched the New Healthcare Reform in 2009. The following seven years have witnessed an unprecedented increase in both governmental and total expenditures in the health system. In 2009, the total health expenditure was 1754.19 billion yuan, accounting for 5.15% of gross domestic product (GDP), and the governmental expenditure on health was 399.42 billion yuan. In 2015, the total health expenditure was 4058.77 billion yuan, accounting for 6% of GDP, and the governmental expenditure on health had risen dramatically to 1253.30 billion yuan.Footnote 1 In terms of institutional structure, the government has dramatically improved three-core social health insurance (SHI) schemes, namely, the Urban Employee Basic Medical Insurance Scheme (UEBMIS), the New Rural Cooperative Medical Scheme (NRCMS) and the Urban Resident Basic Medical Insurance Scheme (URBMIS), which has extended coverage to ~95% of the whole population and substantially increased benefit levels (with different benefit packages and reimbursement rates) for the various schemes (Li et al., Reference Li, Chen and Powers2012). Nevertheless, the practice of applying different schemes with different benefits to different groups of people has resulted in a fragmented health insurance system that fails to fully achieve the 2009 reform goals. A wide gap in benefit levels is observed between urban and rural residents, between state employees (public civil servants and institution personnel) and employees of private enterprises, and between employees with formal and informal employment (Liu and Zhao, Reference Liu and Zhao2006; Du, Reference Du2009). There exists substantial inequality in cost-sharing and access to basic medical services among insured patients covered by the different schemes, and people with low incomes may still become impoverished because of illness (Liu and Darimont, Reference Liu and Darimont2013). Therefore, one general consensus advocated before 2009 (Zhang, Reference Zhang2007; Yip and Hsiao, Reference Yip and Hsiao2008) is that China should urgently promote integration of the various insurance schemes and establish a universal and uniform SHI with high benefit levels.
Establishing a universal and uniform SHI was not only the primary purpose of the New Healthcare Reform but also the means for achieving broader improvements in health and well-being. However, will such an SHI truly be beneficial to China, or will the actual results fall short of the original expectations? We are concerned about the financial risks for individuals and health insurance funds and the possibility of uncontrollable rapid growth in total medical expenses. A growing number of studies reveal that the increasing coverage of health insurance schemes in China has not actually reduced the financial risks of many insured (patients); rather, it has significantly increased total medical expenses (including out-of-pocket spending and payments reimbursed by insurance). The major reason appears to be supply-induced demand (SID), with excessive medical treatment becoming pervasive in China because of the lack of effective financial control and governance mechanisms set by the government (Wagstaff and Lindelow, Reference Wagstaff and Lindelow2008; Wagstaff et al., Reference Wagstaff, Lindelow, Gao, Xu and Qian2009a; Yip et al., Reference Yip, Hsiao, Chen, Hu, Ma and Maynard2012; Allen et al., Reference Allen, Cao and Wang2014).
SID is not unique to China; it occurs globally. Despite some scepticism about the objective existence of SID (Grytten and Sørensen, Reference Grytten and Sørensen2001; Madden et al., Reference Madden, Nolan and Nolan2005), most researchers assert that it is prevalent (such as Watts et al., Reference Watts, Shiner, Klauss and Weeks2011; Hitoshi and Fushimi, Reference Hitoshi and Fushimi2014). Asymmetric information is universally acknowledged as being largely responsible for SID, and scholars have carried out many theoretical analyses and empirical studies in this domain. For example, Kris and Jegers (Reference Kris and Jegers2000) devised a theoretical model to explain this phenomenon, claiming that the high asymmetry in information allows doctors to determine whether to shift the demand curve to the right. Medical services provided by doctors then become contingent on the potential payment capacity of patients rather than their state of illness.
The target income hypothesis indicates a possibly related factor (McGuire and Pauly, Reference McGuire and Pauly1991). Particularly when faced with competition, doctors may be able to protect their incomes by providing patients with increasingly expensive medical services (Rizzo and Blumenthal, Reference Rizzo and Blumenthal1996). If price discrimination occurs or if providers have less freedom to set prices, the SID is likely to be more severe and is more likely to happen (McGuire, Reference McGuire2000; Santerre and Neun, Reference Santerre and Neun2002). An increasing number of studies indicate that even patients with a great amount of information about their state of illness may be persuaded to seek more prescriptions, examinations and medical services (Shih and Ming, Reference Shih and Ming2012). Insured patients, particularly in cases of generous insurance, have a much stronger motive to increase their medical demands and seek to cover and/or share medical expenses with insurance (Feldstein, Reference Feldstein1973; Wagstaff and Lindelow, Reference Wagstaff and Lindelow2008).
Another vital contributing factor is the economic incentives associated with the way medical services are funded, which can exert a decisive impact on doctors’ medical decision-making behaviour. The conventional fee-for-service (FFS) approach is perceived as stimulating SID more than other methods, as doctors may influence the number of patient visits (Stone, Reference Stone1997; Gosden et al., Reference Gosden, Forland, Kristiansen, Sutton, Leese, Giuffrida, Sergison and Pedersen2001; Barham and Milliken, Reference Barham and Milliken2015). A balanced set of provider payment methods can play an important role in achieving cost containment for insurance funds and can be a primary approach to reducing SID (Coudin et al., Reference Coudin, Pla and Samson2015; Rudoler et al., Reference Rudoler, Beber, Barnsley, Glazier, Dass and Laporte2015). Such an approach may, e.g., combine FFS with reward effort, cap payments to reward health outcomes, and total budget caps to contain total costs.
In summary, the major factors causing SID are asymmetrical information, competition among doctors, economic incentives resulting from inappropriate payment methods and the moral hazard and adverse selection caused by insurance.
In China, SID was thought to be a pervasive phenomenon in the 1980s and 1990s following the marketisation of the economy and before the government properly intervened to re-establish universal access to health services (Liu and Mills, Reference Liu and Mills1999; Rösner, Reference Rösner2004). The New Healthcare Reform launched in 2009 was expected to resolve or at least substantially relieve this problem. What is the current status of SID in China? While research on Chinese health insurance and SID before 2009 was supported by extensive data and empirical evidence, most (if not all) recent studies are qualitative. Recently, Jackson et al. (Reference Jackson, Yip and Han2015) and Cheng et al. (Reference Cheng, Liu, Zhang, Shen and Zeng2015) provided new data and empirical studies on China’s NRCMS. However, in China’s fragmented SHI system, the government applies different schemes with different benefit levels to different groups of people. A popular notion is that for a given state of illness, the higher a scheme’s benefit level, the higher the degree of SID will be and the higher both the total medical expenses and the out-of-pocket spending of insured patients will be. However, this suggestion has not yet been properly tested.
This article attempts to use data on inpatient medical expenses from 2014 at a public Tier-three hospital in a particular city in Zhejiang Province, China. This study estimates the expense of patients insured by different schemes to observe and test whether SID occurs and whether its degree differs significantly among the different schemes in China. The study focusses on the impact of information asymmetry. Patients with chronic diseases are ordinarily thought to be better acquainted with information about their state of illness and treatment programmes. For example, only 12.81% of inpatients with chronic conditions are admitted to the hospital through emergency treatment, while 22.64% of inpatients with nonchronic conditions are admitted to the hospital through emergency treatment in our data. Even if there are some new patients with chronic conditions who have less knowledge and who suddenly become aware of the severity of the condition, they would not constitute the majority of inpatients. This approach is similar to that adopted in a recent study of moral hazard and SID based on Dutch GP utilisation (Dijk et al., Reference Dijk, Berg, Verheij, Spreeuwenberg, Groenewegen and Bakker2013), and it provides a relatively new way to take advantage of different data and a novel approach to analysing the problem, in contrast to many existing studies that study the existence of SID by testing the dynamics of supply and demand (Watts et al., Reference Watts, Shiner, Klauss and Weeks2011; Li et al., Reference Li, He and He2014). Our main aim is to test the impact of the different schemes with different benefit levels when the degree of information asymmetry changes. We also discuss future agendas for universal SHI in China and the future orientation of and strategies related to the New Healthcare Reform.
2. Towards universal and uniform SHI
The World Health Organization (WHO, 2010) defines the goal of global health care system reform as ‘universal health coverage’ and advocates the building of a sound health financing system to reduce individual financial risk and avoid impoverishment through risk-pooling and prepayment approaches. In contemporary China, the most important and primary target of health care system reform is the establishment of a universal and uniform SHI system.
In the era of the planned economy, the Chinese government established the Rural Cooperative Medical Scheme, which covered the entire rural population and had the rural collective economy as its financing channel. In towns and cities, the health security system consisted of the Free Medical Service (FMS) and Labour Insurance Scheme (LIS). The FMS was paid directly by the government’s fiscal budget, covering public civil servants and institutional employees, while the LIS was financed by enterprises’ retained profits, covering employees of state-owned enterprises. Both schemes were essentially non-contributory for individuals. Hence, we could say that universal health coverage was achieved.
In 1978, China embarked on its economic reform and opening-up process. A widespread view (Bloom and Gu, Reference Bloom and Gu1997; Eggleston et al., Reference Eggleston, Li, Meng, Lindelow and Wagstaff2008a; Du, Reference Du2009) is that the market-oriented economic reform had mainly a negative impact on the health care system, causing a remarkable decline in health insurance coverage and increasing inequality in access to basic medical services (Gustafsson et al., Reference Gustafsson, Li and Sicular2008). Since the turn of the 21st century, the Chinese government has gradually shifted its priority from economic growth to social development and devoted increasing attention to reforming and improving the health insurance system (Li et al., Reference Li, Chen and Powers2012). First, the Rural Cooperative Medical Scheme was announced reasonably quickly in response to the disintegration of the rural collective economy in the early 1980s, but the scheme failed. The long absence of an insurance scheme is regarded as the main cause of the tremendous inequity of access to basic medical services between rural and urban residents (Liu et al., Reference Liu, Wu, Peng and Fu2003). Furthermore, the level of affordability for health services was very low for rural patients, who faced the obstacle of making out-of-pocket payments to contribute to burdensome medical expenses, even though the majority of these patients were relatively poor (Wagstaff et al., Reference Wagstaff, Yip, Lindelow and Hsiao2009b). They either opted not to seek treatment or chose to suffer in poverty due to their high medical expenses (Zhan et al., Reference Zhan, Tang, Guo and Bloom1998; Darimont, Reference Darimont2009; Duckett and Heilmann, Reference Duckett and Heilmann2010). For this reason, the NRCMS, finally launched by the Chinese government in 2003, won wide acclaim.
Second, in towns and cities, as market-oriented economic reform forged ahead, a large proportion of the workforce started to seek employment in private or foreign-owned enterprises or joint ventures. These employees thus were not covered by the previously mentioned health security system. Moreover, with the privatisation and autonomic reform of state-owned enterprises, the LIS was no longer appropriate or effective. Accordingly, the Chinese government proposed the establishment of a contributory social insurance system in 1992. In the late 1990s, the government successfully formulated the UEBMIS, which in theory covered all urban formal employees. However, even within the same scheme, the benefit level for state employees was higher than that for private employees. In 2007, the government established the URBMIS for all other urban residents (such as informal employees, senior citizens, college students, minors). China achieved universal coverage of health insurance through these three schemes, but only in a theoretical and legal sense.
With efforts in the five years since 2009 the ‘New Healthcare Reform’ was introduced, China has nearly achieved universal coverage in practice, though the system still appears fragmented and vulnerable. These three schemes are strictly confined to three groups of people. The schemes in which residents can participate are decided by the residents’ hukou and by their formal working status if they are urban residents. Even for the URBMIS and the NRCMS, which are voluntary, the only option for residents is to participate or not. More than 95% of the urban residents we studied choose to participate in the URBMIS, and more than 98.3% of the rural residents are covered by NRCMSFootnote 2 according to publicly reported data.
All the health insurance schemes are designed by the central government, while only the benefit level (with different benefit packages and reimbursement rates) is determined independently by local governments. Therefore, even though the various schemes share different benefit levels, the benefit structure of different schemes are the same throughout the whole country.
Not only does the fund-pooling for these schemes financially operated separately, but responsibilities for their management also fall within different government departments. The core issue remains the enormously wide gap in benefit levels among the various schemes (Eggleston et al., Reference Eggleston, Wang and Rao2008b; Saich, Reference Saich2008). Although the benefit level of NRCMS and URBMIS has increased yearly, there remains a marked gap compared with the UEBMIS. In some provinces and cities, the NRCMS and URBMIS have merged, while there remains a significant gap in benefit levels between the new scheme and UEBMI. Therefore, the merger of all three schemes is much more difficult than the merger of NRCMS and URBMIS. In addition, China has retained the more generous FMS for retired senior cadres.
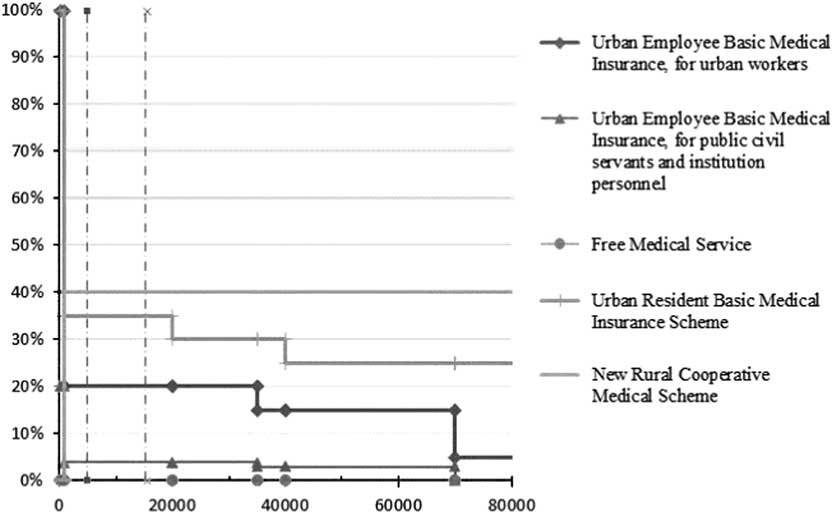
Figure 1 describes the formulae for out-of-pocket paymentsFootnote 3 under the various insurance schemes in the city that our research focussed on. In China, health insurance is financed and operated at the municipality and county government levels. Although this city is located in the developed Eastern coast of China and the benefit levels for the various insurance schemes are slightly higher than the national average, the whole country shares a similar benefit structure.
Self-payment rate for various health insurance schemes in the given city

We use vertical lines to designate the interval between the 25th and 75th percentiles, which are 4979 and 15,408.5 yuan, respectively, of the total medical expenses of inpatients at the Tier-three hospital. The figure shows notable differences in the reimbursement rates among the different schemes.
As shown in Figure 1, within the interval between the 25th and 75th percentiles, self-payment rate vary from almost 0–40%; i.e., the difference in the reimbursement rates among the various schemes is between 60 and 100%. The benefit level is the highest for the FMS; the horizontal line representing its self-payment rate nearly overlaps with the X axis. The next highest level is for the UEBMIS, followed by the URBMIS and the NRCMS, and the benefit levels for public civil servants and institution personnel are higher than those for urban employees in enterprises even within the UEBMIS. The difference in the self-payment rate between NRCMS and URBMIS is only 5% within the 25th and 75th percentiles, while the difference among them and UEBMIS is as high as 15–20%.
To reduce this inequality, since 2014, the Chinese government’s agenda for health insurance system reform has shifted from extending coverage to promoting integration of the three schemes. The government has stipulated that insurance funds should be pooled and operated together and managed by one government department and that the government should further increase its fiscal subsidies for the insurance fund, bridge the gap in benefit levels among different groups of people, and eventually offer a consistent policy of social security to all citizens. The central government has specified this development target and promised to formulate the necessary details as soon as possible. Thus, a universal and uniform SHI is no longer unreachable for Chinese citizens.
3. Methods, data, results and limitations
As noted above, although we agree that China should promote the integration of the three health insurance schemes as soon as possible, we also harbour concerns that if SID exists and is not effectively controlled, it may well contribute to accelerating the growth in both out-of-pocket spending and total medical expenses for insured patients as well as lead to the abuse and waste of insurance funds. Research on Chinese health insurance reform also demonstrates that extending coverage does not automatically improve the financial impact on individuals (e.g. Wagstaff and Lindelow, Reference Wagstaff and Lindelow2008). Increasing the government’s fiscal input is far from enough to create a sustainable health care system (Liu and Darimont, Reference Liu and Darimont2013). Our concerns will be substantiated if we identify significant SID in the current health care system in China, particularly if we also observe significant differences in the impact of the different insurance schemes on SID.
3.1 Data
The data we use are from the electronic medical records of inpatients at a public Tier-three hospital in a city in Zhejiang Province in 2014. Although the difference among various parts of China should not be omitted, various parts of China share some similar characteristics in institutional design, and therefore a case from coastal areas can reflect these characteristics of China.
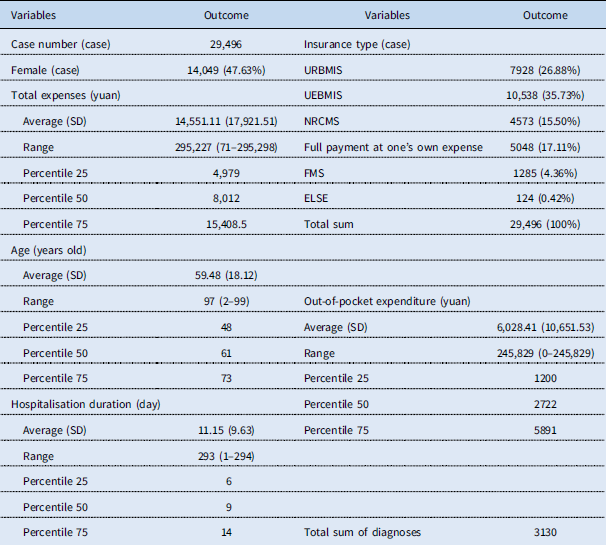
The hospital is composed of 32 departments, including the ICU, the emergency department, and 30 specific professional departments. Costs for patient care are identified within each of these departments (based essentially on the inputs consumed), and the insurance schemes and patients are charged according to the different schemes’ benefit schedules. We exclude some data that seem erroneous (e.g. suggesting the existence of patients who are more than 150 years old or patients for whom no money at all was spent). When we replace these data with missing values and use multiple imputations to test the results, the results are stable. We also exclude data from ICU and emergency departments to focus on inpatients in professional departments. Moreover, data for inpatients who did not spend at least one night in the hospital are excluded. In total, our cross-sectional data span 29,496 cases of inpatients who were discharged after treatment in 2014, and these patients were diagnosed with 3130 diseases. Descriptive statistics are shown in Table 1.
Descriptive statisticsFootnote a

Note: URBMIS=Urban Resident Basic Medical Insurance Scheme; UEBMIS=Urban Employee Basic Medical Insurance Scheme; NRCMS=New Rural Cooperative Medical Scheme; FMS=Free Medical Service.
a These data include patients from other municipalities who have to pay on their own first even if they are insured and receive reimbursement at home.
The data are used to estimate the potential impact of insurance schemes with different benefit levels on medical expenses. We use chronic diseases as a proxy indicator of the degree of information asymmetry between doctors and patients. Patients with chronic diseases are believed to have more information about their state of illness and health condition than ordinary patients, since the successful management of chronic conditions often depends on adequate self-care and since the patient is typically at the centre of chronic disease control efforts (Clark, Reference Clark2003).
The majority of Chinese citizens are insured by URBMIS, NRCMS and UEBMIS. Since these schemes are determined by social rather than health factors, admissions to a particular professional department are unlikely to vary significantly across the schemes.
The chances that admission to a particular professional department for inpatients would vary by insurance schemes was analysed using repeated-measures analysis of variance. No significant effect of insurance scheme (F 5,28=0.000; p=1.000) was found. In addition, the results of the Friedman test show that except for the FMS participants, the difference among the others are nonsignificant. Therefore, the probability that patients insured by these three schemes are admitted to a particular professional department is not affected by insurance schemes.
3.2 Hypotheses
We surmise that if SID does not occur, the prescription and examination of treatment programmes chosen by doctors for patients with similar state of illness, but insured by schemes that are different, would also be similar.
Accordingly, we put forward two hypotheses for this empirical research based on the assumption that there is no SID.
Hypothesis 1: Changes in information asymmetry do not affect the total medical expenses in any insurance scheme.
In theory, SID may be attributable to severe information asymmetry. Under Hypothesis 1, however, regardless of how much information patients have about their state of illness, they would receive similar or identical treatment if doctors consider only the patients’ state of illness. In this case, the patients’ information would not impact the total medical expenses regardless of their potential payment capacity or the benefit level of the scheme they are insured with.
Hypothesis 2: To the extent that medical costs differ among patients in different schemes, these differences are not related to changes in information asymmetry.
For certain reasons, the total costs for participants of different schemes differ. This does not rule out the possibility that medical expenses may differ across the schemes because of variations in patient income and willingness to pay for more treatment, education, marital status or benefit levels, which might also affect demand for more treatment. SID, if it exists, is also one of these factors. Under Hypothesis 2, however, any differences in medical expenses across the schemes are indifferent to changes in information asymmetry; hence, either there is no SID or SID is distributed across schemes equally. If this hypothesis is refuted, then the SID is not distributed across schemes equally but is affected by insurance design factors such as benefit levels.
3.3 Methods
To test both hypotheses, we attempt to create a model to depict the relationship between health insurance schemes and medical expenses when the degree of information asymmetry changes. Meanwhile, because of the heteroscedasticity of data, we present the model created with both ordinary least squares (OLS) and feasible generalised least squares (GLS).
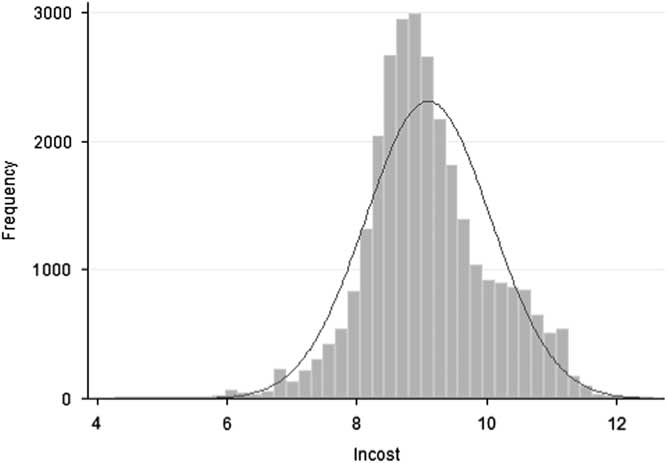
To estimate the impact of different insurance schemes, five dummy variables, i.e., URBMIS, NRCMS, UEBMIS, FMS and ELSE, are introduced to represent patients insured by different insurance schemes. The reference category for the insurance variables is the patient who is insured by no insurance scheme. The dependent variable in the model is the natural logarithm of the total expenditure of all inpatients. The distribution of the dependent variable is shown in Figure 2.
Distribution of the natural logarithm of total expenditure (dependent variable) compared to a normal distribution

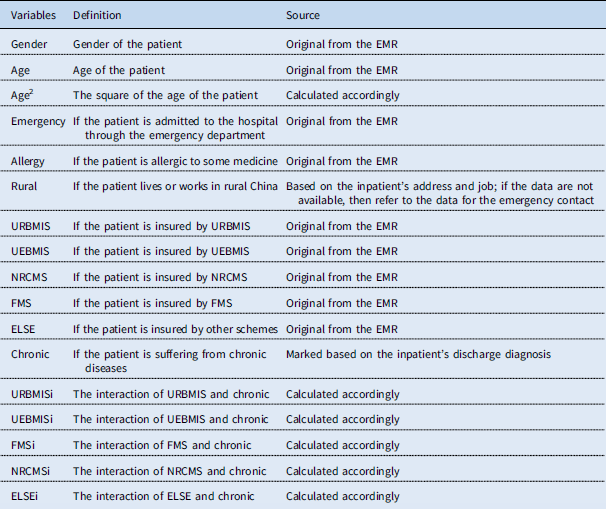
See Table 2 for the variables in the formula.
Specifications of the variables in the formula

Note: EMR=electronic medical record; URBMIS=Urban Resident Basic Medical Insurance Scheme; UEBMIS=Urban Employee Basic Medical Insurance Scheme; NRCMS=New Rural Cooperative Medical Scheme; FMS=Free Medical Service.
To estimate the patient’s knowledge of their own condition, a dummy variable, i.e., chronic, is introduced. Patients with chronic conditions are likely to know more about their health conditions than patients with nonchronic conditions.
The interaction of insurance and chronic disease (i.e. URBMISi, NRCMSi, UEBMISi, FMSi and ELSEi) makes the model similar to a difference-in-difference model. The model simultaneously examines the differences among the various insurance schemes and differences among patients with and without chronic conditions. The interactions in this case indicate whether the impact of various insurance schemes on total health expenses is influenced by the knowledge of inpatients.
In addition to the above variables, other control variables are chosen according to several criteria. Some of them reflect basic information on patients, i.e., Gender, Age, and Age2; some reflect the severity of their conditions and the complexity of treatment, i.e., Emergency and Allergy; and one reflects only the social economic background of the inpatients, i.e., the variable Rural (the inpatients’ addresses provide the ability to identify whether they live in an urban or rural area, which may indicate likely differences in income). The definitions and sources of these variables are shown in Table 2. Many other factors affect health expenditure and SID, such as education and marital status, and are excluded from our model. This aspect of our study might produce estimation errors and will be addressed in the discussion of limitations.
To test Hypothesis 1, an F-test (F-test #1) is introduced to estimate whether the impact of insurance schemes with different benefit levels on total medical expenses differs between chronic and nonchronic cases.
To test Hypothesis 2, an F-test (F-test #2) is adopted to determine whether the impact on total medical expenses varies among the different insurance schemes.
3.4 Results
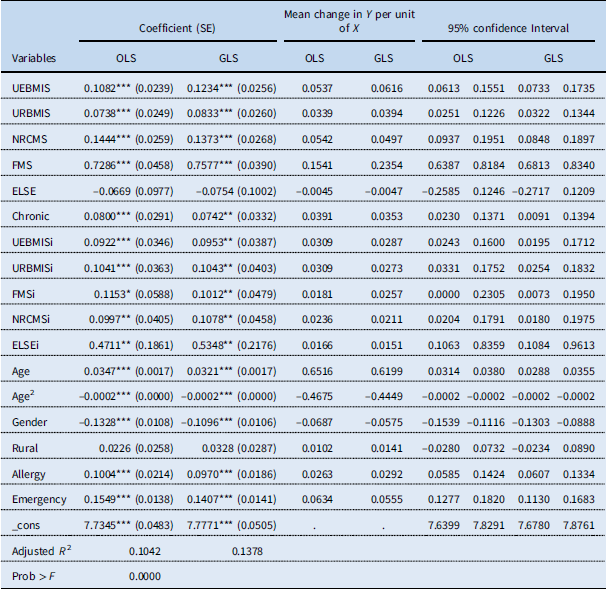
The results for the model are presented in Table 3.
Regression of the independent and control variables on the logarithm of total expenditure

Note: OLS=ordinary least squares; GLS=generalized least squares; URBMIS=Urban Resident Basic Medical Insurance Scheme; UEBMIS=Urban Employee Basic Medical Insurance Scheme; NRCMS=New Rural Cooperative Medical Scheme; FMS=Free Medical Service.
*p<0.1; **p<0.05; ***p<0.01.
The results (see Table 4) of F-test #1 show that the coefficients of all insurance schemes, except NRCMS, differ moderately to significantly between the two situations of information asymmetry; hence, the impact on the expenses for most schemes (but not NRCMS) changes significantly, in contrast to Hypothesis 1.
Results when the coefficient of the interaction terms is 0 (i.e. the impact of chronic illness on the total health expenditures for the various schemes)

Note: OLS=ordinary least squares; GLS=generalized least squares; URBMIS=Urban Resident Basic Medical Insurance Scheme; UEBMIS=Urban Employee Basic Medical Insurance Scheme; NRCMS=New Rural Cooperative Medical Scheme; FMS=Free Medical Service.
*p<0.1; **p<0.05; ***p<0.01.
It is entirely possible that the degree of information asymmetry does not affect the impact of NRCMS on medical expenses because patients insured by NRCMS have already exhausted their potential resources to seek basic treatment. Data from lower-level public hospitals may well provide further support to reject Hypothesis 1 with respect to NRCMS. In any case, if we exclude the patients insured by NRCMS, Hypothesis 1 does not hold.
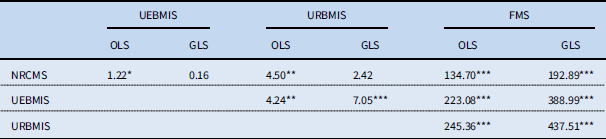
The results of F-test #2 show that the total medical expenses for URBMIS differ significantly from the expenses for NRCMS and UEBMIS for nonchronic treatment, while the difference is nonsignificant for chronic cases. This result contradicts Hypothesis 2, implying that doctors consider the design of the schemes by which patients are insured when the patients know less about their own state of illness.
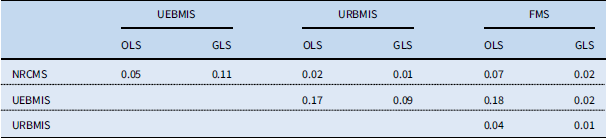
Table 5 shows the difference among different schemes in chronic cases; when the degree of information asymmetry is low, the impact on total medical expenses in the different schemes is not significant (except for FMS). The situation with a high degree of information asymmetry (i.e. the nonchronic disease cases) is shown in Table 6, revealing significant differences between some of the schemes.
Results of the F-test for chronic illness cases when the coefficients of the various insurance schemes are equal

Note: UEBMIS=Urban Employee Basic Medical Insurance Schemel; URBMIS=Urban Resident Basic Medical Insurance Scheme; FMS=Free Medical Service; OLS=ordinary least squares; GLS=generalized least squares; NRCMS=New Rural Cooperative Medical Scheme.
*p<0.1; **p<0.05; ***p<0.01
Results of the F-test for nonchronic illness cases when the coefficients of the various insurance schemes are equal

Note: UEBMIS=Urban Employee Basic Medical Insurance Schemel; URBMIS=Urban Resident Basic Medical Insurance Scheme; FMS=Free Medical Service; OLS=ordinary least squares; GLS=generalized least squares; NRCMS=New Rural Cooperative Medical Scheme.
*p<0.1; **p<0.05; ***p<0.01.
To rule out the potential explanation of these changes in Tables 5 and 6 regarding the variation in diseases among chronic and nonchronic patients, the effects of renal failure and cancer (including leukaemia) are tested by using the same methodology but replacing chronic illness with the two diseases (which reflect both chronic and nonchronic cases). The impact of renal failure is nonsignificant, and the coefficient of interactions for cancer is mostly nonsignificant, which implies that the effect of chronic disease cannot be explained simply by the variation in diseases.
With both hypotheses rejected, the results imply the existence of SID in China and suggest that the degree of SID varies across the different insurance schemes.
To test the robustness of the results, several analyses are conducted. First, both OLS and GLS results are examined, and the results do not change. Second, regression with robust (Huber-White-sandwich) standard errors is performed, and the results remain stable. Moreover, propensity score matching is adopted to analyse the sensitivity of the results. We matched 9867 nonchronic cases with chronic cases in age, departments and other aspects, and the results remain robust except for the result for the NRCMS.
Considering that this large public Tier-three hospital is in a city that has a population of 5.79 million and contains only three Tier-three hospitals, it seems reasonable to suggest that the rural patients, especially those from other municipalities, are likely to have more severe diseases and need more extensive treatments than urban patients on average; otherwise, they would seek treatment in county-level hospitals or township clinics. This explanation may account for the higher medical costs for NRCMS patients found in this study. If we exclude NRCMS, we observe that for urban patients, the higher a scheme’s benefit level is, the stronger the impact of the insurance scheme on total medical expenses.
We are convinced that the phenomenon we observe is SID. While health insurance ostensibly reduces patients’ financial risks, this may be offset by excessive use of drugs and medical services that add to costs for both patients and insurers.
In summary, the reverse of Hypothesis 1 is observed. We observe a significant difference among the impacts of different insurance schemes (except NRCMS) on total medical expenses when the degree of information asymmetry changes. Hypothesis 2 is also partly disproved. In general, the evidence here points to the strong likelihood that a higher benefit level for a scheme is associated with a stronger impact on total medical expenses during a single hospitalisation session.
Thus, we not only demonstrate the existence of SID in contemporary China but also confirm the difference in the degree of SID among the various insurance schemes. This means not only that total medical expenses are growing more than they should (with implications for future insurance contribution requirements) but also that the SHI does not achieve the expected level of protection in reducing patients’ financial risks. Although the regression formula may not account for all the causes of differences in medical expenses, these results validate our concerns.
Our research lends support for and complements previous research findings from many pioneering scholars, such as Wagstaff, Lindelow, Yip, Hsiao, Eggleston and Darimont, but from a different perspective. We further hold that if the SID issue is unsolved or uncontrolled, simply pursuing integration of the three insurance schemes with higher average benefit levels may lead not only to a direct increase in the government’s fiscal commitment (and the contribution levels it imposes on insured people) but also to substantial additional financial risks to insurance funds and their contributors through rising medical expenses and to increases in out-of-pocket spending by patients.
3.5 Limitations
Our approach has limitations related to the data and methodology. First, the data we used may not be representative of all hospitals on the same level. The current data is from a tertiary hospital in a wealthy costal city in China, hence further research with more comprehensive data is important. Besides, in 2015, the total expenses of Tier-three hospitals in China was 12,599.3 yuan per inpatient,Footnote 4 which is slightly lower than the sample mean (14,551.11 yuan) from a single hospital in Zhejiang. Nevertheless, the data still show the benefit structure of various health insurance schemes throughout the country.
A second limitation is the lack of information on the socioeconomic background of inpatients. Due to the privacy policy of the hospital, it is impossible to identify the inpatients. The proxy variable adopted by the authors can at best predict the relative income of inpatients; education, marital status and other social attributes might also have impacts. While we focus on the influence of information asymmetry and different benefit levels of health insurance, and the results of Tables 5 and 6 show that SID is evident in this data set despite the lack of other social economic indicators, we are still working on relevant research and intending to consider additional factors in future research. A third limitation is that the information asymmetry proxy variable (chronic illness) does not consider the diversity among different chronic diseases. Although the likelihood of an inpatient being insured by a particular insurance scheme is related to the scheme’s share in the population, the actual distribution by disease could have an impact on the result.
These unknowns and other limitations indicate areas for future research and highlight the need to continually improve the data sources and methods.
4. Further discussion and policy recommendations
To attain the goal of ‘universal health coverage’, improve equality in access to medical services, and ensure that no citizen is trapped in impoverishment due to hefty medical expenses, the primary urgent objective must be to expand health insurance coverage (Schremmer et al., Reference Schremmer, Coheur, Jacquier and Diabate2009; WHO, 2010). However, despite the importance of expanded coverage, it is far from sufficient to ensure a sound health care system. It may be equally vital that the government plays a stronger stewardship role (WHO, 2000; Carrin and James, Reference Carrin and James2005). In addition to the conventional role in health financing and regulation of prices, professional practice, standards and so on (Hunter, Reference Hunter2008), this stewardship role involves more ‘strategic purchasing’ that focusses on fair competition in insurance contracts between private and public providers (and good governance of public hospitals), as well as properly designed provider payment methods with appropriate economic incentive mechanisms (Figueras et al., Reference Figueras, Robinson and Jakubowski2005).
The significant implication for China’s health care system reform is that the pursuit of universal coverage through SHI has allowed the reform of the health care service provision system to lag considerably behind (Blumenthal and Hsiao, Reference Blumenthal and Hsiao2015). When China launched the New Healthcare Reform in 2009, scholars such as Yip and Hsiao (Reference Yip and Hsiao2009) made bold predictions that even if universal coverage of insurance were achieved and government greatly increased its fiscal inputs in the health care system, the expected target would be hard to meet without radical reform to eliminate the roots of wasted resources and inefficiency – including the fragmented health care system and the existing provider payment methods and incentive mechanisms, which contribute to excessive medical treatment.
In China, because public hospitals have hitherto retained a monopoly in the health care service provision system, the importance of a public hospital system reform is no less important than universal coverage of health insurance (He et al., Reference He, Yu and Gu2014). Since the mid-1990s, the government has reduced its direct fiscal inputs into public hospitals (by nearly 10% of hospitals’ operational costs). Meanwhile, payment methods and incentive mechanisms remain poorly designed (Ma et al., Reference Ma, Lu and Quan2008; Yip et al., Reference Yip, Hsiao, Meng, Chen and Sun2010). For example, China has until now implemented the FFS as its main provider payment method (Jackson et al., Reference Jackson, Yip and Han2015). These aspects of the system may have contributed to the prevalence and severity of SID, adding to medical expenses and excessive treatments. In the past five years, compared with the remarkable progress of the health insurance system reform, the reform of the public hospital system and relevant payment methods and incentive mechanisms has lagged considerably behind. That is why the development of the health insurance system has failed to fully achieve its potential in reducing financial risk and out-of-pocket spending by patients (Cheng et al., Reference Cheng, Liu, Zhang, Shen and Zeng2015). Therefore, scholars and observers have argued that the Chinese government should further increase its fiscal inputs to merge the insurance schemes and should replace its reliance on input-based funding and FFS with a suite of bundled methods (such as global budgets, capitation, pay-for-performance and diagnosis related groups) to fund the health system as a whole (not just hospitals) and ensure that all insurance schemes adopt the same payment system (Wang et al., Reference Wang, Zhang, Yip and Hsiao2011; Yip et al., Reference Yip, Hsiao, Chen, Hu, Ma and Maynard2012). In fact, the Chinese government has been advocating payment method reform for many years, but there has been virtually no substantial progress.
Notably, unlike in most developed countries, the SID and excessive treatments in China are even more prevalent in the use of medicines: the high expense of ‘seeing a doctor’ often refers more to hefty drug expenses. In addition to the lagging reform of provider payment methods, this high expense also stems from the government’s administrative price-setting practice for drugs and medical services. Some previous studies have touched on this issue, but few have mentioned drug price-setting practices. For example, Wagstaff and Lindelow (Reference Wagstaff and Lindelow2008) noted that the prices that the Chinese government sets for basic interventions are usually below cost, while the prices of more sophisticated interventions are well above their costs. Such a price structure forces providers to supply more of the latter to cross-subsidise the former. On 1 January 2015, the Chinese government cancelled its price-setting practices for most drugs and launched a market-based pricing mechanism reform. This reform has won universal applause, for it is considered beneficial for resolving the dire consequences of current practices (a shortage of low-priced ordinary and common drugs, as well as the overprovision of high-priced imported and new drugs). It involves an open tender and purchasing system that favours the need to ‘win bidding for the lowest price’. In addition, because the Chinese government had long allowed public hospitals to sell drugs with price mark-ups to compensate for the government’s inadequate fiscal inputs, hospitals tended to provide more expensive drugs and excessive use of them to maximise their profits. At that time, the revenues from drug selling accounted for 40–50% of the total revenues of public hospitals. However, since price-setting arrangements for market-based medical services were announced, the central government has not yet presented a definitive attitude towards these mark-ups but has encouraged local governments to be cautious about pricing medicines.
4.1 Conclusions
To improve equality of access to basic medical services, achieve the expected effect of reducing individuals’ financial risks through health insurance, prevent insurance funds from being abused, and improve the performance and quality of medical services in addition to accelerating the reform of payment methods to replace the current FFS, the Chinese government should also accelerate the price-setting reform of drug and medical services and establish a new pricing mechanism where market competition helps to form a reference price and insurance funds determine actual prices through negotiation with all stakeholders. The Chinese government should also address the system of remuneration of medical personnel in public hospitals to ensure a sound economic incentive that promotes good performance and efficiency. Some researchers assert that salaries should be greatly increased and directly allotted by the government’s fiscal budget (Zhong, Reference Zhong2015), while others propose the introduction of ‘strategic purchasing’ to encourage competition-based and performance-based incentives (Gu, Reference Gu2013). A debate over these two strategies is currently underway, causing headaches for top-level policy makers in the central government.
In contemporary China, such explorations of specific reform strategies remain in their infancy, and we will need to wait to observe how such debates are resolved. However, further in-depth research should be conducted to determine which approach is better in theory, what specific regulations and policies should be formulated and how practices should be evaluated in the context in which policies are implemented in China. All these aims will constitute the objectives of future research.
Acknowledgements
This research was supported by grants from the National Natural Science Foundation of China (NSFC 71734005). The authors would like to thank Andrew Podger, Xin Gu, Xun Wu, Chuanhao Tian for their heuristic and helpful suggestions and Shu Chen for her assistance in data analysis. Finally, thanks for data support from the anonymous hospital and local Health Bureau.