


1. Introduction
Recently, fiscal policy has become a popular policy option for overcoming severe recessions. In the aftermath of the financial crisis and the Great Recession, for example, many advanced and emerging countries have implemented several fiscal policies. It is therefore important to understand the consequences of fiscal policy. This study attempts to address this issue by exploring the relationship between fiscal policy and external balances, also known as the “twin deficit hypothesis,” which has been extensively discussed due to its significant policy implications. In the USA, for example, the Trump administration increased government spending and introduced huge tax cuts. Consequently, the US budget deficits grew. Simultaneously, that administration attempted to reduce trade deficits. The traditional twin deficit hypothesis implies that these two goals are mutually exclusive.
There is no consensus, although the hypothesis has significant policy implications for recent economic conditions. In the USA, for example, Monacelli and Perotti (Reference Monacelli and Perotti2010) support the traditional twin deficit hypothesis; however, Kim and Roubini (Reference Kim and Roubini2008) support the opposite in the USA, meaning that budget deficits cause trade surpluses, referred to as “twin divergence hypothesis.” Furthermore, an extensive body of literature, including Leachman and Francis (Reference Leachman and Francis2002) and Mann (Reference Mann2002), has identified structural changes in the relationship between budget balances and external balances. However, several studies, such as those by Roubini (Reference Roubini1988), Chinn and Prasad (Reference Chinn and Prasad2003), Monacelli and Perotti (Reference Monacelli and Perotti2010) and Kim and Roubini (Reference Kim and Roubini2008), have ignored these structure breaks or only focused on the post-Bretton Woods era in order to avoid the effects of the exchange rate regime shift. However, it is insufficient to consider only the post-Bretton Woods periods, because some studies have found multiple structural breaks in the relationship between budget balances and external balances. Particularly, in the early 1990s in the US, Mann (Reference Mann2002) reveals multiple structural breaks.
Using the post-World War II US data, I estimate the time-varying structural vector autoregressive (TVP-VAR) model proposed by Primiceri (Reference Primiceri2005) to evaluate the effects of multiple structural changes on the effects of budget balances on external balances. According to Monacelli and Perotti (Reference Monacelli and Perotti2010), an identified budget deficit shock, such as in Kim and Roubini (Reference Kim and Roubini2008), can be biased and cause us to draw incorrect conclusions. They propose using government spending shocks and consequent budget deficits as an alternative approach to avoiding this issue. Following their assertion, I use Blanchard and Perotti (Reference Blanchard and Perotti2002) method for identifying government spending shocks and consequent budget deficits. The empirical results reveal significant time-varying effects of government spending on trade balances: (1) an increase in government spending and the consequent budget deficits tend to cause trade deficits in the Bretton Woods era; (2) in contrast, an increase in government spending tends to induce trade surpluses in the post-Bretton Woods era; and (3) with the exceptions of the 1980s and 2010s, an increase in government spending causes trade deficits under a floating exchange regime. The empirical results (1) and (2) indicate that the traditional twin deficit hypothesis holds under a fixed exchange regime, whereas the twin divergence hypothesis holds under a floating exchange rate regime. Result (3) indicates that the relationship between the budget balances and trade balances depends not only on exchange rate regimes but also on other factors.
As Gali et al. (Reference Gali, López-Salido and Vallés2007) proposed, I constructed a New Keynesian open economy model that incorporated rule-of-thumb (ROT) consumers to provide some insights into the empirical results. The response of the monetary authority to inflation is the key to comprehending the difference across exchange rate regimes (results (1) and (2)). According to the model, an increase in government spending causes an increase in aggregate demand, which puts upward pressure on inflation. Under a floating exchange rate regime and the usual Taylor rule, the real interest rate increases as the monetary authority raises the nominal interest rate in response to inflation, thus crowding out Ricardian consumer consumption. Though ROT consumers’ consumption increases in response to an increase in government spending, total aggregate consumption decreases in the reasonably calibrated model. Under a fixed exchange regime, however, the monetary authority’s first goal is stabilizing the nominal exchange rate. Therefore, the monetary authority either does not respond to inflation or offers a limited response to it. Consequently, the real interest rate increases less than it would under a floating exchange rate regime. Thus, Ricardian consumers reduce their consumption less than in the floating exchange rate case. In contrast to the case of a floating exchange rate, there could be a positive response in terms of aggregate consumption in the case of a fixed exchange rate. Thus, under a fixed exchange rate regime, trade balances can deteriorate because the positive response of aggregate demand stimulates demand for imported goods.
Additionally, the gradually adjusted tax is a potential channel to explain exceptions in the 1980s. In the 1980s, the Reagan administration implemented huge fiscal stimulus programs, such as tax cuts. When taxes are less sensitive to an increase in government spending in order to balance the budget, ROT consumers are stimulated to consume more because their disposable income increases. When consumption increases, imports increase, and trade balances deteriorate even in the floating exchange rate regime. The zero lower bound situation could cause the exceptions in the 2010s. At the zero lower bound, the monetary authority can use forward guidance as an unconventional monetary policy. In this situation, the monetary authority has committed to maintaining zero policy rate for some future periods. It cannot increase its policy rate in response to inflation caused by increased government spending. Thus, Ricardian consumers increase their consumption, stimulating imports, and trade balances may deteriorate.
Extensive empirical literature exists on the relationship between budget deficits and trade deficits; however, the results are mixed at best. Using single equation approaches, some studies, such as those conducted by Roubini (Reference Roubini1988), and Chinn and Prasad (Reference Chinn and Prasad2003), support the twin deficit hypothesis. However, Gruber and Kamin (Reference Gruber and Kamin2007) provide evidence that the effect of budget deficits on current account deficits is small and statistically insignificant. Using structural VAR models, several studies have also yielded mixed results. On the one hand, Corsetti and Müller (Reference Corsetti and Müller2006), Kim and Roubini (Reference Kim and Roubini2008), Müller (Reference Müller2008), and Enders et al. (Reference Enders, Müller and Scholl2011) support the twin divergence hypothesis with US data. On the other hand, Monacelli and Perotti (Reference Monacelli and Perotti2010), Beetsma et al. (Reference Beetsma, Giuliodori and Klaassen2008), and Ravn et al. (Reference Ravn, Schmitt-Grohé and Uribe2007) support the twin deficit hypothesis. Moreover, some studies emphasize the importance of economic conditions. For instance, Corsetti and Müller (Reference Corsetti and Müller2006) demonstrate the importance of the degree of openness. They show that the effects of budget deficits on current account deficits are limited in less open countries, such as the USA. However, in open economies, such as Canada, budget deficits typically lead to trade deficits. Studies utilizing country panel data, such as Corsetti et al. (Reference Corsetti, Meier and Müller2012c) and Ilzetzki et al. (Reference Ilzetzki, Mendoza and Végh2013), show that the effects of government spending shocks on trade balances (or the current account) are contingent on exchange rate regimes and financial market conditions. Corsetti et al. (Reference Corsetti, Meier and Müller2012c) demonstrate that twin deficits are prevalent under a fixed exchange rate regime; however, the opposite is true under a floating exchange rate regime. Using OECD panel data, Born et al. (Reference Born, Juessen and Müller2013) also indicate the significance of a nominal exchange rate regime in determining the relationship between fiscal policy and trade balance.
Several studies show that, at least in the USA, there are structural breaks in the relationship between budget deficits and external deficits. For example, Leachman and Francis (Reference Leachman and Francis2002) argue that the collapse of Bretton Woods significantly altered the relationship between budget balances and external balances. According to Mann (Reference Mann2002), this relationship has evolved since the early 1990s. Nevertheless, most empirical studies do not systematically evaluate the effects of structural breaks. Early studies did not consider the effects of structural changes. They combined Bretton Woods data with post-Bretton Woods data and estimated equations. Moreover, recent VAR studies only examine the post-Bretton Woods era (periods after 1973 or 1980) to avoid the effects of structural changes caused by the exchange rate regime shift. In contrast to previous studies, I use the TVP-VAR model to consider the effects of structural breaks explicitly.
TVP-VAR is popular for capturing structural changes and time-varying relations. Specifically, Cogley and Sargent (Reference Cogley and Sargent2005) and Primiceri (Reference Primiceri2005) attempt to capture the time-varying effects of monetary policy. Using the TVP-VAR model, Benati and Mumtaz (Reference Benati and Mumtaz2007) have recently investigated the time-varying driving force of the US economy with the TVP-VAR model. Furthermore, Baumeister and Peersman (Reference Baumeister and Peersman2013) have studied the time-varying effects of an oil shock on the US economy. This methodology has been used in a few fiscal policy studies. Kirchner et al. (Reference Kirchner, Cimadomo and Hauptmeier2010) employed the TVP-VAR and recursive identification method to examine the time-varying effects of government spending shocks on the EU economy. Moreover, Pereira and Lopes (Reference Pereira and Lopes2010) use the TVP-VAR and nonrecursive identification method to identify US tax and government spending shocks. Klein and Linnemann (Reference Klein and Linnemann2019) utilize the time-varying VAR model to investigate the time-varying effects of government spending in the US.
These studies provide significant time-varying effects of fiscal policy on macroeconomic variables. However, most TVP-VAR study focuses on domestic variables, such as consumption. In contrast to these studies, I focus on external balances, which are an additional crucial aspect of macroeconomics. Based on a small-scale DSGE model, I provide structural interpretations in order to comprehend the time-varying relationship between fiscal policy and external balances. The model suggests that the policy mix of spending, tax, and monetary policy is important. In previous literature, these channels have not been extensively studied.
The remaining sections of this paper are structured as follows. Section 2 explains the econometric method and data. Section 3 shows the estimated results. Section 4 discusses potential channels for understanding empirical facts using a simple New Keynesian small open economy model. Section 5 concludes the paper.
2. Econometric model, data, and identification
This section provides detailed descriptions of a TVP-VAR model and the data that I employ. Lastly, I discuss the strategy to identify an exogenous shock.
2.1 Econometric model
Consider the following reduced-form VAR model.
 \begin{equation} y_{t}=c_{t}+B_{1,t}y_{t-1}+\cdots +B_{k,t}y_{t-k}+u_{t} \quad \quad t=1,\cdots T \end{equation}
where
 $y_{t}$
is an
 $n\times 1$
vector of the endogenous variables,
 $c_{t}$
is an
 $n\times 1$
vector of time-varying coefficients related to the constant terms,
 $B_{j,t}$
,
 $j=1,\cdots,k$
are
 $n\times n$
vectors of time-varying coefficients,
 $u_{t}$
are unobserved shocks with mean zero and the variance–covariance matrix
 $\Omega _{t}$
, and
 $n$
is the number of endogenous variables. I allow not only time-varying coefficients but also heteroskedastic innovations following Primiceri (Reference Primiceri2005) and Cogley and Sargent (Reference Cogley and Sargent2005) to capture structural changes as well as change in underlying stochastic distributions in the model.Footnote
1
Using a triangular factorization, the variance–covariance matrix
 $\Omega _{t}$
can be factorized as follows:
 \begin{equation} A_{t}\Omega _{t}A_{t}'=\Sigma _{t}\Sigma _{t}' \end{equation}
where
 $A_{t}$
is the lower triangular matrix with ones on main diagonal and
 $\Sigma _{t}$
is the diagonal matrix given by
 \begin{align*} A_{t}= \left[\begin{array}{c@{\quad}c@{\quad}c@{\quad}c} 1 & 0 & \cdots & 0 \\ \alpha _{21,t} & 1 & \ddots & \vdots \\ \vdots &\ddots & \ddots & 0 \\ \alpha _{n1,t} &\cdots & \alpha _{nn-1,t} & 1 \end{array}\right], \quad \quad \quad \Sigma _{t}= \left[\begin{array}{c@{\quad}c@{\quad}c@{\quad}c} \sigma _{1,t} & 0 & \cdots & 0 \\ 0 & \sigma _{2,t} & \ddots & \vdots \\ \vdots &\ddots & \ddots & 0 \\ 0 &\cdots & 0 & \sigma _{n,t} \end{array}\right] \end{align*}
The equation (1) can be rewritten with the factorization as follows:
 \begin{align} y_{t} & = c_{t}+B_{1,t}y_{t-1}+\cdots +B_{k,t}y_{t-k}+A_{t}^{-1}\Sigma _{t}\varepsilon _{t}\nonumber\\[3pt] &\quad Var(\varepsilon _{t})=I_{n} \end{align}
where
 $Var$
is a variance–covariance matrix and
 $I_{n}$
denotes an
 $n\times n$
identity matrix. Stacking in a vector
 $B_{t}$
all the time-varying coefficients in equation (3) leads the following relation.
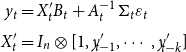 \begin{align} y_{t}&=X_{t}'B_{t}+A_{t}^{-1}\Sigma _{t}\varepsilon _{t} \nonumber\\[3pt] X_{t}'&=I_{n}\otimes [1,y'_{\!\!t-1},\cdots, y'_{\!\!t-k}] \end{align}
where
 $\otimes$
is the Kronecker product.
The evolution of the state vector of coefficients
 $B_{t}$
,
 $\alpha _{t}$
the collection of the nonzero and nonone elements of
 $A_{t}$
(stacked by row) and
 $\sigma _{t}$
, the collection of the diagonal elements of
 $\Sigma _{t}$
are specified as follows:
 \begin{equation} B_{t}=B_{t-1}+\nu _{t} \end{equation}
 \begin{equation} \alpha _{t}=\alpha _{t-1}+\zeta _{t} \end{equation}
 \begin{equation} \log \sigma _{t}=\log \sigma _{t-1}+\eta _{t} \end{equation}
 $B_{t}$
and
 $\alpha _{t}$
follow random walks and
 $\sigma _{t}$
is assumed to follow geometric random walks.Footnote
2
All those processes are similar to Primiceri (Reference Primiceri2005) and Kirchner et al. (Reference Kirchner, Cimadomo and Hauptmeier2010).
The joint distribution of innovations of
 $\varepsilon _{t}$
,
 $B_{t}$
,
 $\alpha _{t}$
, and
 $\sigma _{t}$
is assumed to be joint normal and its variance–covariance matrix is given by
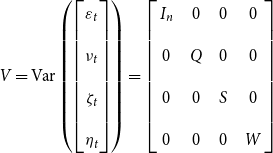 \begin{equation} V=\text{Var} \begin{pmatrix} \begin{bmatrix} \varepsilon _{t} \\ \\[-8pt]\nu _{t} \\ \\[-8pt] \zeta _{t} \\ \\[-8pt] \eta _{t} \end{bmatrix} \end{pmatrix} = \left[\begin{array}{c@{\quad}c@{\quad}c@{\quad}c} I_{n} & 0 & 0 & 0 \\ \\[-8pt] 0 & Q & 0 & 0 \\ \\[-8pt] 0 & 0 & S & 0 \\ \\[-8pt] 0 & 0 & 0 & W \end{array}\right] \end{equation}
The block diagonal assumption of
 $V$
is not essential but it has two desired properties. The first one is reducing the number of parameters to be estimated. Allowing correlations among innovations is easily implemented with small modifications but it gives an over-parametrization problem. The block diagonal assumption for
 $V$
prevents ill-identified parameters. The second advantage is the structural interpretation. If all innovations are correlated, it is not easy to identify the meaning of shocks.Footnote
3
Additionally,
 $S$
is assumed to be the block diagonal matrix as in Primiceri (Reference Primiceri2005) and Baumeister and Peersman (Reference Baumeister and Peersman2013).Footnote
4
The assumption implies that the contemporaneous relations among variables evolve independently in each equation. It facilitates estimating
 $A_{t}$
row by row, which simplifies the estimation algorithm.Footnote
5
2.2 Estimation method
In this section, the estimation algorithm and the choice of the prior are briefly described. The main algorithm is based on Primiceri (Reference Primiceri2005) and Del Negro and Primiceri (Reference Del Negro and Primiceri2015) with minor modifications for the calibration of the priors.Footnote 6 As mentioned in Primiceri (Reference Primiceri2005), the Bayesian method with Gibbs sampling is a suitable way to estimate time-varying coefficients models. Gibbs sampling is conducted with the following steps.
Step 1: Volatility states
 $\mathbf{\Sigma _{t}}$
Conditional on the data,
 $B_{t}$
,
 $A_{t}$
, and
 $V$
, the measurement equation (4) is nonlinear and non-Gaussian. Fortunately, it can be easily converted to a linear one by squaring and taking the log of each element. However, the transformed system is still non-Gaussian, making it difficult to use the standard smoother. The transformed system can be approximated to a linear-Gaussian system using the method proposed by Kim et al. (Reference Kim, Shephard and Chib1998) and mixture indicators
 $s$
. It facilitates the application of the standard smoother proposed by Carter and Kohn (Reference Carter and Kohn1994) to the final approximated system to draw
 $\Sigma _{t}$
.
Step 2: VAR coefficients
 $\mathbf{B_{t}}$
: Conditional on the data,
 $A_{t}$
,
 $\Sigma _{t}$
, and
 $V$
, the measurement equation (4) is standard linear-Gaussian models. As shown in Carter and Kohn (Reference Carter and Kohn1994), VAR coefficients can be drawn from the Kalman filter and backward recursion.
Step 3: Covariance states
 $\mathbf{A_{t}}$
: Conditional on the data,
 $B_{t}$
,
 $\Sigma _{t}$
, and
 $V$
, the measurement equation (4) can be rewritten as
 $A_{t}u_{t}=\Sigma _{t}\varepsilon _{t}$
, where
 $u_{t}$
is observable. This is a standard linear-Gaussian system with independent equations given the lower triangular matrix
 $A_{t}$
and the block diagonal matrix
 $S$
. The Kalman filter and backward recursion can be applied to sample
 $A_{t}$
equation by equation.
Step 4: Hyperparameters
 $\mathbf{V}$
: Conditional on
 $B_{t}$
,
 $A_{t}$
,
 $\Sigma _{t}$
, and data, sampling of the hyperparameter
 $V$
is standard because each block of
 $V$
has an independent inverse-Wishart posterior given the proper prior. Given data,
 $\Sigma _{t}$
,
 $B_{t}$
,
 $A_{t}$
, and
 $V$
, mixture indicators
 $s$
can be finally drawn.
Gibbs sampling with sufficiently large iterations and long burn-in periods delivers a realization from the joint posterior distribution. In this paper, I generate
 $200,000$
draws and burn-in the first
 $150,000$
. Of the remaining
 $50,000$
, every
 $10$
th draws is kept to mitigate the autocorrelation of draws similar to Kirchner et al. (Reference Kirchner, Cimadomo and Hauptmeier2010).
The choice of the priors is fairly standard as in Primiceri (Reference Primiceri2005), Benati and Mumtaz (Reference Benati and Mumtaz2007) and Koop et al. (Reference Koop, Leon-Gonzalez and Strachan2009), but there are minor differences. First, the selection of degrees of freedom of the priors is more conservative. I allow the minimum number for the priors to be proper as in Benati and Mumtaz (Reference Benati and Mumtaz2007) and Kirchner et al. (Reference Kirchner, Cimadomo and Hauptmeier2010) to minimize effects of the priors. Unlike most TVP-VAR studies using “training data,” I use the full-sample ordinary least square (OLS) estimators to calibrate the priors following Canova and Ciccarelli (Reference Canova and Ciccarelli2009). There are two reasons to use the full-sample method. First, some initial data points (usually
 $8$
–
 $10$
years) should be sacrificed with the trained data method; that is, some data points of Bretton Woods system are discarded. A short sample for the Bretton Woods can mislead the effects of a fixed exchange rate regime. Furthermore, the full-sample method minimizes the uncertainty involved in calibrating the priors properly as mentioned in Canova and Ciccarelli (Reference Canova and Ciccarelli2009).Footnote
7
Details are in Appendix B. Also, the VAR model includes four lags based on Akaike Information criteria.
2.3 Data
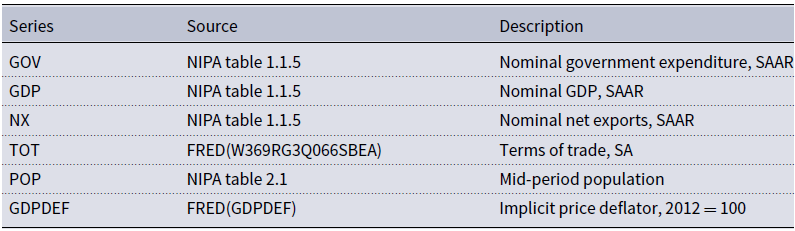
The TVP-VAR model consists of four variables of the US economy: the log of per capita real government spending (GOV), the log of per capita real GDP (GDP), the net export to GDP ratio (NX/GDP), and the log of terms of trade (TOT).Footnote 8 The sample begins in 1947.Q1 and ends in 2019.Q2. Government spending and GDP are deflated with a GDP deflator and divided by the mid-period population. Government spending is the general government spending that includes the general government’s consumption and investment. Net exports are defined by the difference between exports and imports, which means that negative net exports are equivalent to the trade deficit. TOT is the ratio of the export price to the import price, which implies that an increase in tTOT means there has been an appreciation in the value of the US dollar measured in real terms. All variables are taken from the Bureau of Economic Analysis (BEA) except the TOT and the GDP deflator, which are from FRED. I use linearly detrended data to focus on cyclical components following Pereira and Lopes (Reference Pereira and Lopes2010).Footnote 9 Table 1 summarizes source and description of data.
Data sources (1947.1Q to 2019.2Q)
2.4 Identification and interpretation
To study the relationship between budget deficits and trade deficits in the VAR model, I need to identify related government budget deficit shocks. Following Monacelli and Perotti (Reference Monacelli and Perotti2010), I try to identify government spending shocks rather than identifying budget deficit shocks directly. According to Monacelli and Perotti (Reference Monacelli and Perotti2010), the budget deficit shocks such as in Kim and Roubini (Reference Kim and Roubini2008) have several undesirable and counterfactual features. To remedy those, they suggest using positive government spending shocks and consequent budget deficits. Following their claim, I use government spending shocks to investigate the hypothesis. To identify government spending shocks, I use the following assumption: government spending does not respond to other variables (GDP, NX/GDP, and TOT) within a quarter. The identification scheme is widely adopted in VAR studies on fiscal policy such as Fatas and Mihov (Reference Fatas and Mihov2001), Blanchard and Perotti (Reference Blanchard and Perotti2002), and Monacelli and Perotti (Reference Monacelli and Perotti2010). Kirchner et al. (Reference Kirchner, Cimadomo and Hauptmeier2010) use this identification method in their TVP-VAR study on fiscal policy in the EU. With the identification scheme, the exogenous government spending shock is easily identified by putting government spending first in the system. As pointed out by Monacelli and Perotti (Reference Monacelli and Perotti2010), this method can mitigate the potential bias that results from the budget deficit shocks identified by the short-run restrictions in VAR models.
 \begin{equation} u_{t}=C_{t}\varepsilon _{t}, \quad \quad C_{t}C_{t}'=\Omega _{t} \end{equation}
where
 $C_{t}$
is the mapping between the reduced form innovations
 $u_{t}$
and the structural shocks
 $\varepsilon _{t}$
. By definition of
 $A_{t}$
and the identification strategy,
 $C_{t}=A_{t}^{-1}\Sigma _{t}$
as described in Primiceri (Reference Primiceri2005).Footnote
10
3. Estimation results
In this section, I show the estimated time-varying impulse response to a 1% increase in government spending. Figure 1 presents the time profile of responses for trade balances. The profile shows that the responses of trade balances are generally below zero in the Bretton Woods era,Footnote 11 but they started to rise after the collapse of the Bretton Woods (in 1973) and turn positive in the mid- and late 1970s. However, the response begins to decrease and turns negative in the early 1980s. The sign of the response changed from negative to positive after the late 1980s. In the 2010s, the responses turn from positive to negative. The time-varying pattern is clearer in Figure 2. The median responses of trade balances are negative in most horizons and revert back to the trend with a small overshooting under a peg system. However, trade surpluses are more common in most periods of the post-Bretton Woods era except for some periods in the 1980s and 2010s.
The median response of NX/GDP to a 1% increase in government spending. Solid line means the median responses and shaded area means the 68% confidence bands. %p in y-axis means percentage point changes.
The median response of the variables to a 1% increase in government spending. % in y-axis means percentage changes and %p means percentage point changes.
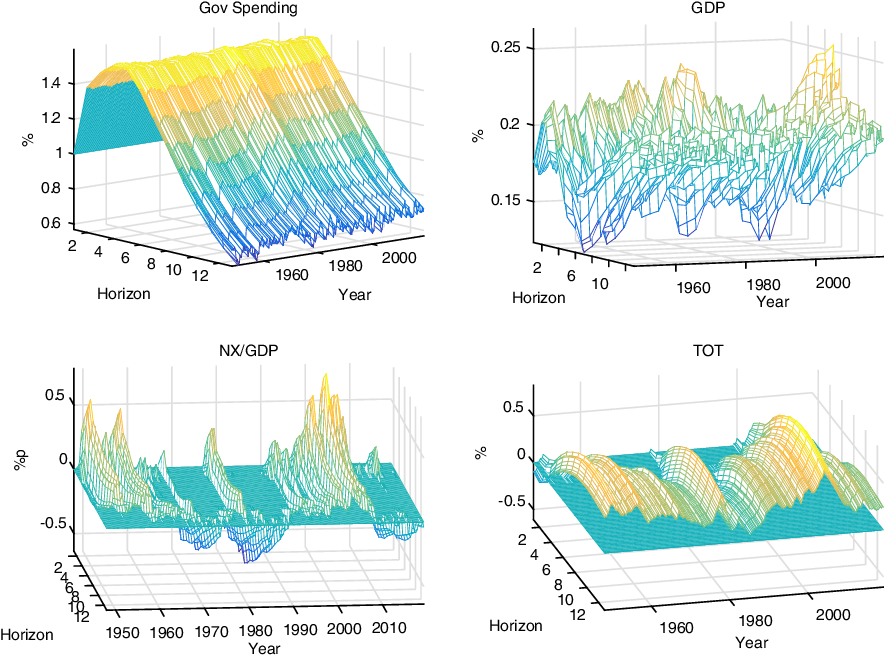
To sum up, the time-varying pattern of the response of the trade balance indicates that a government spending shock generally induces trade deficits under a fixed exchange rate regime, whereas trade surpluses are induced under a flexible exchange rate regime.Footnote 12 In addition, TVP-VAR delivers the following new finding: the responses in some periods in the 1980s and 2010s are abnormal. Despite the adoption of a flexible exchange rate regime in these periods, trade deficits are caused by a positive government spending shock.
The response of TOT is stable across the year: slight depreciation initially then appreciation. Figure 2 clearly shows that the response of TOT is negative at first (except for some periods in the early 1950s and the mid-2000s) but it turns positive soon and reverts back to the trend very slowly. This pattern is also similar to the time-invariant VAR results. Figure 2 also shows the time-varying responses of GDP to government spending. The size of the initial response is almost the same in every period, which is in line with Pereira and Lopes (Reference Pereira and Lopes2010). Pereira and Lopes (Reference Pereira and Lopes2010) also find that the stimulus effects of government expenditure do not vary so much over time in their TVP-VAR study. They argue that rolling sample estimations may exaggerate the actual drift, especially the effects of spending shock, because of the lack of a smoothing process. VAR models with subsamples are also sensitive to the choice of subperiods. Thus, earlier studies such as Perotti (Reference Perotti2004) and Bilbiie et al. (Reference Bilbiie, Meier and Müller2008) possibly overestimate the instability of the effects of government expenditure. Additionally, Figure 2 shows the response of government spending to its own shocks. The response of government spending seems to be stable. It implies that the time-varying pattern of government spending is not the source of the time-varying response of trade balances.
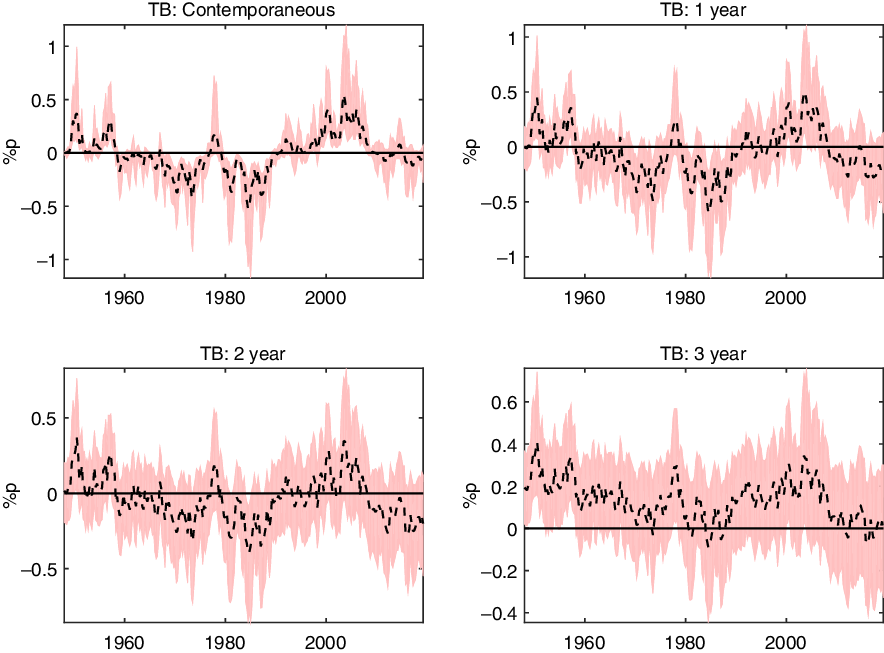
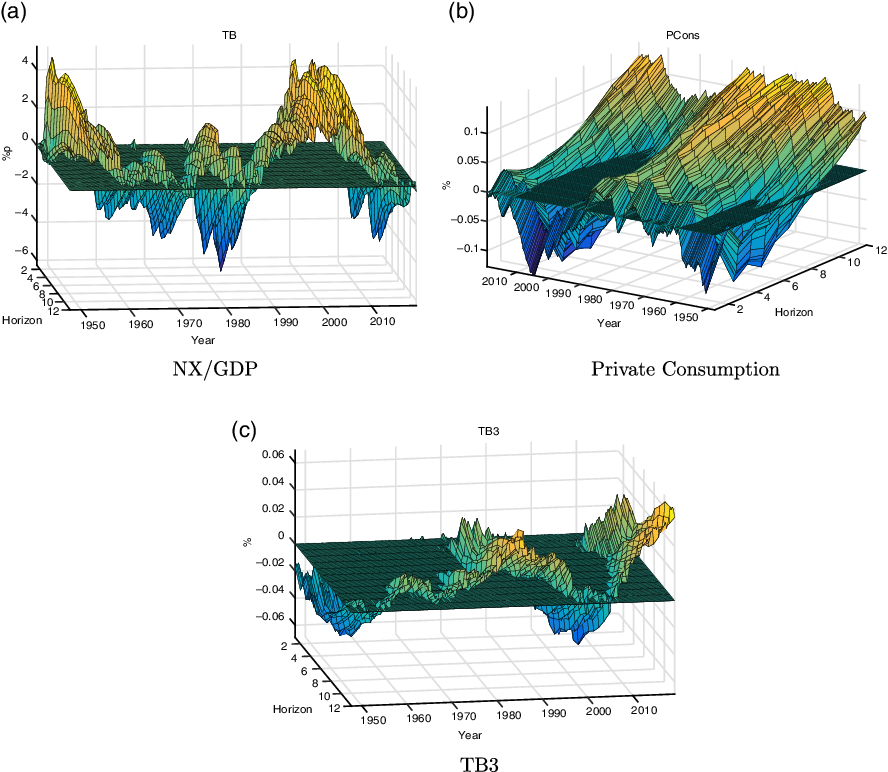
For robustness checks, I estimate two alternative TVP-VAR models. First, I estimate six-variable TVP-VAR model: GOV, GDP, NX/GDP, TOT, private consumption (Pcon), and 3 month t-bill rate (TB3). The last two variables are additional variables and those are closely related to the theoretical model in Section 4. Figure 3 depicts the results for trade balances, private consumption, and 3-month treasury bill rates.Footnote 13 Figure 3 shows that the responses of NX/GDP are not different from the results in the baseline model. The responses of NX/GDP tend to be negative in the Bretton Wood era, while those tend to be positive in the post-Bretton Wood era. However, there are some exceptions in 1980s and in the recent zero lower bound periods. All those are consistent with the baseline results. Furthermore, the responses of private consumption tend to be positive in the Bretton Woods and those in the post-Bretton Woods are negative. Those are consistent with the theoretical predictions in Section 4. I will discuss this later.
Response of NX/GDP, private consumption and interest rates in six-variable VAR Note: The median response of the variables to a 1% increase in government spending. % in y-axis means percentage changes and %p means percentage point changes.
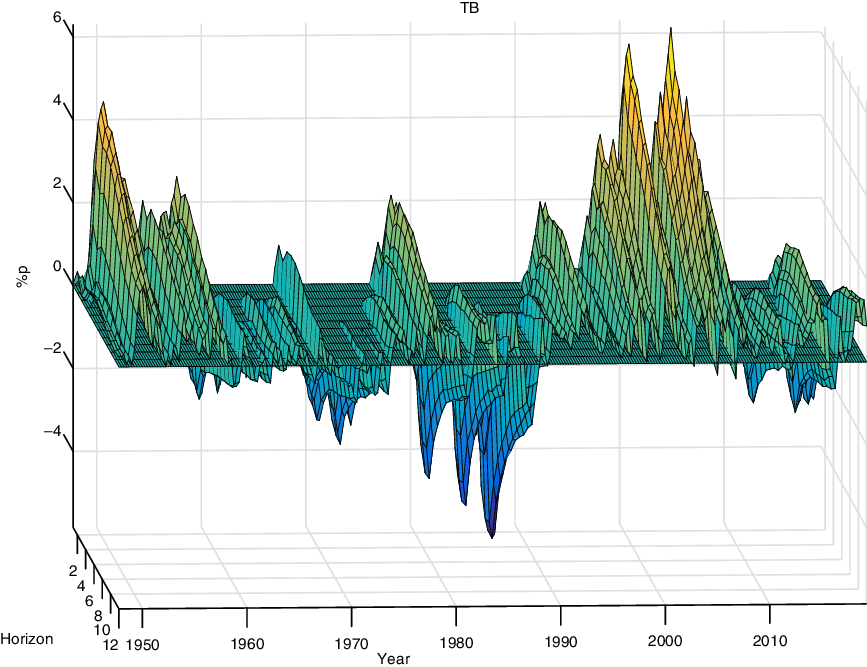
Additionally, I estimate TVP-VAR model with tax receipts. TVP-VAR with tax receipts is useful for controlling the effects of the government budget constraint. Tax receipts data comes from BEA.Footnote 14 I divide nominal tax receipts by the mid-period population and deflate that using GDP deflator. Figure 4 shows the response of NX/GDP. The responses are similar to those in the baseline model. Trade deficits are caused by positive government spending shocks in the Bretton Woods era, while trade surpluses are caused by positive government spending shocks in the post-Bretton Woods era. The exceptions in 1980s and in the 2010s are still observed. Those two models confirm that the results are robust to including additional variables in TVP-VAR models.
The median response of the variables to a 1% increase in government spending in TVP-VAR with tax receipts. %p means percentage point changes.
4. Discussion: A new Keynesian perspective
From the results of the TVP-VAR, I find three empirical facts about the behavior of the trade balances. In general, trade deficits are caused by government spending shocks under a peg system. In contrast to a peg system, trade surpluses are caused by an increase in government spending shocks under a floating system. Furthermore, the responses of trade balances in the 1980s and 2010s are exceptional: trade deficits take place in response to a positive government spending shock in spite of a floating exchange rate regime.
In order to provide potential explanations for the empirical findings, I construct a New Keynesian small open economy as a limiting case of two-country dynamic stochastic general equilibrium models.Footnote 15
4.1 Description of the theoretical model
The model is based on the open economy New Keynesian model with government spending proposed by Corsetti et al. (Reference Corsetti, Meier and Müller2012a) and Corsetti et al. (Reference Corsetti, Kuester and Müller2011).
4.1.1 Households
There is a continuum of households
 $[0, 1]$
which consists of two types of agents: asset holders and nonasset holders. Asset holders (
 $1-\lambda$
fraction of households) trade the one-period domestic bonds and international bonds given their price. While nonasset holders (
 $\lambda$
fraction of households) do not participate in either domestic or international bond markets. This assumption is similar to that found in Gali et al. (Reference Gali, López-Salido and Vallés2007) and Bilbiie et al. (Reference Bilbiie, Meier and Müller2008).
A representative asset holder-indexed with a subscript
 $A$
-maximizes the lifetime utility subject to budget constraints. The lifetime utility is given by
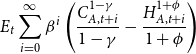 \begin{equation} E_{t}\sum _{i=0}^{\infty }\beta ^{i}\left(\dfrac{C_{A,t+i}^{1-\gamma }}{1-\gamma }-\dfrac{H_{A,t+i}^{1+\phi }}{1+\phi }\right) \end{equation}
where
 $C_{A,t}$
is consumption in time
 $t$
and
 $H_{A,t}$
is labor supply.
 $\beta$
is the discount factor of the representative asset holder,
 $\gamma \gt 0$
is the relative risk-aversion coefficient and
 $\phi \gt 0$
is the inverse Frisch elasticity of labor supply. The period-by-period budget constraint is as follows:
 \begin{equation} P_{t}C_{A,t}+R_{t}^{-1}A_{t+1}+R_{F,t}^{-1}\frac{B_{t+1}}{\varepsilon _{t}}=W_{t}H_{A,t}+A_{t}+\frac{B_{t}}{\varepsilon _{t}}+\Gamma _{t}-T_{t} \end{equation}
 $P_{t}$
is the corresponding price index to the consumption good,
 $A_{t}$
is the one-period nominal domestic government bonds and
 $R_{t}$
is the corresponding gross nominal interest rate.
 $B_{t}$
is the one-period nominal international bonds,
 $R_{F,t}$
is the corresponding gross nominal interest rate, and
 $\varepsilon _{t}$
is the nominal exchange rate measured in units of foreign currency per domestic currency. Moreover,
 $W_{t}$
is the nominal wage,
 $\Gamma _{t}$
is the profits from intermediate good firms, and
 $T_{t}$
is the nominal lump-sum transfers. It is assumed that domestic bonds are not traded in international financial markets as in a standard small open economy model such as Gertler et al. (Reference Gertler, Gilchrist and Natalucci2007). Since I assumed the imperfect international financial market, a closing technique is needed to ensure the stationarity of the model. Following Schmitt-Grohé and Uribe (Reference Schmitt-Grohé and Uribe2003) and Kollmann (Reference Kollmann2002), I assumed that
 $R_{F,t}$
depends on the aggregate level of foreign bonds:
 \begin{equation} R_{F,t}=R_{t}^{*}-\chi \frac{B_{t+1}}{\varepsilon _{t}P_{t}Y_{t}} \end{equation}
 $\chi$
is the debt-elasticity of interest rate,
 $R_{t}^{*}$
is the gross world nominal interest rate, and
 $Y_{t}$
is the real GDP. The representative asset holder chooses labor supply, consumption, and quantity of domestic and international bonds to maximize the lifetime utility. The optimality condition for labor supply is given by
 \begin{equation} \frac{W_{t}}{P_{t}}=\frac{H_{A,t}^{\phi }}{C_{A,t}^{-\gamma }} \end{equation}
Also, the optimality conditions for intertemporal choices consumption, domestic, and international bonds are given by
 \begin{equation} C_{A,t}^{-\gamma }=\beta E_{t}\biggl{[}C_{A,t+1}^{-\gamma }R_{t}\frac{P_{t}}{P_{t+1}}\biggr{]} \end{equation}
 \begin{equation} C_{A,t}^{-\gamma }=\beta E_{t}\biggl{[}C_{A,t+1}^{-\gamma }R_{F,t}\frac{\varepsilon _{t}}{\varepsilon _{t+1}}\frac{P_{t}}{P_{t+1}}\biggr{]} \end{equation}
The objective of a representative nonasset holder, indexed with a subscript
 $N$
, is maximizing the instantaneous utility which is given by
 \begin{equation} \frac{C_{N,t}^{1-\gamma }}{1-\gamma }-\frac{H_{N,t}^{1+\phi }}{1+\phi } \end{equation}
where
 $C_{N,t}$
is consumption and
 $H_{N,t}$
is labor supply. Since the representative nonasset holder does not trade bonds and does not have shares of intermediate good firms, consumption is equal to the disposable income, which is the labor income
 $W_{t}H_{N,t}$
less the lump-sum taxes
 $T_{t}$
.
 \begin{equation} P_{t}C_{N,t}=W_{t}H_{N,t}-T_{t} \end{equation}
4.1.2 Final good firms
The final consumption good
 $C_{t}$
is a composite of domestic intermediate goods and foreign intermediate goods which are produced by a continuum of monopolistic competitive domestic firms and foreign firms, respectively. The final good firms operate in perfect competitive markets and try to minimize their expenditures subject to the following aggregation technology:
 \begin{equation} C_{t}=\Biggl{[}(1-\omega )^{\frac{1}{\sigma }}\biggl{(}\biggl{[}\int _{0}^{1}Y_{D,t}(j)^{\frac{\epsilon -1}{\epsilon }}dj\biggr{]}^{\frac{\epsilon }{\epsilon -1}}\biggr{)}^{\frac{\sigma -1}{\sigma }}+\omega ^{\frac{1}{\sigma }}\biggl{(}\biggl{[}\int _{0}^{1}Y_{F,t}(j)^{\frac{\epsilon -1}{\epsilon }}dj\biggr{]}^{\frac{\epsilon }{\epsilon -1}}\biggr{)}^{\frac{\sigma -1}{\sigma }}\Biggr{]}^{\frac{\sigma }{\sigma -1}} \end{equation}
where
 $Y_{D,t}(j)$
is a domestic intermediate good produced by
 $j$
th domestic intermediate good firm and
 $Y_{F,t}(j)$
is a foreign good produced by
 $j$
th foreign intermediate good firm.
 $\omega$
is the proportion of foreign goods in composite good, which can be interpreted as the degree of openness.
 $\sigma$
measures the trade price elasticity and
 $\epsilon$
measures the price elasticity of intermediate goods within the same country. Let me define the domestic composite good
 $Y_{D,t}$
and the foreign composite good
 $Y_{F,t}$
as follows:
 \begin{equation} Y_{D,t}=\biggl{[}\int _{0}^{1}Y_{D,t}(j)^{\frac{\epsilon -1}{\epsilon }}dj\biggr{]}^{\frac{\epsilon }{\epsilon -1}}, \quad \quad \quad \quad Y_{F,t}=\biggl{[}\int _{0}^{1}Y_{F,t}(j)^{\frac{\epsilon -1}{\epsilon }}dj\biggr{]}^{\frac{\epsilon }{\epsilon -1}} \end{equation}
Then expenditure minimization implies that the associated price indexes of
 $Y_{D,t}$
and
 $Y_{F,t}$
are
 \begin{equation} P_{D,t}=\biggl{(}\int _{0}^{1}P_{D,t}(j)^{1-\epsilon }dj \biggr{)}^{\frac{1}{1-\epsilon }}, \quad \quad \quad \quad P_{F,t}=\biggl{(}\int _{0}^{1}P_{F,t}(j)^{1-\epsilon }dj \biggr{)}^{\frac{1}{1-\epsilon }} \end{equation}
The price index of import goods is given by
 \begin{equation} P_{F,t}=\frac{P_{t}^*}{\varepsilon _{t}} \end{equation}
where
 $P_{t}^{*}$
is the foreign aggregate price index. By the similar process, the domestic aggregate price index
 $P_{t}$
is
 \begin{equation} P_{t}=[(1-\omega )P_{D,t}^{1-\sigma }+\omega P_{F,t}^{1-\sigma }]^{\frac{1}{1-\sigma }} \end{equation}
4.1.3 Intermediate good firms
There is a continuum of domestic intermediate good firms
 $[0,1]$
which use the following production technology:
 \begin{equation} Y_{D,t}(j)=H_{t}(j) \end{equation}
where
 $Y_{D,t}(j)$
is the output of
 $j$
th firm and
 $H_{t}(j)$
is the labor demand of
 $j$
th firm. Intermediate good sector is assumed to be imperfectly competitive and each firm sets its own price with Calvo fashion. Thus, the profit-maximizing problem of
 $j$
th firm is as follows:
 \begin{equation} \max E_{t}\sum _{i=0}^{\infty }\xi ^{i}\Lambda _{t,t+i}[ Y_{D,t,t+i}(j)P_{D,t}(j)-W_{t+i}H_{t+i}(j)] \end{equation}
where
 $1-\xi$
is the probability of price adjusting and
 $\Lambda _{t}$
is the stochastic discount factor of the representative asset holder. The optimality condition for each intermediate good firm is given by
 \begin{equation} E_{t}\sum _{i=0}^{\infty }\xi ^{i}\Lambda _{t,t+i}\biggl{[}Y_{D,t,t+i}(j)P_{D,t}(j)-\frac{\epsilon }{\epsilon -1}W_{t+i}H_{t+i}\biggr{]}=0 \end{equation}
Finally, it is assumed that the foreign country has the isomorphic aggregation technology and the law of one price holds at the level of intermediate goods in this model as in Gertler et al. (Reference Gertler, Gilchrist and Natalucci2007) and Corsetti et al. (Reference Corsetti, Kuester and Müller2011).
4.1.4 The Government
The monetary authority adjusts the nominal interest
 $R_{t}$
with the following Taylor-rule under a flexible exchange rate regime.
 \begin{equation} R_{t}=R+\phi _{\pi }(\Pi _{t}-\Pi ) \end{equation}
where
 $R$
is the steady state nominal interest rate,
 $\Pi _{t}=P_{t}/P_{t-1}$
is the CPI inflation, and
 $\Pi$
is the steady state inflation rate. On the other hand, the monetary authority keeps the change in nominal exchange rate zero under a fixed exchange rate regime, which means that the monetary authority follows the rule given by
 \begin{equation} \Delta \varepsilon _{t}=\varepsilon _{t}-\varepsilon _{t-1}=0 \end{equation}
Government spending
 $G_{t}$
is defined by the aggregation of domestic intermediate goods:
 \begin{equation} G_{t}=\biggl{(}\int _{0}^{1}Y_{D,t}(j)^{\frac{\epsilon -1}{\epsilon }}dj\biggr{)}^{\frac{\epsilon }{\epsilon -1}} \end{equation}
With the cost minimization, the associated price index of government spending is
 $P_{D,t}$
. I assumed that government spending is financed by lump-sum taxes
 $T_{t}$
or the one-period government bonds
 $D_{t}$
. Given this assumption, the period-by-period budget constraint of the government is given by
 \begin{equation} R_{t}^{-1}D_{t+1}=D_{t}+P_{D,t}G_{t}-T_{t} \end{equation}
Additionally, it is assumed that government spending follows
 \begin{equation} G_{t}=(1-\psi _{gg})G+\psi _{gg}G_{t-1}+\psi _{gd}\frac{D_{t}}{P_{t-1}}+\eta _{t} \end{equation}
 $0\leq \psi _{gg} \leq 1$
captures the persistence of government spending,
 $\psi _{gd}\leq 0$
means the degree of responsiveness of government spending to real government debts, and
 $\eta _{t}$
is an exogenous shock of government spending. If
 $\psi _{gd}$
is equal to zero, government spending follows a simple
 $AR(1)$
process and does not respond to the level of government debts (no spending reversal).
The adjustment process of tax is assumed to be
 \begin{equation} T_{R,t}=(1-\psi _{tg})G+\psi _{tg}G_{t}+\psi _{td}\frac{D_{t}}{P_{t-1}} \end{equation}
where
 $T_{R,t}=T_{t}/P_{t}$
is real taxes.
 $0\leq \psi _{tg}\leq 1$
captures the responsiveness of tax to the government spending and
 $\psi _{td}\geq 0$
captures the responsiveness of tax to the level of government debts. If
 $\psi _{tg}$
is equal to one, taxes should increase one-for-one in response to increases in government spending. The government spending rule and tax adjustment rule are similar to Corsetti et al. (Reference Corsetti, Kuester and Müller2011) and Corsetti et al. (Reference Corsetti, Meier and Müller2012b).
4.1.5 Equilibrium
In equilibrium, the supply and the demand of each domestic intermediate good firm should match. Given the demand for domestic goods from households and the government and the volume of exports, the following equation must be satisfied.
 \begin{equation} Y_{D,t}(j)=\biggl{(}\frac{P_{D,t}(j)}{P_{D,t}}\biggr{)}^{-\epsilon }\biggl{(}(1-\omega )\biggl{(}\frac{P_{D,t}}{P_{t}}\biggr{)}^{-\sigma }C_{t}+\omega \biggl{(}\frac{P_{D,t}^{*}}{P_{t}^{*}}\biggr{)}^{-\sigma }C_{t}^{*}+G_{t}\biggr{)} \end{equation}
where
 $P_{D,t}^{*}$
is the price index of domestic goods in terms of the foreign currency and
 $C_{t}^{*}$
is the foreign consumption index. Let the aggregate output index
 $Y_{t}$
be
 \begin{equation} Y_{t}=\biggl{(}\int _{0}^{1}Y_{D,t}(j)^{\frac{\epsilon -1}{\epsilon }}dj\biggr{)}^{\frac{\epsilon }{\epsilon -1}} \end{equation}
Using the firm level equilibrium condition and the aggregate output index, the following aggregate relation should hold.
 \begin{equation} Y_{t}=(1-\omega )\biggl{(}\frac{P_{D,t}}{P_{t}}\biggr{)}^{-\sigma }C_{t}+\omega \biggl{(}\frac{P_{D,t}^{*}}{P_{t}^{*}}\biggr{)}^{-\sigma }C_{t}^{*}+G_{t} \end{equation}
Moreover, the following aggregate consumption relation and the labor market clearing condition should be hold.
 \begin{equation} C_{t}=\lambda C_{N,t}+(1-\lambda )C_{A,t}, \quad \quad \quad \quad H_{t}=\lambda H_{N,t}+(1-\lambda )H_{A,t} \end{equation}
Given the assumption that domestic bonds are not traded in international financial markets, the domestic asset market clearing condition is as follows:
 \begin{equation} (1-\lambda )A_{t}=D_{t} \end{equation}
The TOT
 $S_{t}$
which is the ratio of export price to import price and the real exchange rate
 $Q_{t}$
can be defined in these terms:
 \begin{equation} S_{t}=\frac{P_{D,t}}{P_{F,t}}, \quad \quad \quad \quad Q_{t}=\frac{P_{t}\varepsilon _{t}}{P_{t}^*} \end{equation}
Following the definition of the real exchange rate and TOT, increases in
 $Q_{t}$
and
 $S_{t}$
indicate an appreciation of the real exchange rate and TOT (appreciation in the domestic currency measured in real terms). Finally, the trade balance in terms of the steady-state output is as follows:
 \begin{equation} TB_{t}=\frac{1}{Y}\biggl{(}Y_{t}-\frac{P_{t}}{P_{D,t}}C_{t}-G_{t}\biggr{)} \end{equation}
4.2 Calibration
Table 2 summarizes the calibration. The discount factor
 $\beta$
, the risk aversion coefficient
 $\gamma$
, and the inverse Frisch elasticity
 $\phi$
are standard. Trade price elasticity
 $\sigma$
is assumed to be
 $0.7$
, which is in line with Monacelli and Perotti (Reference Monacelli and Perotti2010) and Born et al. (Reference Born, Juessen and Müller2013).Footnote
16
The price stickiness parameter
 $\xi$
is set to be
 $0.75$
. This number is in line with several literature such as Gali and Monacelli (Reference Gali and Monacelli2005).
Calibration
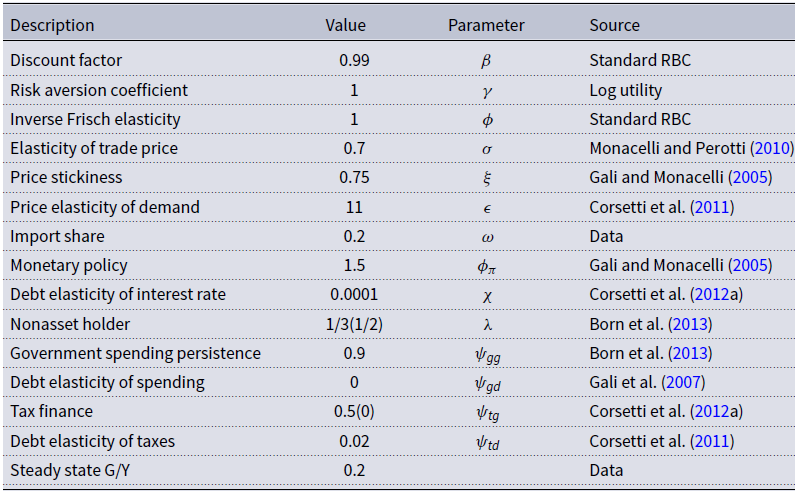
Also, I assume that
 $\epsilon$
is equal to
 $11$
to match
 $10\%$
of the steady state mark up. Taylor coefficient
 $\phi _{\pi }$
is set to be
 $1.5$
which is standard and ensures the rational equilibrium. Following Corsetti et al. (Reference Corsetti, Meier and Müller2012a), I assume the debt-elasticity of interest rate
 $\chi$
is
 $0.0001$
which is also similar to Gertler et al. (Reference Gertler, Gilchrist and Natalucci2007). For the fraction of nonasset holders
 $\lambda$
, I assume
 $1/3$
for the baseline simulation. Corsetti et al. (Reference Corsetti, Meier and Müller2012b) also use the same number and Bilbiie et al. (Reference Bilbiie, Meier and Müller2008) estimate
 $\lambda$
close to
 $1/3$
with
 $1983$
to
 $2004$
US data. Additionally, in order to examine the role of nonasset holders in section 4.4, I use a different number
 $1/2$
for
 $\lambda$
and compare the outcome with the two other results.
The persistence of government spending
 $\psi _{gg}$
is set
 $0.9$
which is standard. For simplicity, I assume that the government spending rule is not sensitive to level of debts (
 $\psi _{gd}=0$
) for the baseline simulation. Moreover, for the baseline simulation, the debt responsiveness for tax
 $\psi _{td}$
is assumed to be
 $0.02$
which is in line with Corsetti et al. (Reference Corsetti, Kuester and Müller2011) and the responsiveness of government spending for tax
 $\psi _{tg}$
is
 $0.5$
which is the same in Corsetti et al. (Reference Corsetti, Meier and Müller2012a). To study the effects of tax-cut in Section 4.4, I also use a different number
 $0$
for
 $\psi _{tg}$
. The steady state share of government spending to output is assumed to be
 $20\%$
and the import share
 $\omega$
is set to be
 $0.2$
to match with US time series data. Finally, for the simulation, the model is linearized around the zero government debt and zero inflation steady state. All foreign variables are assumed to be constant.
4.3 Floating exchange rate regime vs fixed exchange rate regime
In this section, I examine the effects of change in a nominal exchange rate regime on trade balance and TOT. Quantitative results are measured in deviations from the steady state scaled by the steady-state output except TOT and inflation. The response of TOT and inflation are measured in percentage deviations from the steady state.
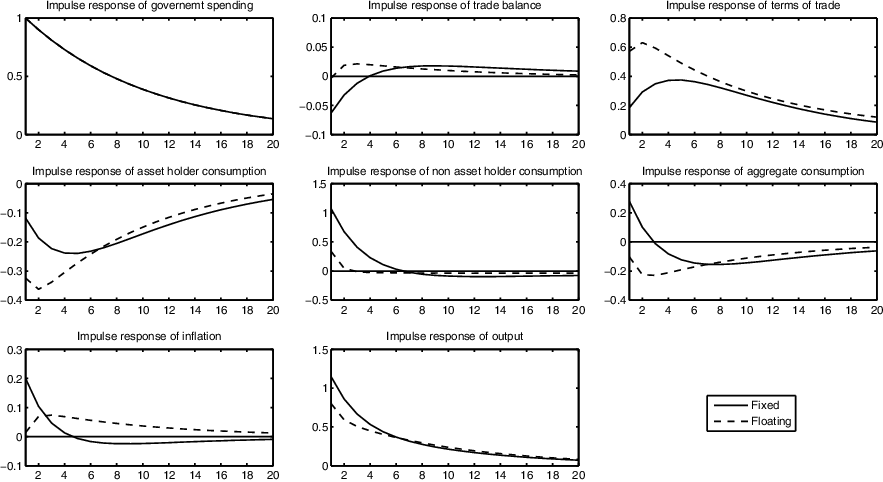
The second panel in the first row in Figure 5 shows the response of the trade balance to increasing government spending by 1% of output. Under a floating exchange rate regime, a trade surplus is caused by an exogenous government spending shock, whereas a trade deficit results from an exogenous government spending shock under a fixed exchange rate regime. Those results are consistent with the empirical results, at least qualitatively. What drives those results? As discussed in Monacelli and Perotti (Reference Monacelli and Perotti2010), two different effects determine the sign of net exports in the standard small open economy New Keynesian model: the absorption effect and the switching effect. The former is generated by the response of the monetary authority to inflation. The monetary authority tends to increase the nominal interest rate, since inflation is boosted by an exogenous government spending shock. Intuitively, the real interest rate increases when the nominal interest rate increases since the Taylor coefficient is greater than
 $1$
and the Fisher relation holds in the standard model. Suppose all consumers are asset holders (
 $\lambda =0$
), the aggregate consumption decreases since the real interest increases, so that imports decline also. As a result, the trade balance improves by the absorption effect.
Impulse responses of the selected variables to government spending shocks under different exchange rate regimes. Results are measured in deviations from the steady state scaled by the steady state output except terms of trade and inflation. The response of terms of trade and inflation are measured in percentage deviations from the steady state.
On the other hand, an exogenous government spending shock makes TOT appreciate, which means that the price of a domestic good relative to a foreign good becomes expensive and households increase their consumption of foreign goods. As a result, the trade balance worsens by the switching effect. Monacelli and Perotti (Reference Monacelli and Perotti2010) shows that if the trade price elasticity
 $\sigma$
is less than 1 with the log utility function, the absorption effect dominates the switching effect. However, if
 $\sigma$
is greater than 1, the opposite result is generated.
In this model, a government spending shock crowds out the asset holders’ consumption and makes TOT appreciate by the similar procedure described above. Specifically, the asset holders’ consumption dynamics are determined by the following equation under a floating exchange rate regime, similar to Corsetti et al. (Reference Corsetti, Kuester and Müller2011).
 \begin{equation} c_{A,t}=-\frac{1}{\gamma }\sum _{i=0}^{\infty }(r_{t+i}-\pi _{t+1+i})=-\frac{1}{\gamma }\sum _{i=0}^{\infty }(\phi _{\pi }\pi _{t+i}-\pi _{t+1+i}) \end{equation}
where lower case letters mean percentage deviations from the steady state and the last equality comes from the Taylor rule.Footnote 17 This equation shows that the asset holders’ consumption depends on the current and entire future inflation path. Because of the positive response of inflation (the first panel in the third row in Figure 5) and the nominal interest rate to a government spending shock, the consumption of asset holders decreases. The first panel in the second row of Figure 5 shows that result. At the same time, a government spending shock boosts output, so that the disposable income of nonasset holders increases. Therefore, the consumption of nonasset holders increases as in Gali et al. (Reference Gali, López-Salido and Vallés2007). The second panel in the second row in Figure 5 shows an increase in the consumption of nonasset holders. However, given the fraction of nonasset holders (1/3), the increase in the nonasset holders’ consumption is not enough to cover the decrease in the asset holder’s consumption. The aggregate consumption consequently decreases (the final panel in the second row in Figure 5). As a consequence, the trade balance can be improved by the absorption effect.
Furthermore, from the asset holders’ optimality condition, the definition of TOT and the real exchange rate, the following equation can be obtained.
 \begin{equation} E_{t}[\Delta c_{A,t+1}]=-\frac{1}{\gamma }(1-\omega )E_{t}[\Delta s_{t+1}]+\frac{1}{\gamma }r_{F,t} \end{equation}
Since the world interest rate
 $R_{t}^{*}$
is assumed to be constant and the debt elasticity (
 $\chi$
) is small,
 $r_{F,t}$
is nearly constant and therefore asset holders’ consumption is closely related with the response of TOT. In this model, an exogenous government spending shock crowds out the asset holder’s consumption, so that TOT appreciates (the third panel in the first row in Figure 5). Consequently, the trade balance can deteriorate due to the switching effect. Although those two effects are mixed, given the trade price elasticity (
 $\sigma \lt 1$
), the absorption effect dominates the switching effect due to the similar process discussed in Monacelli and Perotti (Reference Monacelli and Perotti2010) and therefore the trade balance improves. Moreover, appreciation of TOT due to the decreasing in asset holders’ consumption is also consistent with the empirical results.Footnote
18
On the contrary, the simulation results, especially the response of the trade balance, are largely changed under a fixed exchange rate regime. There are two potential channels to alter the results: the uncovered interest rate parity (UIP) channel and the long-run purchasing power parity (PPP) channel. First of all, the nominal interest rate is determined by the UIP condition under a fixed exchange rate regime in this model. The monetary authority can adjust the nominal interest rate (
 $R_{t}$
) under a floating exchange rate regime, whereas the domestic nominal interest is
 $R_{t}$
fixed at the level of country-specific interest rate (
 $R_{F,t}$
) under a fixed exchange rate regime. Because the country-specific interest rate (
 $R_{F,t}$
) is almost constant, the domestic nominal interest (
 $R_{t}$
) is also fixed. This implies that the monetary policy is more accommodative under a fixed exchange rate regime. Due to the Fisher relation, an increase in the real interest rate is relatively smaller than that under a floating exchange rate regime.Footnote
19
Specifically, nominal interest rate is determined by the following UIP condition in this model.
 \begin{equation} r_{t}-r_{F,t}=-E_{t}\Delta e_{t+1} \end{equation}
Since
 $r_{F,t}$
is almost fixed, the monetary authority keeps the domestic nominal interest rate
 $r_t$
constant to keep the change in the nominal exchange rate at zero. Since the increase in the real interest rate is relatively smaller than that under a floating regime, the size of the crowding-out effect is also smaller than that under a floating system by the equation (39).
Contrary to the floating regime case, however, the domestic price level
 $P$
should revert back to the original level under a fixed exchange rate regime, since the nominal exchange rate is fixed and PPP holds in the long run.Footnote
20
Thus, the domestic inflation should be negative at some points (the first panel in the third row in Figure 5), which means that the real interest rate should increase. Thus, the long-run PPP effect crowds out asset holders’ consumption through the relation (39). Although the asset holders’ consumption is determined by the size of the two effects, the decrease in the asset holders’ consumption is smaller than that under a floating exchange rate regime due to the UIP channel (the first panel in the second row in Figure 5). Since the asset holders’ consumption declines less, government spending boosts output more than that under a floating regime, and therefore the disposable income of the nonasset holders increases more. As a result, aggregate consumption can increase in contrast to the floating regime case given the fraction
 $\lambda$
. The trade balance deteriorates because of the absorption effect.
It is worth noting that TOT still appreciates under a peg system since the asset holders’ consumption declines and the sign of the response of TOT is determined by the asset holders’ consumption. Furthermore, the TVP-VAR results reveal that the responses of private consumption in the Bretton Woods era tends be positive, while those tend to be negative in the post-Bretton woods era. Those empirical findings are consistent with the theoretical predictions. From a qualitative point of view, this model successfully replicates the empirical results.
4.4 Anomaly in the 1980s and the 2010s
In this section, I provide some channels to explain exceptions in the 1980s and 2010s.
anomaly in the 1980s First, I examine the effects of slowly adjustment tax on net exports and TOT to explain the twin deficits in the 1980s. In the 1980s, the Reagan administration increased government spending largely for the military buildup and reduced taxes to boost the economy leading to an explosive increase in government debts.Footnote 21 Huge tax cuts stimulate the consumption of non-asset holders, thereby stimulating aggregate consumption and imports. To examine the effect of the slowly adjustment of taxes, I assume that taxes do not respond to government spending (
 $\psi _{tg}=0$
) and compare them to the baseline simulation, which is the same in Section 4.3 with a floating regime. Small
 $\psi _{tg}$
means that taxes are less sensitive to increases in government spending, which can be interpreted as reducing tax burdens.
To compare with the baseline and the slowly adjustment tax case, the nonasset holders’ consumption (the second panel in the second row in Figure 6) is higher in the slowly adjustment tax case than that in the baseline case. Because of the slowly adjustment tax, disposable income increases more through the nonasset holders’ budget constraint, which drives an increase in the hand-to-mouth consumers’ consumption. At the same time, the asset holders’ consumption is lower in the slowly adjustment tax case than that in the baseline case since asset holders expect a heavier tax burden in the future. The government should issue more bonds with the slowly tax adjustment due to the constraints on the government budget. Thus, the future tax burden of asset holders increases, and the negative wealth effect becomes stronger. This effect leads to greater crowding out of the asset holders’ consumption.
Impulse responses of the selected variables to government spending shocks: Slowly Adjusted Taxes. Quantitative results are measured in deviations from the steady state scaled by the steady state output except terms of trade and inflation. The response of terms of trade and inflation are measured in percentage deviations from the steady state.
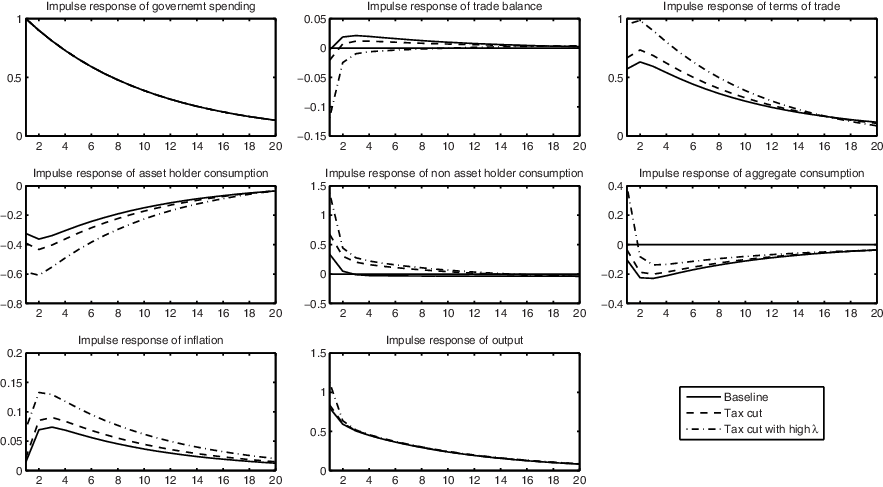
Though the two effects are mixed, given the parameters, trade balances deteriorate more due to the absorption effect with the slowly adjustment tax rule than that without the slowly adjustment. This channel is enforced by a larger fraction of non-asset holders, (
 $\lambda$
). Footnote 22 The slowly tax adjustment process provides more of a boost to the aggregate consumption of nonasset holders, as shown in Gali et al. (Reference Gali, López-Salido and Vallés2007), consequently driving larger trade deficits. Moreover, TOT appreciates in response to a government spending shock (the third panel in the first row in Figure 6) because of a decline in the asset holders’ consumption in both the low and the high
 $\lambda$
case.
In sum, a government spending shock with slowly adjustment tax stimulates the consumption of hand-to-mouth consumers and imports, which possibly leads to a trade deficit even with a floating exchange rate regime. However, the size of the resulting trade deficit is sensitive to the fraction of hand-to-mouth consumers.
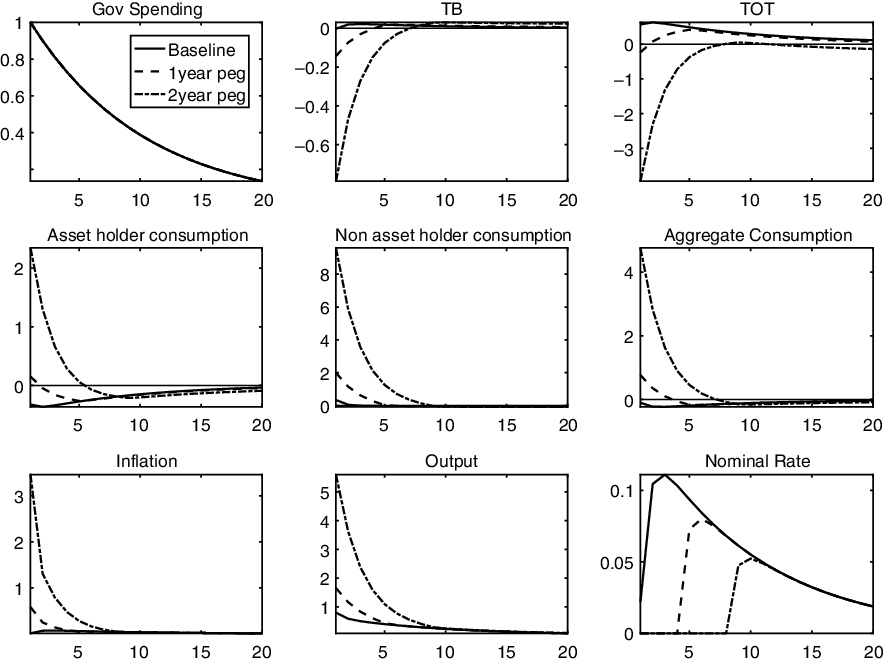
anomaly in the 2010s To explain exceptions in the 2010s, I examined the zero lower bound situation. In the aftermath of the financial crisis, the nominal policy rate reached zero. As an unconventional monetary policy, the monetary authority introduces the forward guidance, that is the monetary authority is committed zero policy rate for some future periods. In this situation, the monetary authority cannot respond to inflation caused by an increase in government spending. Thus, Ricardian consumer consumption can increase even in the floating exchange rate regime. To examine this channel, I introduce interest rate pegs for 1 and 2 years in the baseline model. In each case, the policy rate will be stuck in the steady state rate for the given periods, and after the given periods, the monetary authority will follow the usual Taylor rule. This exercise can give some intuition for the effects of the zero lower bound situation such as Chen et al. (Reference Chen, Cúrdia and Ferrero2012).
Figure 7 presents the results. They show that government spending increases the trade surplus in the normal situation, but an increase in government spending deteriorates the trade balances in the interest-rate peg case. The main channel is an increase in the asset holders’ consumption. The nominal interest rate is stuck and inflation occurs due to an increase in aggregate demand shocks. Consequently, the real interest rate decreases and stimulates the asset holders’ consumption. The longer the interest rate is pegged, the more the trade balance decreases. The results imply that exceptions in the 2010s may have been caused by the forward guidance and the zero lower bound situation in the USA.Footnote 23
Impulse responses of the selected variables to government spending shocks: Interest rate peg case. Y-axis means percentage deviations from the steady state.
5. Conclusion
This paper examines the effects of structural changes on relations between government budget balances and external balances. Through a TVP-VAR model and post-World War II data for the USA, the following three empirical results are obtained: (1) In the Bretton Woods era, increases in government spending led to trade deficits. (2) In contrast to the Bretton Woods era, an increase in government spending induces a trade surplus in the post-Bretton Woods era. (3) Exceptions in the 1980s and 2010s: Trade deficits were caused by a government spending shock in spite of the USA having adopted a floating exchange regime.
To provide some insights on the empirical results, I construct a small open economy New Keynesian model that incorporates ROT consumers, as suggested by Gali et al. (Reference Gali, López-Salido and Vallés2007). The theoretical model shows that an exchange rate regime change is useful to understand results (1) and (2). Slowly adjusted taxes and the zero lower bound situation can be useful to understand result (3). Through those empirical and theoretical investigations, I provide detailed transmission mechanisms of government spending and the consequent budget deficits. Those depend on several factors such as the monetary and exchange rate systems, tax responses, and the ability of households to smooth consumption.
Acknowledgments
This paper is a revised version of the second chapter in my PhD dissertation. I am deeply indebted to Ryo Jinnai, Sarah Zubairy, Yuzhe Zhang, and Hagen Kim for their guidance and helpful comments. I also thank two anonymous referees for their helpful comments and suggestions. All remaining errors are my own. This work was supported by the Sungshin Women’s University Research Grant of 2022.
A. Details of Gibbs sampling
In this paper, the TVP-VAR model is estimated with Bayesian Markov chain Monte Carlo techniques. The procedures are mainly based on Primiceri (Reference Primiceri2005) and Del Negro and Primiceri (Reference Del Negro and Primiceri2015) with minor modifications proposed by Canova and Ciccarelli (Reference Canova and Ciccarelli2009) for the calibration of the priors. It is convenient to define two notations.
 \begin{align*} x^{\tau }=[x'_{\!\!1},\cdots,x'_{\!\!\tau }]', \quad \quad M^{\tau }=[m'_{\!\!1},\cdots,m'_{\!\!\tau }]' \end{align*}
The former one denotes a generic vector of variables
 $x$
up to a time
 $\tau$
. The later denotes a generic matrix
 $M$
with its column vector
 $m$
constructed by the time varying components of
 $M$
up to time
 $\tau$
. Gibbs sampling is conducted with the following four steps.
A.1. Step 1: Drawing volatility states
 $\Sigma ^{T}$

Conditional on
 $B^{T}$
,
 $A^{T}$
,
 $V$
and data, the measurement equation can be rewritten as
 \begin{equation} A_{t}(y_{t}-X_{t}'B_{t})=y_{t}^{*}=\Sigma _{t}\varepsilon _{t} \end{equation}
where
 $y_{t}^{*}$
can be observable conditional on
 $B^{T}$
and
 $A^{T}$
. This system itself is nonlinear but taking squaring and logarithm of every elements in the equation, the following linear equation system is derived.
 \begin{equation} y_{t}^{**}=2h_{t}+e_{t} \end{equation}
 \begin{equation} h_{t}=h_{t-1}+\eta _{t} \end{equation}
where
 $y_{i,t}^{**}=\log ((y_{i,t}^{*})^{2}+c^{*})$
,
 $e_{i,t}=\log (\varepsilon _{i,t}^{2})$
,
 $h_{i,t}=\log \sigma _{i,t}$
, and
 $i=1,\cdots,n$
.Footnote 24 Since
 $\varepsilon$
’s and
 $\eta$
’s are assumed to be independent,
 $e$
’s and
 $\eta$
’s are not correlated. The transformed systems is linear but it is a non-Gaussian because
 $e$
’s are distributed as a
 $\log \chi ^{2}$
. Fortunately, this system can be approximated to a linear-Gaussian state space form with mixture normal density by the method proposed by Kim et al. (Reference Kim, Shephard and Chib1998). The mixture density is given by
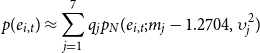 \begin{equation} p(e_{i,t})\approx \sum _{j=1}^{7} q_{j}p_{N}(e_{i,t};m_{j}-1.2704,\upsilon _{j}^{2}) \end{equation}
where
 $q_{j}$
is probability,
 $m_{j}$
is mean,
 $\upsilon _{j}^{2}$
is variance,
 $p_{N}$
is a normal density function.
 $q_{j}$
,
 $m_{j}$
, and
 $\upsilon _{j}^{2}$
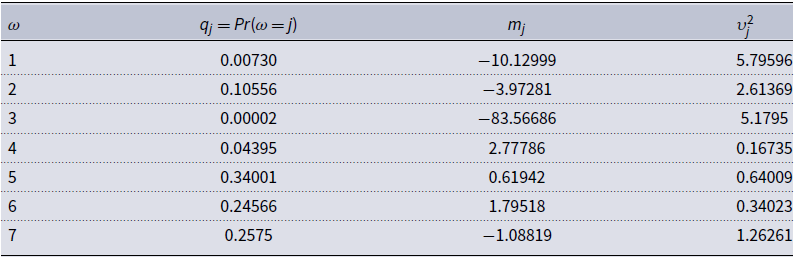
are known constants chosen to match a number of moments of the
 $\log \chi ^{2}(1)$
. Table 3 provides detailed numbers. The choice of
 $q_{j}$
,
 $m_{j}$
and
 $\upsilon _{j}^{2}$
is reported below. Conditioning on the realization of an random indicator variable
 $s_{i,t}$
, one element of the mixture normal density is selected. In other words,
 \begin{equation} e_{i,t}\,|\,s_{i,t}=j \sim N(m_{j}-1.2704,\upsilon _{j}^{2}), \quad i=1,\cdots,n \quad j=1,\cdots,7 \end{equation}
The standard Kalman filter and the backward recursion can be applied the approximated linear-Gaussian system to draw
 $h_{t}$
given a
 $s^{T}=[s_{1},\cdots,s_{T}]'$
,
 $B^{T}$
,
 $A^{T}$
and
 $V$
.
A.2. Step 2: Drawing coefficient states
$B^{T}$

Conditional on the data and
 $A^{T}$
,
 $\Sigma ^{T}$
, and
 $V$
, the measurement equation is a standard linear-Gaussian model with known variance. As shown in Carter and Kohn (Reference Carter and Kohn1994), the density
 $P(B^{T}|y^{T},A^{T},\Sigma ^{T},V)$
can be factored as
 \begin{equation} p(B^{T}|y^{T},A^{T},\Sigma ^{T},V)=p(B_{T}|y^{T},A^{T},\Sigma ^{T},V)\prod _{t=1}^{T-1}p(B_{t}|B_{t+1},y^{t},A^{T},\Sigma ^{T},V) \end{equation}
where
 \begin{equation} B_{t}\, |\, B_{t+1},y^{t},A^{T},\Sigma ^{T},V \sim N(B_{t|t+1},P_{t|t+1}) \end{equation}
 \begin{equation} B_{T}\, |\, y^{T},A^{T},\Sigma ^{T},V \sim N(B_{T|T},P_{T|T}) \end{equation}
 \begin{equation} B_{t|t+1}=E[B_{t}| B_{t+1},y^{t},A^{T},\Sigma ^{T},V] \end{equation}
 \begin{equation} P_{t|t+1}=Var(B_{t}|B_{t+1},y^{t},A^{T},\Sigma ^{T},V) \end{equation}
 $p$
denotes a density function,
 $N$
is the normal distribution and
 $E$
is the expectation operator. Since the measurement equation and the state equation has a standard linear-Gaussian form, the standard Kalman filter and the backward recursion explained in Appendix A.1 can be applied to draw coefficient states similar in Primiceri (Reference Primiceri2005). Specifically, the forward Kalman filter delivers
 $B_{T|T}$
and
 $P_{T|T}$
which is mean and variance of the posterior of
 $B_{T}$
as its last recursion point. The first point of backward recursion is drawn from
 $N(B_{T|T}, P_{T|T})$
. Furthermore, using
 $B_{T|T}$
,
 $P_{T|T}$
and the backward recursion below, the remaining can be drawn from
 $N(B_{t|t+1},P_{t|t+1})$
,
 $t=1,\cdots, T-1$
.
A.3. Step 3: Drawing covariance states
$A^{T}$

The measurement equation can be rewritten as
 \begin{equation} A_{t}(y_{t}-X_{t}'B_{t})=A_{t}\hat{y_{t}}=\Sigma _{t}\varepsilon _{t} \end{equation}
Note that conditional on
 $B^{T}$
,
 $\hat{y}_{t}$
can be observable. Because
 $A_{t}$
has a particular form(lower triangular with ones on the main diagonal), the equation (A11) can be written as follows:
 \begin{equation} \hat{y}_{t}=Z_{t}\alpha _{t}+\Sigma _{t}\varepsilon _{t} \end{equation}
where
 $Z_{t}$
is an
 $n\times \frac{n(n+1)}{2}$
matrix given by
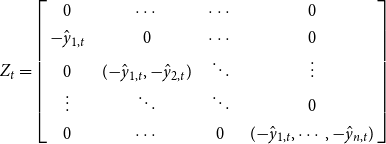 \begin{equation} Z_{t}= \left[\begin{array}{c@{\quad}c@{\quad}c@{\quad}c} 0 & \cdots & \cdots & 0 \\ -\hat{y}_{1,t} & 0 & \cdots & 0 \\ 0 & (\!-\!\hat{y}_{1,t}, -\hat{y}_{2,t}) & \ddots & \vdots \\ \vdots & \ddots & \ddots & 0 \\ 0 & \cdots & 0 & (\!-\!\hat{y}_{1,t},\cdots, -\hat{y}_{n,t}) \end{array}\right] \end{equation}
Unfortunately, the standard Kalman filter and the backward recursion cannot be applied since the system is Gaussian but nonlinear since the dependent variable in the measurement equation appears on the
 $Z_{t}$
in general cases. However, Primiceri (Reference Primiceri2005) shows that the system becomes linear under the block diagonal assumption of
 $S$
. Under the assumption of
 $S$
, therefore, the same procedure in Appendix B.1 allows to recover
 $\alpha _{t}$
and associated variance
 $\Lambda _{t}$
by
 \begin{equation} \alpha _{i,t|t+1}=E[\alpha _{i,t}|\alpha _{i,t+1},y^{t},B^{T},\Sigma ^{T},V] \end{equation}
 \begin{equation} \Lambda _{i,t|t+1}=Var(\alpha _{i,t}|\alpha _{i,t+1},y^{t},B^{T},\Sigma ^{T},V) \end{equation}
 \begin{equation} \alpha _{i,t}\,|\,\alpha _{i,t+1},y^{t},B^{T},\Sigma ^{T},V \sim N(\alpha _{i,t|i,t+1},\Lambda _{i,t|i,t+1}) \end{equation}
where
 $\alpha _{i,t}$
is the
 $i$
-th block of
 $\alpha _{t}$
and
 $\Lambda _{i,t}$
is associated variance.Footnote
25
A.4. Step 4: Drawing hyperparameters
$V$

The hyperparameters in this model are the diagonal blocks of variance matrix
 $V$
:
 $Q$
(coefficient states),
 $W$
(volatility states), and the block diagonal of
 $S$
(covariance states). Taking
 $B^{T}$
,
 $A^{T}$
,
 $\Sigma ^{T}$
, and
 $y^{T}$
as given, all innovations are observable. Since all innovations are assumed to be independent to each others, each square block has an inverse-Wishart posterior distribution and is easily drown from these inverse-Wishart posterior given the proper priors.
A.5. Step 5: Drawing
$s^{T}$

Conditional on
 $B^{T}$
,
 $A^{T}$
,
 $V$
, and
 $\Sigma ^{T}$
, each random indicator variable
 $s_{i,t}$
can be drawn using the following density.
 \begin{equation} Pr(s_{i,t}=j|y_{i,t}^{**},h_{i,t})\propto q_{j}p_{N}(y_{i,t}^{**}|2h_{i,t}+m_{j}-1.2704,v_{j}^{2}),\quad i=1,\cdots,n \quad j=1,\cdots,7 \end{equation}
where
 $p_{N}$
is the normal probability density function.
A.6. Gibbs sampling for state space models
A measurement equation is given by
 \begin{equation} y_{t}=H_{t}\beta _{t}+\varepsilon _{t} \end{equation}
and state equation is
 \begin{equation} \beta _{t}=F\beta _{t-1}+u_{t} \end{equation}
where
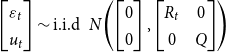 \begin{equation} \begin{bmatrix} \varepsilon _{t} \\ u_{t} \end{bmatrix} \sim \text{i.i.d} \,\,\, N\Biggl{(} \begin{bmatrix} 0 \\ 0 \end{bmatrix}, \begin{bmatrix} R_{t}\;\;\; & 0 \\ 0\;\;\; & Q \end{bmatrix} \Biggr{)} \end{equation}
Let
 \begin{equation} \beta _{t|s}=E[\beta _{t}|Y^{s},H^{s},R^{s},Q] \end{equation}
 \begin{equation} V_{t|s}=Var(\beta _{t}|Y^{s},H^{s},R^{s},Q) \end{equation}
Given initial
 $\beta _{0|0}$
and
 $V_{0|0}$
, the standard Kalman filter gives
 \begin{equation} \beta _{t|t-1}=F\beta _{t-1|t-1} \end{equation}
 \begin{equation} V_{t|t-1}=FV_{t-1|t-1}F'+Q \end{equation}
 \begin{equation} \beta _{t|t}=\beta _{t|t-1}+V_{t|t-1}H_{t}'(H_{t}V_{t|t-1}H_{t}'+R_{t})^{-1}(y_{t}-H_{t}\beta _{t|t-1}) \end{equation}
 \begin{equation} V_{t|t}=V_{t|t-1}-V_{t|t-1}H_{t}'(H_{t}V_{t|t-1}H_{t}'+R_{t})^{-1}H_{t}V_{t|t-1} \end{equation}
Note that
 $V_{t|t-1}H_{t}'(H_{t}V_{t|t-1}H_{t}'+R_{t})^{-1}$
is the Kalman gain. The last recursion elements
 $\beta _{T|T}$
and
 $V_{T|T}$
are the mean and the variance of the posterior of
 $\beta _{T|T}$
. With factored density of
 $\beta ^{T}$
and the backward recursion,
 $\beta _{T-1}$
can be obtained. This procedures continues until time zero given updating equations of the backward recursion:
 \begin{equation} \beta _{t|t+1}=\beta _{t|t}+V_{t|t}F'V_{t+1|t}^{-1}(\beta _{t+1}-F\beta _{t|t}) \end{equation}
 \begin{equation} V_{t|t+1}=V_{t|t}-V_{t|t}F'V_{t+1|t}^{-1}FV_{t|t} \end{equation}
A.7. Selection of the mixing distribution to be
$\log \chi ^{2}(1)$

Source: Kim et al. (Reference Kim, Shephard and Chib1998)
B. Calibration of the priors
I use full-sample OLS estimators to calibrate the priors following Canova and Ciccarelli (Reference Canova and Ciccarelli2009). There are two advantage. First, I do not want to sacrifice some initial data points. With the trained data method, some initial data points of Brettonwoods system should be discarded, which possibly misguided the effects of nominal exchange regime. Secondly, this methods minimize the uncertain involved in calibrating the priors properly as described in Canova and Ciccarelli (Reference Canova and Ciccarelli2009).
B.1. VAR coefficients
Let
 $B_{OLS}$
be the OLS estimator from the full-sample time-invariant VAR and
 $\Xi _{B}$
is its variance–covariance matrix. Following Primiceri (Reference Primiceri2005),
 $B_{0}$
the prior for
 $B$
are assumed to be
 \begin{equation} B_{0} \sim N(B_{OLS}, 4 \times \Xi _{B}) \end{equation}
B.2. Covariance states
Let
 $A_{OLS}$
be the Cholesky components(lower triangular matrix) in the time-invariant VAR and
 $\Xi _{A}$
be its variance–covariance matrix. The prior of covariance states of the model is assumed to be
 \begin{equation} A_{0} \sim N(A_{OLS}, 4 \times \Xi _{A}) \end{equation}
This specification is the same one in Primiceri (Reference Primiceri2005)
B.3. Volatility states
Let
 $\log \sigma _{0}$
be the OLS estimators of variance matrix(diagonal matrix of Cholesky decomposition) in time invariant VAR. The prior for volatility states is assumed to be
 \begin{equation} \log \sigma _{0} \sim N(\!\log \sigma _{OLS}, I_{n}) \end{equation}
which is similar to the one in Primiceri (Reference Primiceri2005) and Canova and Gambetti (Reference Canova and Gambetti2009).
B.4. Hyperparameters
The prior for
 $Q$
, the variance–covariance matrix for
 $B_{t}$
, is set to be
 \begin{equation} Q \sim IW(\kappa _{Q}^{2}\times (dim(B_{OLS})+1) \times \Xi _{B}, dim(B_{OLS})+1) \end{equation}
Following Primiceri (Reference Primiceri2005), I set
 $\kappa _{Q}=0.01$
.
 $dim(B_{OLS})+1$
is set to be the degree of freedom of the inverse-wishart prior. The degree of freedom which I choose is widely used in time-varying parameter VAR literatures such as Benati and Mumtaz (Reference Benati and Mumtaz2007), Kirchner et al. (Reference Kirchner, Cimadomo and Hauptmeier2010), Pereira and Lopes (Reference Pereira and Lopes2010) and Rafiq (Reference Rafiq2012). Also,
 $dim(B_{OLS})+1$
is the minimum number of degrees of freedom for the appropriate priors.
The prior of
 $W$
, the variance−covariance matrix for the innovations of
 $\log \sigma _{t}$
, is assumed to be
 \begin{equation} W \sim IW(\kappa _{W}^{2}\times (dim(\sigma _{OLS})+1) \times I_{n},dim(\sigma _{OLS})+1) \end{equation}
Following Primiceri (Reference Primiceri2005),
 $\kappa _{Q}=0.1$
. Following Benati and Mumtaz (Reference Benati and Mumtaz2007), I set the degree of freedom of inverse-wishart to
 $dim(\sigma _{OLS})+1$
which is the minimum degree of freedom for the prior.
The prior
 $S$
, the variance–covariance matrix of
 $A_{t}$
, is set to be
 \begin{equation} S_{j} \sim IW(\kappa _{S}^{2}\times (j+1)\times \Xi _{j,A},j+1) \quad j=1,\cdots,3 \end{equation}
where
 $S_{1}$
to
 $S_{3}$
denote the blocks of
 $S$
,
 $\Xi _{1,A}$
to
 $\Xi _{3,A}$
denote the associated blocks of
 $\Xi _{A}$
and
 $\kappa _{S}=0.1$
which is the same in Primiceri (Reference Primiceri2005). All numbers for the priors such as
 $\kappa _{Q}$
,
 $\kappa _{W}$
, and
 $\kappa _{S}$
are standard and consistent with Primiceri (Reference Primiceri2005).
C. Evidences on structural breaks: subsample VAR
In order to provide preliminary evidence on structural changes between the Bretton Woods and the post-Bretton Woods periods, the data are divided into two subperiods: 1947.Q1−1972.Q4 and 1980.Q1 onwards.Footnote 26 Time-invariant structural VAR is estimated for each subperiod.Footnote 27 Figure 8 shows the estimated impulse response to a 1% increase in exogenous government spending for each subperiod. The panels in the first column show the response in the Bretton Woods era while the panels in the second column show the response in the post-Bretton Woods era.
Impulse response in the sub-sample VAR analysis. The size of shock is normalized by a 1% increase in government spending. Solid line means the mean responses and shaded area means the 68% confidence bands.
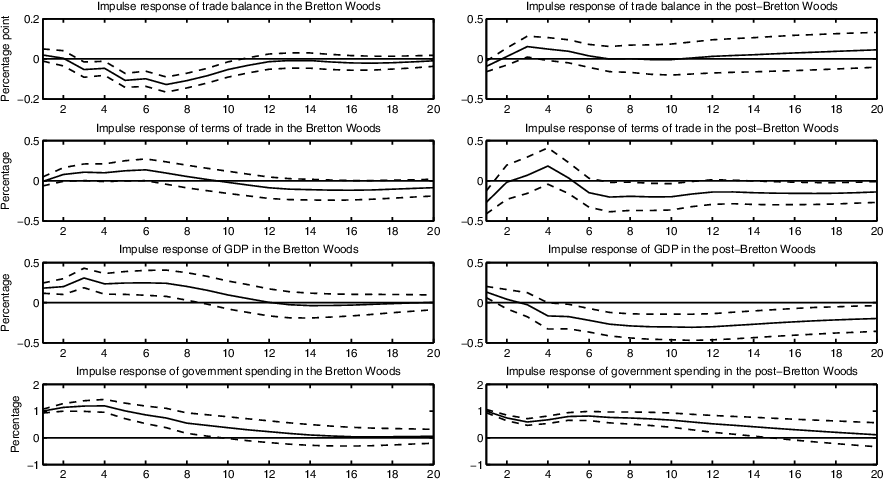
Impulse responses of the selected variables to government spending shocks under different Taylor rules. Quantitative results are measured in deviations from the steady state scaled by the steady state output except terms of trade and inflation. The response of terms of trade and inflation is measured in percentage deviations from the steady state.
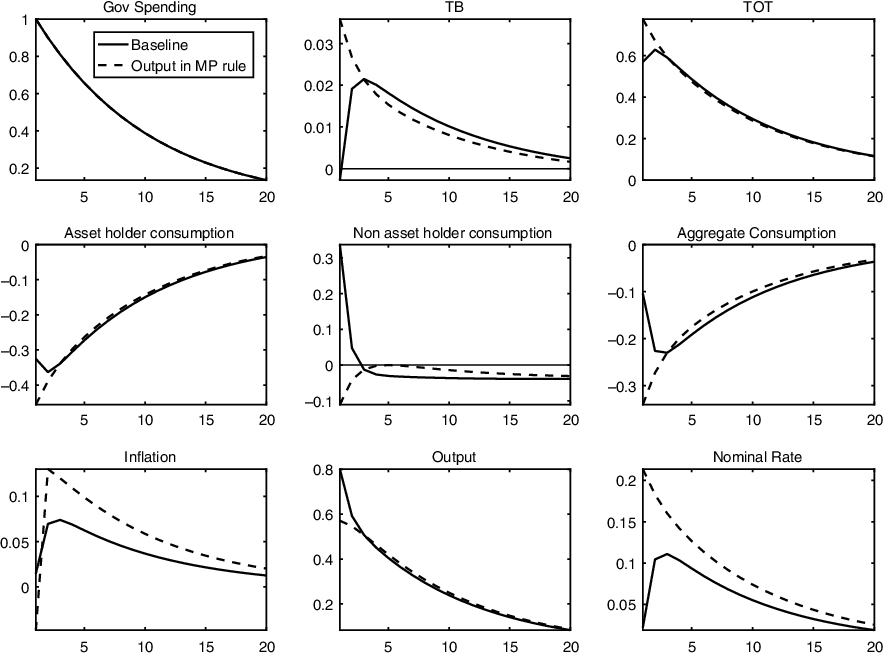
In the first row in Figure 8, increasing government spending leads to trade deficits in the Bretton Woods system while the opposite occurs in the post-Bretton Woods era. In the Bretton Woods period, the initial response of the trade balance is positive. However, the size is small and the response soon turns negative. After 7 quarters, the trade balance drops 0.15 percentage points and follows the trend. Unlike the Bretton Woods era, the initial reaction of the trade balance is negative but turns positive soon in the post-Bretton Woods era. After the peak response–an increase of 0.12 percent points–in the 4th quarter, the trade balance goes back to the trend. This result matches that of Corsetti et al. (Reference Corsetti, Meier and Müller2012c). They estimate several state-dependent effects of government spending with an OECD panel and show that increasing government spending leads to trade deficits under a fixed exchange rate regime while the opposite occurs under a floating exchange rate regime.Footnote 28 Unlike the response of the trade balance, the reaction of terms of trade (in the second row) seems to be similar in both periods: appreciation in the short run and depreciation in the long run.Footnote 29 The initial response of terms of trade in the Bretton Woods system is slightly below zero but quickly becomes positive. After the peak response–0.13% appreciation–in the 6th quarter, the response starts to decline. The reaction turns negative after the 9th quarter, terms of trade follows the trend slowly after the 15th quarter. Similarly, the initial response is negative in the post-Bretton Woods era but the size is larger than that in the Bretton Woods system. The response peaks in the fourth quarter with an increase of 0.12%. A negative response after the fifth quarter is followed by a slow return to the trend. In general, the basic pattern in the response of terms of trade is similar in both subperiods but appreciation in terms of trade is larger and persistent in the Bretton Woods era.
Overall, the results of the time-invariant structural VAR model indicate that the twin deficit hypothesis seems to be reasonable in the Bretton Woods system while twin divergence may occur in the post-Bretton Woods era. This implies that nominal exchange rate regimes play an important role in determining the relation between budget balances and external balances. Meanwhile, the response of terms of trade to government spending is not very different–at least qualitatively–across nominal exchange rate regimes.
D. Simulation results with alternative Taylor rules
In this Appendix, I show the simulation results with alternative Taylor rule. In particular, I assume that the monetary authority responds to output as well as inflation. As an example, I use the following rule:
 $R_{t}=R+\phi _{\pi }(\pi _{t}-\pi )+\phi _{y}(y_{t}-y_{t-1})$
,
 $\phi _{\pi }=1.5$
and
 $\phi _{y}=0.5$
. Figure 9 shows some simulation results with output Taylor rule.
When the monetary authority responds to output, the monetary authority increases policy rate more in response to a positive government spending shock. This is because a positive government spending shock stimulate output. The monetary authority tries to stabilize output with increasing policy rate. It dampens asset holders’ and nonasset holders’ consumption more so that aggregate consumption decreases more than those in the baseline case (Taylor rule with only inflation). Because of drop in aggregate consumption, trade surplus is more likely than that in the baseline case. Thus, the channel still alive when the monetary authority responds to output changes. Simulation results reveal that trade surplus takes place in response to a positive government shock. It means that output in Taylor rule does not alter the implication of theoretical model.



