


Introduction
Russia's recognition of renegade regions in Ukraine, followed by its full-scale invasion on February 24, 2022, has received overwhelming condemnation from the international community. Although initially thought to be limited, international reactions eventually resulted in a great number of economic sanctions against Russia's politicians, economic system, transportation networks, financial infrastructure, sports teams, and scientific community. The major source of these sanctions was the West, exemplified by the alliance of the European Union (EU), the USA, and the UK. These sanctions were then supported and shared by many other countries (i.e., Scandinavian countries, Japan, Australia, Canada, and many others) who either share Western concerns or support such sanctions to avoid being scapegoated as countries challenging the Western norms of liberal democracy, rule of law, and state sovereignty. However, paradoxically, the responses of countries in Central Asia (CA), whose positions are impacted the most by the Russian “special operation in Ukraine” and whose post-“operation” futures are tightly related to how Russia behaves, have been restrained, unvoiced, and largely private. For example, while the UN (United Nations) General Assembly resolution condemning the Russian invasion into Ukraine was sponsored by ninety countries and received 141 votes in favor of it during the March 2 vote, no CA state voted in favor of the resolution. Kazakhstan, Kyrgyzstan, and Tajikistan chose to abstain from voting, while Uzbekistan and Turkmenistan did not vote at all. In a similar manner, during the March 24 vote on the UN GA resolution titled Humanitarian consequences of the aggression against Ukraine, most of CA states were among thirty-six countries that abstained while Turkmenistan did not vote at all (UNNews 2022).
Thus, in this paper, we aim to explore not only CA governments' understanding of Putin's rhetoric in his war against Ukraine but also the reasons for their restrained reactions to Russia's war against Ukraine, which CA governments and populations have displayed since the beginning of the Ukrainian crisis. How have the CA regional governments and public understood Putin's intentions for his Ukrainian military operation? What were the initial reactions of CA governments to it? How do these reactions reflect the worldviews of the populations in these states?
To answer these questions, we first establish how CA governments have understood Russia's President Putin's narrative of his military intervention in Ukraine and his vision for the indivisibility of security in Eurasia. We then describe the reactions of CA leadership to these views, emphasizing their mediocre stances. We contextualize these with the statements and responses of political leaders in Kazakhstan, Kyrgyzstan, and Uzbekistan who have been in communication with President Putin since Russian military operations started in Ukraine. Next, using social polling data from the Asian Student Survey Third Wave in 2018 (spearheaded by one of the authors) and similar polling data from the Cabar Asia project (available online) and other requisite sources, we integrate these governmental statements into our broader discussion of CA populations' general worldviews concerning their own societies and the countries around them. We specifically focus on the views of youth populations regarding CA and the countries around it because they dominate the demographic structures of CA societies. Although these social polls were conducted prior to the Russian invasion of Ukraine, they provide essential context for the possible reasons why the reactions of CA states' leadership and populations have been so restrained and passive compared to those of Europe, the USA, and elsewhere.
Hence, we argue that the approach of CA states to the Ukrainian crisis should be defined as strategic silence. This choice of foreign policy behavior reflects not only CA's ideological (these states being ruled by former Communist and autocratic) and geographic factors, but also its shared information space, largely dominated by Russian and Russian-language media that have facilitated CA's understanding of the historical continuity between Russian and CA leaders.
However, we also demonstrate that the strategic silences that public officials and populations in CA have selected reflect the complicated realities of these states. Their leaders and populations are well aware of the structure of their dependence on educational and labor opportunities in Russia and their necessity for postwar coexistence with Russia, China, and other states that are not sympathetic to the intentions of the EU/USA in Ukraine and CA. Therefore, strategic silence is an approach for CA states to both voice their disagreement with Russia's approach to Ukraine and to avoid being victimized by Russia and its allies for an openly anti-war stance.
Strategic silences? The case for a constructivist narrative of CA responses
The passive reactions of CA governments, exemplified by their UN votes on a resolution demanding the cessation of military actions in Ukraine and the withdrawal of Russian forces, have engendered various explanations and analyses.
For instance, one popular explanation for CA silence on Russian intervention in Ukraine is connected to the logic of the New Great Game narrative played by local rules (see Cooley Reference Cooley2012). Thus, CA regional governments are either client states of Russia and attempt to appease and accommodate it by not voicing their concerns, or, alternatively, they are part of the structure of a geopolitical rivalry, whereby they are forced to choose Russia over the West (Razma Reference Razma2015). Accordingly, CA states are run by similarly minded leaders who either favor similar governance approaches to Putin's or owe him for his political support of them during, e.g., the anti-government protests in Kazakhstan in 2022. If such an explanation for this passive behavior is true, we could expect overwhelming support for Russia's invasion from CA states, in line with their clientist loyalty. However, there has been little if any support of these states for Russian actions in Ukraine. Indeed, Kazakhstan, the country with the closest ties to Russia in CA, refused to recognize the Lukhanskaya Narodnaya Respublika or Lukhansk People Republic (LNR) or the Donetskaya Narodnaya Respublika or Donetsk People's Republic (DNR) and to use its military forces in Ukraine (Tass.Ru 2022). In addition, such an explanation does not necessarily explain why objections to the Russian invasion were not loudly voiced by other authoritarian leaders in Turkmenistan and Tajikistan.
Another commonly expressed argument is that CA states are dependent on the Russian economy, which may explain why their anti-war positions have not been clearly expressed to the Russian president. However, again, such dependence does not account for the fact that CA leaders are aware of the longer-term consequences of the anti-Russian sanctions related to its war. That is, anti-Russian economic sanctions will harm not only Russian economic interests, but also those tied to Russia. Therefore, the fact that CA states are dependent on the stability of the Russian market should have pushed them to voice their concerns against the Russian war campaign and escalation of tensions between Russia and the West simply for the sake of their own survival.
The third explanation often given is that CA states remain timid in their responses simply because they are afraid of the Russian response, which in its extremity could be similar to the annexation of Crimea or the military actions in areas heavily populated by ethnic Russians in Kazakhstan, for instance, as can be heard from the various Russian politicians (Kaztag 2022). In addition, according to this position, Russia can threaten to retaliate for a lack of support of Russia (for an explanation of such a position, applied to the annexation of Crimea, see Dzhuraev Reference Dzhuraev2015). Such concerns are obviously present in the CA region, but CA governments seem to grasp that an appeasement strategy is counterproductive for all CA states, as they could easily become Russia's next targets (Tokayev Reference Tokaev2022). Therefore, if we accept this explanation, CA responses should have been more vocal against the Russian aggression in Ukraine, which was not the case. However, even when threatened by Ukraine-style “operations,” countries like Kazakhstan seem to downplay such rhetoric coming from Russia (Azatyk 2022) raising questions about their motivation to do so.
All three of these positions are important for understanding the complexity of CA's geopolitical situation. However, in this paper, we argue that the responses of CA governments need to be understood as “strategic silences” to reflect the very complicated position that these states occupy with respect to Russia and China. We identify their approach as strategic silences because they allow CA states to facilitate their interactions with both Russia and countries opposing the Russian campaign.
Our reasoning derives from CA governments' well-developed relations and historical connections with both Russia and Ukraine. Russia is one of the largest trade partners with CA states. These CA states have received significant economic, political, and military support from Russia following their independence, i.e., during the Taliban's incursions into the region in the mid-1990s, the Tajik civil war of 1992–1997, the colored revolutions in Kyrgyzstan, and the uprising in Uzbekistan in 2005; the events in Kazakhstan in January 2022 are thus the latest examples of an ongoing trend. Such assistance and cooperation between CA states and Russia have shaped a culture of mutual support; hence, CA governments have avoided openly criticizing Russia at such a vulnerable time, even if they disagree with the Russian decision to invade Ukraine.
In line with this logic, the Russian president's press service has released a statement emphasizing the fact that it received an “understanding” from the Uzbek president, which will serve as the basis for further collaboration in other areas:
Shavkat Mirziyoev expressed an understanding of the actions undertaken by the Russian side. The discussions also touched upon important questions on the bilateral agenda. They confirmed a mutual orientation on the further development of the Russo–Uzbek strategic partnership, with a focus on the implementation of concrete projects in trade, economy and humanitarian fields (Kremlin.Ru 2022a, 2022b).
Ukraine, on the other hand, has also been historically connected to CA through both a shared Soviet history and an extensive network of economic ties (Komilov Reference Komilov2022). Therefore, CA states have found themselves in a situation where they cannot take sides as they please to preserve relations with both parties (Talipov Reference Talipov2022). To some extent, this CA position has remained unchanged since the Russian annexation of Crimea in 2014 (Dzhuraev Reference Dzhuraev2015).
This position also explains the reaction of the Uzbek president to the above quote, as he corrected Uzbekistan's political stance in a statement issued by the presidential press office:
Our country traditionally has had close, friendly relations with both Russia and Ukraine. We are interested in ensuring peace, stability, and sustainable development in our vast region. All disputes and disagreements that arise must be resolved solely on the basis of international law (Asadov Reference Asadov2022).
This statement was further elaborated by the Uzbek FM Kamilov in March 2022:
We will continue our mutually beneficial cooperation with these two countries, based on our national interests. On the one hand, Russia is the leading trade partner with Uzbekistan, and we have a strategic partnership and alliance with it. On the other hand, we cooperate with Ukraine in many ways including trade, economic, cultural, educational and agricultural areas (Ferghana.News 2022a).
Kyrgyz President went even further by arguing that his country's taking sides will benefit no parties to the conflict:
The situation in Russia and Ukraine has a negative impact on all countries of the world. In short, the situation is difficult in the areas of trade, economy, security and cooperation at the global level. Everything escalates sharply. We are a small republic. We cannot influence to stop the war. Therefore, we have to adhere to neutrality (24Kg 2022a).
In addition, CA states need well-maintained relations with Russia to balance China's influence in this region. We also suggest that CA populations, in addition to being inner-oriented or, as some scholars suggest, apolitical (Talipov Reference Talipov2022), have opted to either confirm official government narratives or simply avoid taking a particular position on this issue because of closed and governmentally dominated political landscapes.
The CA governmental responses have been designed to avoid openly taking sides not because CA governments do not have a salient position, but because such strategic silences reflect the reality that CA governments are heavily invested in their relations with both Russia and the West. Therefore, any positions they express will have a negative impact on their postwar relations with these countries.
While the concept of “strategic narratives” prominently features in the analysis of the communications of power in International Relations, the strategic narratives approach frequently focuses on explicit indication and communication of power relations between the states (for details see Miskimmon, O'Loughlin, and Roselle Reference Miskimmon, O'Loughlin and Roselle2013, Reference Miskimmon, O'Loughlin and Roselle2017). Strategic narratives are defined as “a means by which political actors attempt to construct a shared meaning of the past, present, and future of international politics to shape the behavior of domestic and international actors” (Miskimmon, O'Loughlin, and Roselle Reference Miskimmon, O'Loughlin and Roselle2013, p. 6) and rightfully considered to be an important category for analysis. In this paper, however, we propose to complement the inquiries into strategic narratives by suggesting that it is important to focus not only on the vocally expressed narratives, but also on “silences” which can be considered as part of the strategic narrative to demonstrate “how different states try to use narratives strategically to sway target audiences” (Roselle, Miskimmon, and O'Loughlin Reference Roselle, Miskimmon and O'Loughlin2014, pp. 74–75). In this sense, “silences” as demonstrated by the CA responses to the Ukrainian crisis need to be understood as a form of a narrative that is not necessarily explicit and vocal but which represents the response by smaller states to the narratives of greater powers. In a way, these “strategic silences” are a format of resistance by smaller states, exemplified by CA states, in order to avoid being victimized (punished by Russia or sanctioned by the West) for taking any stance in a conflict that they essentially consider part of the ever-lasting conflict between the West and Russia. However, even with these strategic silences, CA governments have clearly signaled their lack of a desire to support Russian aggression against Ukraine and to take any part in it (see Alimova Reference Alimova2022).
We also argue that these strategic silences do not need to be considered withdrawals from international affairs. They are driven by a constructivist logic; hence, the governmental policies of CA regional actors in international affairs are not only shaped by moral judgments (liberalist position) or strategic calculations of losses and gains (realist approach to international relations), but also by their shared culture of cooperation and the structure of their social interactions with various international actors.
Thus, we emphasize that public policy decisions in the CA region are heavily influenced by mutual interactions with Russia, China, and other neighboring states, which socially construct information space, shared linguistic space (which is often dominated by Russian mass-media and Russian-language programs), and a close network of interdependence. These factors play significant roles in defining CA responses to various types of crises.
Drawing data from various opinion polls, we hypothesize that such an attitude toward the Ukrainian conflict and the Russian government is not necessarily limited to public officials but is also evident in the opinions of youth populaces, who constitute approximately 70% of the total population in the CA region.
We also argue the CA region's close proximity to Russia and China entails that CA states' interactions and influences are often limited to these powers. These powerful states constitute an area close to the CA regional neighborhood which is one category important for understanding CA regional responses to the Ukrainian crisis (Dadabaev Reference Dadabaev2022). While countries such as Ukraine, Georgia, and Moldova, which strongly support Western liberal values, border the EU and on the path towards association with EU, the CA region borders states that are not necessarily friendly toward Western notions and ideas, such as Russia, China, Afghanistan, Iran, and Turkey. Therefore, these factors are primarily responsible for why CA states and their populations do not rush to support anti-Russian rhetoric; they do not perceive such rhetoric to be driven by universal values to eliminate war but rather as another Western attempt to harm non-Western rivals in Eurasia.
CA regional understanding of Putin's world order and Ukraine as “anti-Russia”
Before we discuss the reactions of CA republics to Russian aggression in Ukraine, we need to establish the logic for Russian actions, as articulated by President Putin. In Putin's words, modern Ukraine is part of the Western project to create “anti-Russia,” a state to use against Russia's interests that is close to its borders (Putin Reference Putin2021). Thus, his vision of contemporary Ukraine largely correlates with his vision of the West. Such a critical attitude toward the West has progressed over time (see Laruelle Reference Laruelle2008), with Putin's early anti-Western signals manifesting after the bombing of Yugoslavia, when, according to Putin, Russian concerns were completely ignored and Kosovo was allowed to gain independence to facilitate Western interests to harm Serbia, a Russian ally (Putin, Reference Putin2022a). However, such criticism did not drive Putin's anti-Western stance until his famous Munich speech in 2007, when he concluded that if nothing changed, the West was on a trajectory to collide with Russia. Accordingly, he concluded that Russia needed to abandon its illusions of becoming part of the West to focus on regaining its “self,” as defined by Russia's global and Eurasian influence (for a discussion of Russian emotions in politics, see Tsygankov Reference Tsygankov2014). Therefore, Russia's Georgian war in 2008, eventual recognition of Abkhazia and Ossetia and its annexation of Crimea in 2014, as well as its support of renegade territories, continue to be framed by Putin as part of regaining Russia's “self,” as opposed to the “other,” of which the West is the best example (Putin Reference Putin2022b).
Meanwhile, the eventual expansion of NATO to the doorstep of Russia has been framed by Putin as among the main threats to Russian existence (Tsygankov Reference Tsygankov2018), made possible only because Russia was deceived by Western promises in the early 1990s (Mearsheimer Reference Mearsheimer2014, Reference Mearsheimer2018). Some scholars argue that this vision of Putin is not completely groundless and that the West's strategy to harm Russia has three elements: the expansion of NATO, the expansion of the EU, and the use of color revolutions to usurp governments that the West considers unfriendly (Mearsheimer Reference Mearsheimer2022). Accordingly, given this structure, Putin assumes Ukraine to be an instrument of the West for harming the “Russian world” as defined by Putin (Reference Putin2021). According to him, the “Russian world” refers to the Russian ethnic culture, orthodox church, traditional/conservative society, and other features. In addition, it is also related to a politically constructed dichotomous category of what Russia is not. In this dichotomous counterposing of Putin's understanding, NATO is “anti-Russia” of which Ukraine is now part (Putin Reference Putin2021).
CA leadership largely ignored these statements during the last 20 years of Putin's presidency. Although Putin has appeared to maintain certain grievances (Sakwa Reference Sakwa2017) about how Russia has been treated and to be discontent with how Khruschev detached Crimea from Russia and annexed it to Ukraine in 1954, he did not express his desire for the return of the peninsula to Russia in the early 2000s because his interests were accommodated by a treaty that kept Russian naval bases in Ukraine.
However, the shift in Putin's thinking, reflecting his disillusionment with the West appeared in the mid-2000s (Trenin Reference Trenin2006) and was clearly expressed in his Munich speech in 2007 (Putin Reference Putin2007). This culminated in 2013 when, in response to President Viktor Yanukovych's attempts to reconsider Ukraine–EU association agreement and to form closer economic ties with Russia, mass protests erupted in Kyiv. These events resulted in the forceful overthrow of Yanukovych, his taking refuge in Russia, and the establishment of a pro-Western and clearly anti-Russian government in Ukraine. These events also eventually compelled Putin to advocate the importance of the civilizational sovereignization (Trenin Reference Trenin2013) of Russia, i.e., constructing a self-sufficient Russian world. This logic drove him to adopt the rhetoric that it was in the interests of both the populations of Crimea and Russia to annex the peninsula for good.
This was also the first time that some CA republics, e.g., Kazakhstan, were alarmed by such rhetoric, as they feared that Putin may exploit the same tactic to potentially annex some of the areas of Kazakhstan that are heavily populated by ethnic Russians (Sadykov Reference Sadykov2014). Kazakhstan thus abstained from the UN GA vote on a resolution that defined the Crimean referendum as illegitimate (UNGA 2014). Moreover, Nazarbayev later explained that no concern for Ukrainian integrity had informed Kazakhstan's non-recognition of Russia's Crimean annexation; rather, such recognition would also have put pressure on Kazakhstan to recognize Abkhazia, Osetia, and Kosovo (Tass.Ru 2021).
CA leaders were also very cautious about supporting Ukraine because they witnessed how Ukrainian authorities were brought to power by a revolution that authoritarian leaders (Nazarbayev, Karimov, Berdymukhamedov, and Rakhmon) did not want to legitimize and thus perhaps stimulate in their own countries (Kalishevski Reference Kalishevski2014). In the words of Nazarbayev, “All this arose due to the coup that happened in Kiev” (Tass.Ru 2021).
CA leaders were partially comforted by the fact that Putin did not rush to initially recognize the renegade republics of Luhansk and Donetsk, as he basically followed the blueprint of Russian policy in Georgia (Abkhazia and Osetia) and Moldova (Transdnestr), i.e., of “freezing” these conflicts. Meanwhile, there was an understanding among political elites in the CA region that by “freezing” these conflicts and hence delaying the recognition of these separatist areas, Putin did not necessarily seek to pacify them. That is, these areas served as pressure points that would be utilized by the Russian government whenever it deemed that Georgia, Moldova, or Ukraine had “misbehaved” with respect to Russia and its allies in CA (Muratalieva Reference Muratalieva2022). Such recognition, which is the discursive act of recognizing separatists' struggles against central governments in their respective republics, was also a punitive measure, penalizing the West for its lack of consideration of Russian concerns. Thus, Ukraine is the latest example of such a measure (See also, Putin Reference Putin2022a).
CA leaders have displayed their awareness that such a “retreat and reclaim” cycle (e.g., Nazarbayev's rhetoric in Mir24 News Agency 2021) or in Putin's own words “return and reinforce” (Putin Reference Putin2022b) is a part of Putin's worldview and his narrative of Russian civilizational identity (Putin Reference Putin2022b; Linde Reference Linde2016). Accordingly, for Putin, Russia's history is defined by the constant movement from greatness to collapse and from collapse to reconsolidation and further expansion with Russian culture, language, and orthodox religion (Putin Reference Putin2022b; Linde Reference Linde2016). Hence, the collapse of the Soviet Union, for him, was not the “end of history” but a part of the cyclical development of the Russian state. To provide empirical validity to such a cyclical vision of history, Putin has often referred to Chingiz Khan and the Mongol-Tatars' rule of Russia from 1237 to 1480 (when Russia was part of the Golden Horde Empire), Napoleon Bonaparte's war against Russia (when Moscow was burned to its foundations), the Russian empire's participation in World War I, which resulted in two revolutions and the collapse of the Russian empire (for this argument see Dadabaev Reference Dadabaev2020), and Nazi Germany's invasion of the Soviet Union during the devastating World War II period (Putin Reference Putin2021).
There is an understanding among CA political elites that in Putin's worldview, the West's (USA, EU, and UK) support of pro-Western and anti-Russian governments in Ukraine, Georgia, and Moldova as well as the attempts to overthrow authoritarian governments in Belarus (during anti-government protests after presidential elections of 2020) and Kazakhstan (during the anti-government protests against the usurpation of power by the family of former president Nazarbayev in 2022) entails that the West supports these latest attempts which target not only Belarus and Kazakhstan, but are also aimed to “attack” Russia (Mir24 News Agency 2021). The careful and very restrained statements of CA leaders also demonstrate that they realize that for Putin, the war in Ukraine is not just about defending ethnic Russian populations in parts of Ukraine as Putin often claims. Rather, they understand that Putin sees his war in Ukraine as an existential problem for the Russian nation (see Ferghana.News 2022b). These regional leaders also realize that in such a struggle, which Putin believes he is waging for Russian survival, he considers economic sanctions and hardships to be the types of collateral damage that Russia will have to pay for its physical survival and for the political security of its generations to come.
Although Western (EU, the USA, the UK) leaders continue to argue that harsh economic and political sanctions will decrease Putin's appetite for war, the Russian president has provided a two-point response to such expectations: first, defeating what Putin defines as the nationalist and fascist agenda in Ukraine is a matter of national survival for the Russian nation. Second, Russia intends to make an example out of Ukraine to prevent other states on Russia's periphery from behaving in an openly confrontational manner with Russia (Putin Reference Putin2022a). This is a message not only to Moldova and Georgia, which similar to Ukraine, have renegade territories that have been recognized by Russia, but also to other states including those in the CA region.
Putin's “inseparable security for all” and Central Asia
There is also an understanding in the CA region that Putin views security in absolute, not relative, terms. For many years, he has indicated his dissatisfaction with the relative political stability in Europe, believing that such stability has been achieved through NATO's expansion and the weakening of Russia. Hence, he regards NATO as an outdated institution that has only one adversary, which is Russia. There was thus no surprise among CA leaders when Putin preemptively demanded that Ukraine commit to neutrality at the end of 2021 to prevent future conflict with NATO if Ukraine (after the hypothetical scenario of being admitted into NATO) opted to challenge Russia's Crimean ownership in the future. Some CA republics had already committed to this neutrality, such as Uzbekistan and Turkmenistan. Such a position of neutrality was affirmed by the Uzbek FM during his annual address to the senate in March of 2022 (Komilov Reference Komilov2022). Kyrgyz president also emphasized such a position in the address to the parliament (24Kg 2022a).
Seemingly understanding Putin's rhetoric, Kyrgyz President Japarov stated that:
Not only Western states are talking about the impossibility of staying neutral, but others are demanding to take a stand. It is possible (Neutral position. – Note of 24Kg news agency). The two peoples will find a common language sometime. We had lived with both countries for 70 years as part of the USSR, as one family and shared the same bread (24Kg 2022a).
Similarly, CA leaders were not taken aback by Putin's demands that the US provide legally binding assurances regarding the non-expansion of NATO (ideally, the retreat of NATO strategic forces to the USSR's 1991 borders) and its non-inclusion of former Soviet constituencies, such as Ukraine, Georgia, and Moldova. There was no apprehension among CA leaders of Putin's logic that security for NATO implies insecurity for Russia and that such insecurity will only increase with the inclusion of Ukraine in the former.
In addition, countries in close geographic proximity to CA region, notably China, have also voiced their support for the notion of the “universal security of all parties” prior to the vote for the UN resolution that called for the withdrawal of Russian forces from Ukraine. China's UN ambassador, Zhang Jun, pointed out that the resolution calling for Russian withdrawal did “not highlight the importance of the principle of indivisible security” while explaining China's abstention (Pumak and Landay Reference Pumak and Landay2022). While the Chinese ambassador was referring to the Russian standoff with the West over Ukraine, China has also been concerned about potential developments regarding Taiwan, which some refer to as China's Ukraine, and with the establishment of NATO-like institutions in the Indo-Pacific region.
The biggest differences between Putin's claims and CA leaderships' views are related to the territorial revisionism of Russia in post-Soviet states (Tsygankov Reference Tsygankov2021). However nonsensical, Putin claims that Russia has been robbed of its Soviet territories, with Ukraine and others being the beneficiaries of this process via “presents from the Russian people” (Putin Reference Putin2021, Reference Putin2022c). Such rhetoric has been articulated not only by Putin, but also by Russian politicians of all levels, disturbing CA states with a large ethnic Russian population and Russian borders, such as Kazakhstan (Kaztag 2022).
CA states have never subscribed to such a Russian logic of the post-Soviet world simply because their nations and current borders, similar to Ukraine, were finalized at the time of the establishment of the Soviet Union. These CA states have never recognized renegade republics in Georgia and Moldova, and they have not done so amid the Russian recognition of Luhansk and Donetsk in February 2022. Even the Russian “peacekeeping” operation under the CSTO in January 2022, offering support to President Tokayev during anti-governmental protests in Kazakhstan, has not motivated Kazakh leadership to “pay back” Russia by recognizing these republics or supporting Russia's war in Ukraine. For instance, President Tokayev directly confronted this revisionist logic in the presence of President Putin in 2022 registering his concerns about it (Tokayev, Reference Tokaev2022).
Nevertheless, these states are cautious about openly criticizing Russian actions, applying strategic silence. The leadership of these states recognizes that if Russia does not feel secure, there are no prospects for security and stability in their region within greater Eurasia. Therefore, although Kazakhstan has refused to recognize renegade regions in Ukraine and to send troops into Ukraine (Tass.Ru 2022), it has not openly condemned Russian aggression. Even in defiance to recognize renegate territories of LNR and DNR, President Tokayev appealed not to the illegitimacy of Russian agression against Ukraine but rather to the contradiction in international law, not allowing Kazakhstan to recognize new states (Tokayev, Reference Tokaev2022). Neighboring Kyrgyzstan has signaled its partial support to Russian actions by indicating “that Kyiv was responsible for undermining the Minsk Agreements” and expressing its support for Russia's actions because they are “aimed at protecting civilians in Donbas” (Kremlin.ru 2022b). The MOFA of Kyrgyzstan has also issued a statement emphasizing its good relations with both Russia and Ukraine while indicating the difficulty of choosing sides (Radio Azatik 2022).
Uzbekistan and Tajikistan have limited their reactions to an indication of their understanding of the logic of Russian actions, while the Uzbek president's press service has released a statement indicating that “Uzbekistan maintains neutrality in this issue” by taking a “balanced, neutral position” (Asadov Reference Asadov2022). As the Russian invasion in Ukraine began to stall, the Uzbek FM stated that Uzbekistan does not recognize renegade republics in Ukraine and is committed to respecting the territorial integrity and sovereignty of Ukraine in his address to the senate of Uzbekistan in March 2022 (Komilov Reference Komilov2022).
There are several implications of such refraining from open condemnation and support of Russian actions in CA region, which we treat as “strategic silence” in this paper. First, they do not advocate the Russian invasion and challenges to the borders of Ukraine and on occasions expressed support for the Ukrainian territorial integrity and sovereignty. But they were also reluctant to openly criticize Russia or impose strict sanctions against it. Rather, they utilized the narrative of their neutrality and refrained from voting in the UN, they send the message to Russia that they do not share the worldview of Putin with respect to Ukraine's territorial integrity and the West. Otherwise, given the close ties of these states with Russia, they would have indicated their support. Second, however, CA leaders, while not committing to the Russian geopolitical political agenda, reluctantly realize that their countries will continue to deal with Russia after the Ukrainian war. While Ukraine borders the EU and can count on the support and assistance from its neighboring Baltic states, Poland and Germany, CA states border Russia and China, both of which maintain similar anti-Western stances and views on national security, as described above.
In addition to such geographic constraints to their policy choices, geographic location also defines the sources of information that dominate CA media space. Most come from Russia and are transmitted in the Russian language. In addition, dependency on Russia for educational and employment opportunities also greatly impacts the policy choices of CA governments and perceptions of CA populations.
Russian sources of information and CA public opinion
On par with the governmental apprehension concerning open criticism of the Russian campaign in Ukraine, the public anti-war reactions in the CA region have also been rather limited in their scale and dynamics. There are several reasons for such an attitude.
For example, anti-Russian sentiments in general and those against Russian actions in Ukraine in particular are not as vocal in CA as in other countries because CA populations tend to maintain apolitical views with respect to various international events and heavily rely on governmental narratives. This reflects their long history of reliance on official narratives, of weak civil society institutions capable of producing alternatives to government narratives and of the generally inward-oriented structure of CA societies (Talipov Reference Talipov2022, Reference Talipov2014).
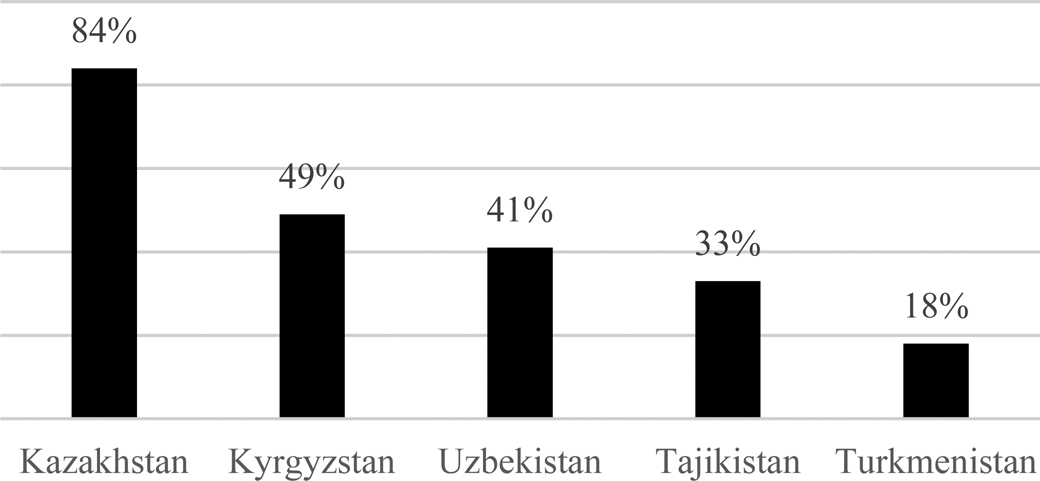
In addition to this inward orientation of CA populations, the second factor driving the lack of strong anti-war sentiments in CA is the fact that most flows of information come from Russia. One salient feature of this is the role of the Russian language in these societies. Russian has the status of official language in Kazakhstan and Kyrgyzstan, while in Tajikistan, it has the status of the language for interethnic communication. The Russian government realizes that maintaining such a common Russian-language-based information space in CA is important and has invested significantly to maintain such a soft-power resource (Gussarova Reference Gussarova2017). In Uzbekistan, Russian is widely used not only in private life, but also in public institutions. According to certain estimates (Evdokimov, Davydova and Savkin Reference Evdokimov, Davydova and Savkin2020), the Russian-speaking percentage of CA states' populations comprises 84% in Kazakhstan, 49% in Kyrgyzstan, 41% in Uzbekistan, 33% in Tajikistan, and 18% in Turkmenistan (see Fig. 1).
Russian-speaking populations in CA.
Source: Evdokimov, Davydova and Savkin (Reference Evdokimov, Davydova and Savkin2020).

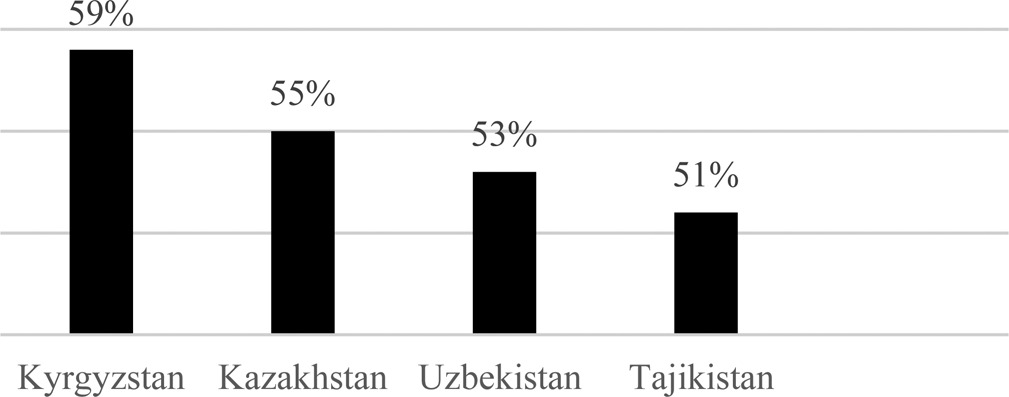
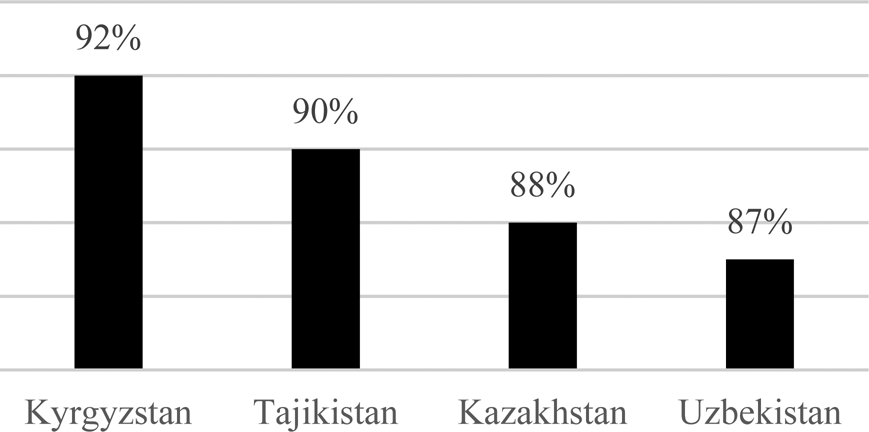
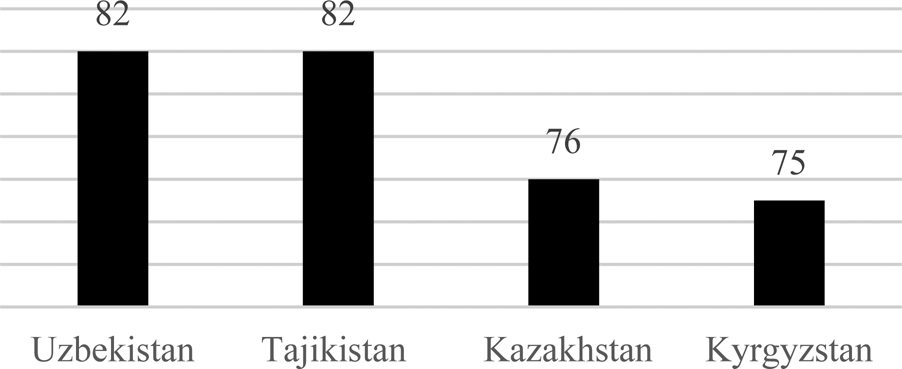
According to the Institute for War and Peace Research (2019), the primary language of access to information for its survey respondents was Russian (see Figs. 2–4).
Primary language of access to information: Russian.
Source: Institute for War and Peace Reporting Central Asia (2019).
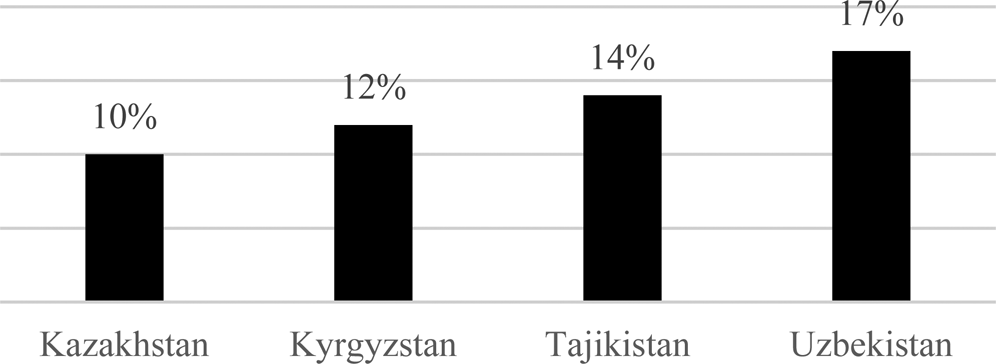
Note: English has been indicated as a distant second choice (registering 10% in Kazakhstan, 12% in Kyrgyzstan, 14% in Tajikistan, and 17% in Uzbekistan among the respondents).

Primary language of access to information: English.
Source: Institute for War and Peace Reporting Central Asia (2019).
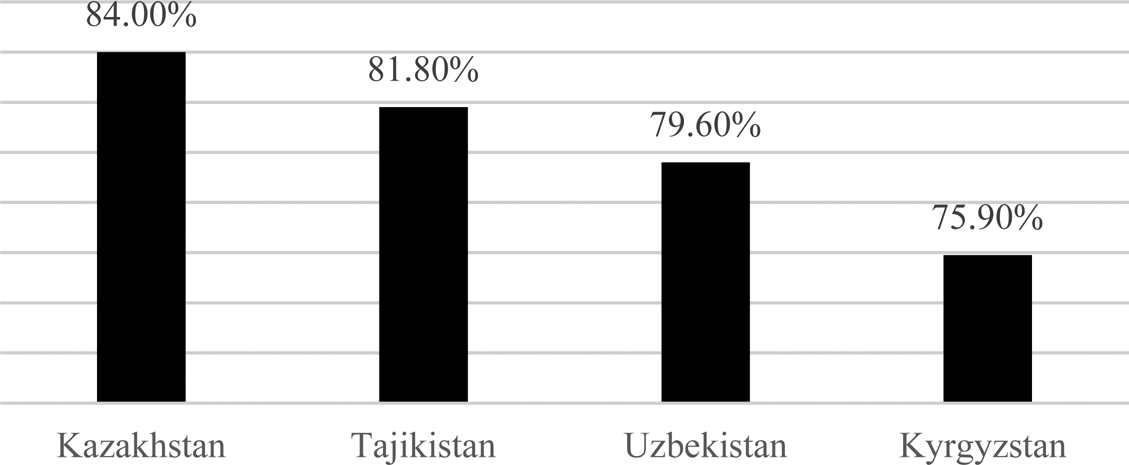
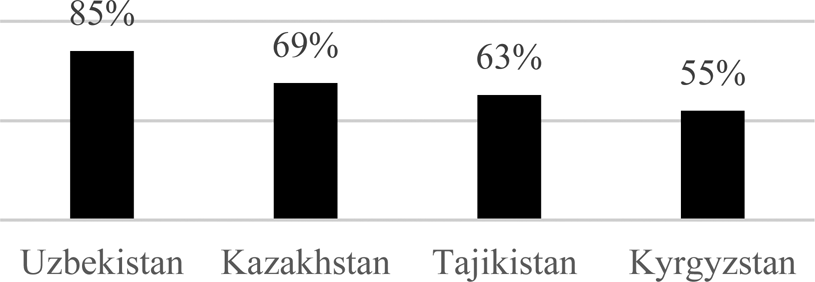
Note: This is also supported by other survey data that indicate that the Russian language is widely used in CA as one of the primary languages on the internet, with 84.0% of participants using it in Kazakhstan, 79.6% in Uzbekistan, 75.9% in Kyrgyzstan, and 81.8% in Tajikistan (https://w3techs.com/blog/entry/russian_is_now_the_second_most_used_language_on_the_web).

Use of Russian language in the Internet.
Source: Institute for War and Peace Reporting Central Asia (2019) (https://w3techs.com/blog/entry/russian_is_now_the_second_most_used_language_on_the_web).

Moreover, there seem to be usage differences among various age groups. On average, Russian has a 55% usage rate among those in the group of 16–18 years old, which increases to 67% among those in the age group of 53 years old and older (Institute for War and Peace Reporting Central Asia 2019).
Regarding the usage of the internet, most of the CA population uses social networking sites (see Fig. 5), websites (see Fig. 6), and messaging services (see Fig. 7).
Use of social networks for news.
Source: Institute for War and Peace Reporting Central Asia (2019).

Use of websites for news.
Source: Institute for War and Peace Reporting Central Asia (2019).

Usage of messengers for the news.
Source: Institute for War and Peace Reporting Central Asia (2019).

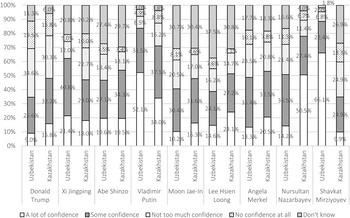
Such heavy exposure to the Russian language in the media has a significant impact on how the news is framed and delivered to the public in the CA, shaping public views not only on the current Russian–Ukrainian crisis, but also on the style and the image of leadership in various countries. According to the 2018 Asian Student Survey, many CA youth have expressed a strong appreciation for the style of leadership displayed by President Putin (83.6% in Uzbekistan with 52.1% having “a lot of confidence” and 31.5% “some confidence,” and 71.1% in Kazakhstan with 34% a lot of confidence and 37.1% some confidence), ranking second only to the presidents of their own countries (88.5% for Mirziyoev in Uzbekistan and 77.9% for Nazarbayev in Kazakhstan) (see Fig. 8).
Confidence in world leaders.
Source: Asian Student Survey Third Wave (2018).

Given that for the majority of the CA population, internet-based resources are the main sources of information on world events, the impact of Russian framing and media coverage significantly shapes and informs how policy-making officials and the public perceive world events. This can also partly explain why the international outcry against the Russian campaign in Ukraine has not been similarly expressed in the CA region. For some exceptions see, 24Kg (2022b).
While some suggest there is no direct relationship between the language/origin of the media outlets and the news framing (Laruelle and Royce Reference Laruelle and Royce2020), we suggest that language and origin of the news source massively consumed in CA is an important element for many local news outlets and news story framings.
Central Asia's dependence on Russian labor and educational markets
The third significant factor informing CA elite and public responses to Russia's Ukrainian war is the heavy dependence on Russia for the educational and employment opportunities of its population. According to the Russian Ministry of Interior Affairs, the number of CA entrants into Russia who indicated “work” as their primary purpose of arrival is registered as 3.3 million with Uzbek citizenship followed by 1.6 million with Tajik citizenship, and 600 thousand with Kyrgyz citizenship (Ozodlik 2021). For the comparison with other post-Soviet states, arrivals with similar purposes from Armenia account for 300 thousand while from Azerbaijan are 200 thousand people (Ozodlik 2021). Remittances of these migrants from Russia back to their families account for up to 30% of GDP in Tajikistan and Kyrgyzstan.
Therefore, there is a projected impact of the Ukrainian war on labor migrants from CA (Pultz Reference Pultz2022). According to studies conducted prior to the Ukrainian war, there are significant numbers of CAs from Uzbekistan, Kyrgyzstan, and Tajikistan who travel to Russia for unqualified and semiqualified labor opportunities. In addition to this group, there are significant numbers of those who consider Russia an attractive educational destination, with tens of thousands of CA youths enrolling in Russian educational institutions annually. Knowledge of the Russian language and close proximity to home as well as relatively low tuition fees all put these countries into an advantageous position with respect to Russian higher education. In addition, Russia absorbs large numbers of migrants from ethnic Russian and other local ethnic groups under the “repatriation of compatriots” program, which aims to attract individuals who can demonstrate close historical and contemporary ties with Russia and who can be employed in certain professions and regions that lack a sufficient workforce.
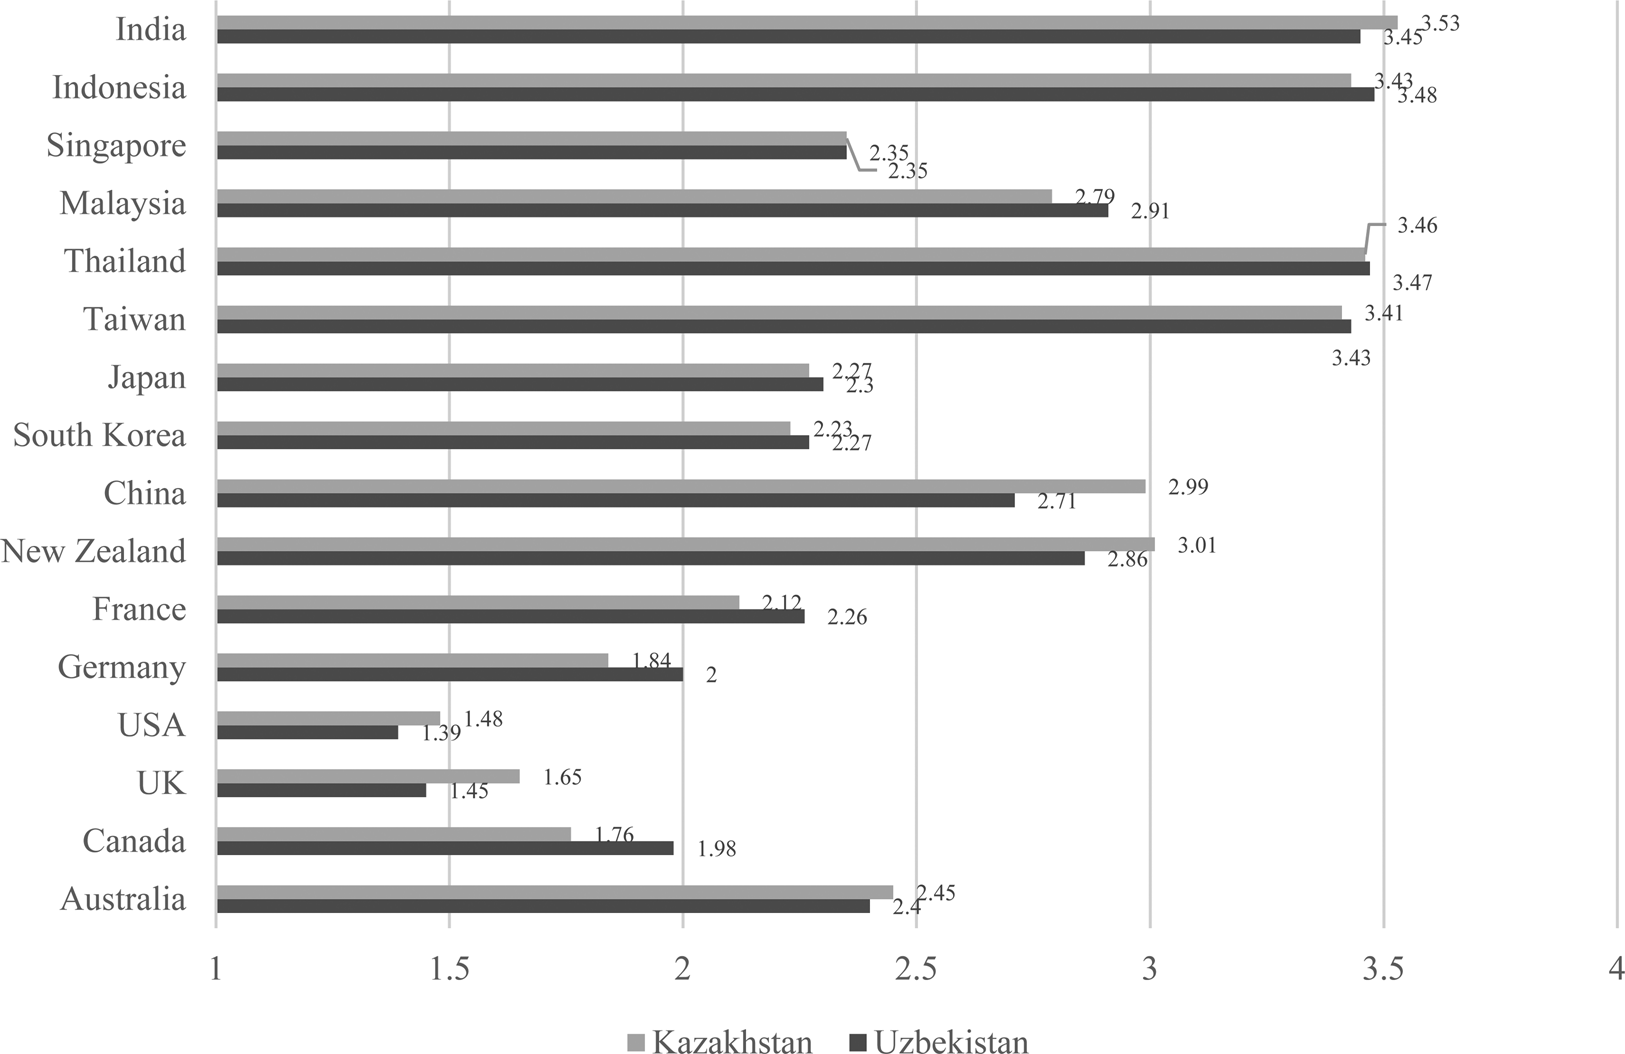
However, Russia is not a primary choice when young people willingly seek educational opportunities. The polling data for youth choices demonstrate that English-speaking countries remain the most popular and desired group of states for educational opportunities, e.g., the USA and the UK. This choice is natural for those involved in international studies in Uzbek universities, as English and Russian remain their first foreign languages.
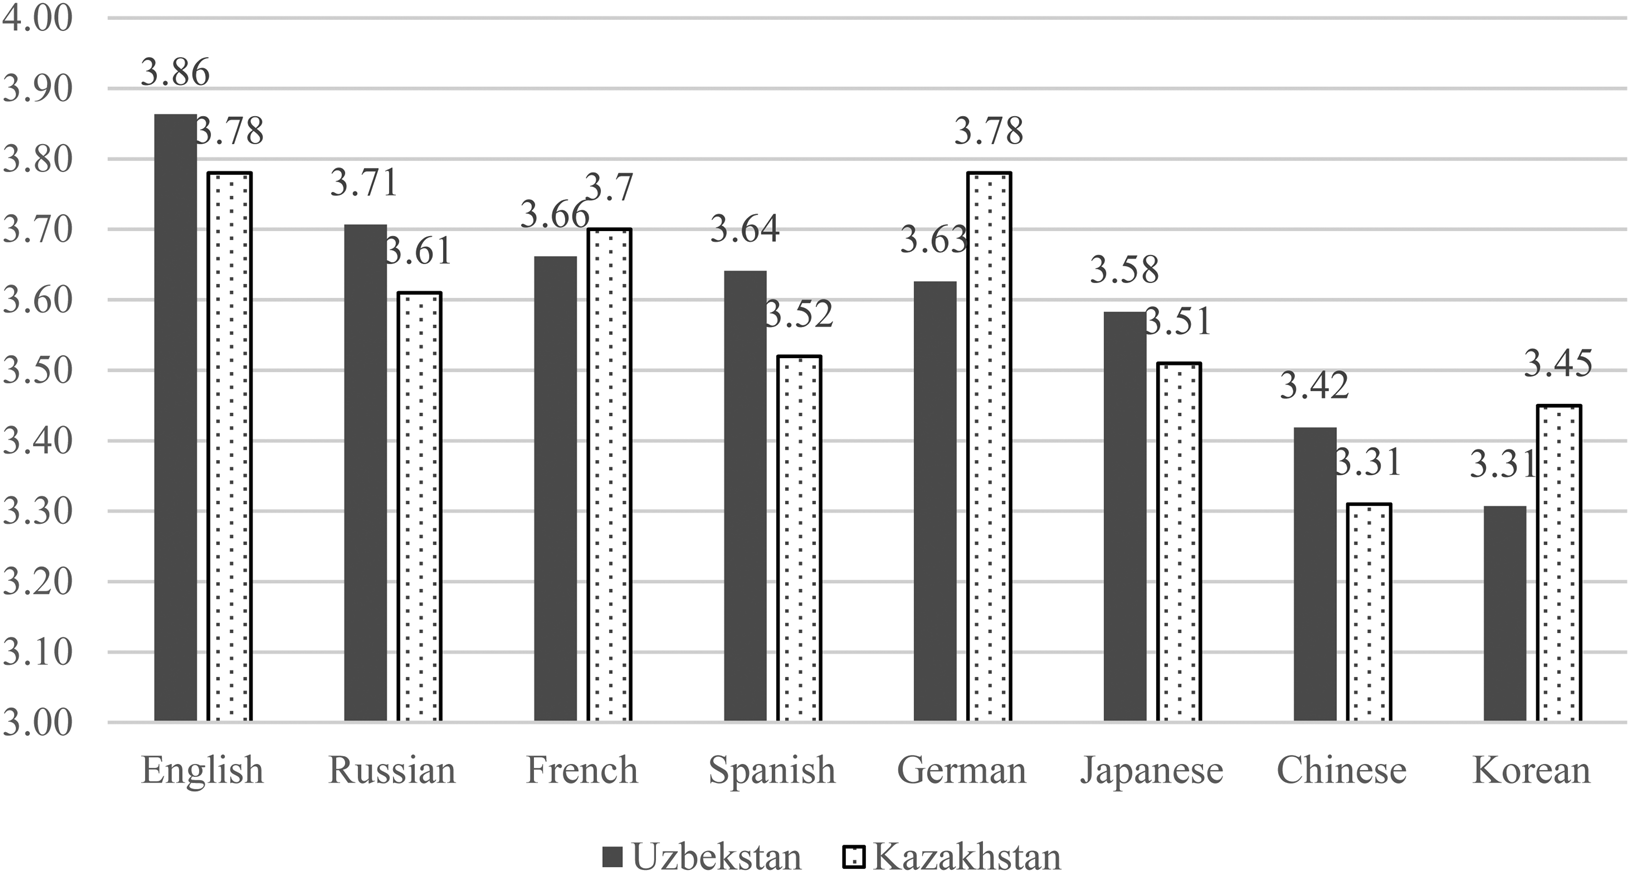
Such English-speaking countries are then followed by the second group including Japan, Singapore, South Korea, Germany, and France, all of which require a certain level of language proficiency. In terms of ambitions for new foreign language acquisition, as many choose Chinese, Korean, and Japanese as French and German, which can be attributed to the economic potential of these states and the future opportunity generation students expect in relation to these languages (see Fig. 9).
Study destination preferences 2018 (from 1 high to 4 low).
Source: Asian Student Survey Third Wave (2018).

These findings are also supported by the outcomes of a different poll, conducted by the Ebert Foundation in Kazakhstan and Uzbekistan in 2016 among youth populations, which suggest that the most students in Kazakhstan prefer the USA (29%) as their country of choice for education, followed by the EU (23.4%) and Russia (23.3%) (Friedrich-Ebert-Stiftung 2016). Similar destinations have been registered as countries of choice for young people in Uzbekistan (Friedrich-Ebert-Stiftung 2016).
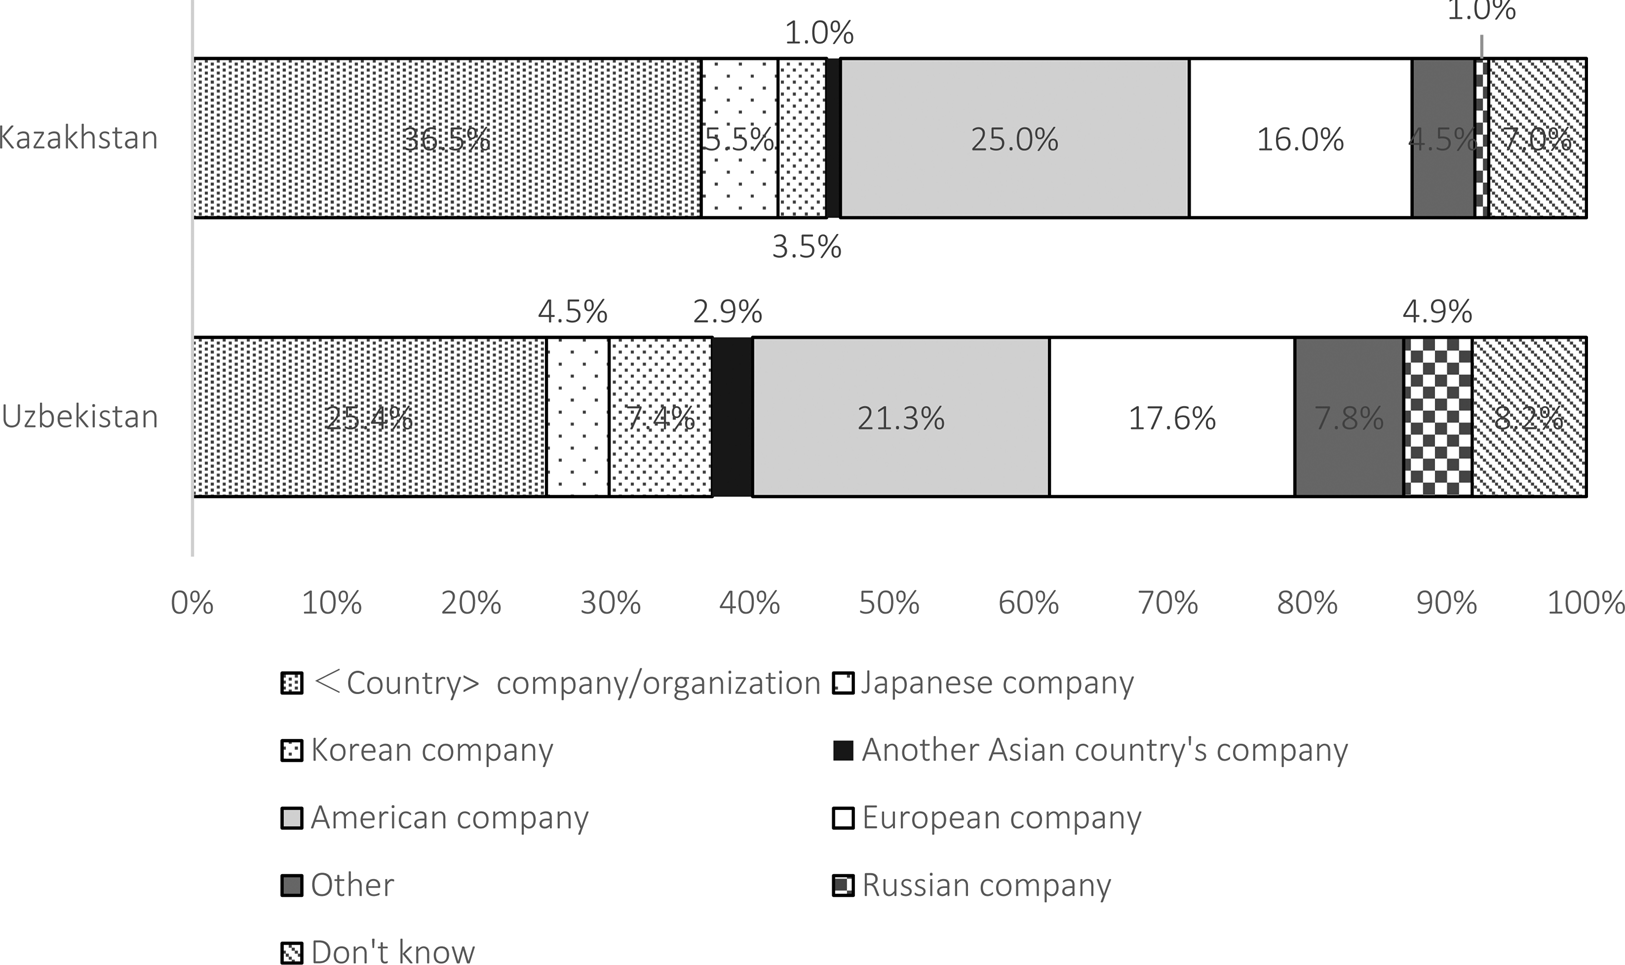
Nevertheless, preferred study destination and the desire to acquire certain language skills do not positively impact the overall educational level of CA youth, as exemplified by the data in Figure 10 on Uzbekistan and Kazakhstan. Rather, they are related to the prospects for employment in either the countries of educational choice or companies that are associated with such a country. According to Figure 10, Uzbek youth hope to find jobs in a nationally affiliated company or organization. Among foreign countries, Uzbek youth prefer employment in companies associated with US corporate interests, followed by those with European, Russian, Korean, or Japanese interests.
Desire for employment in foreign companies.
Source: Asian Student Survey Third Wave (2018).

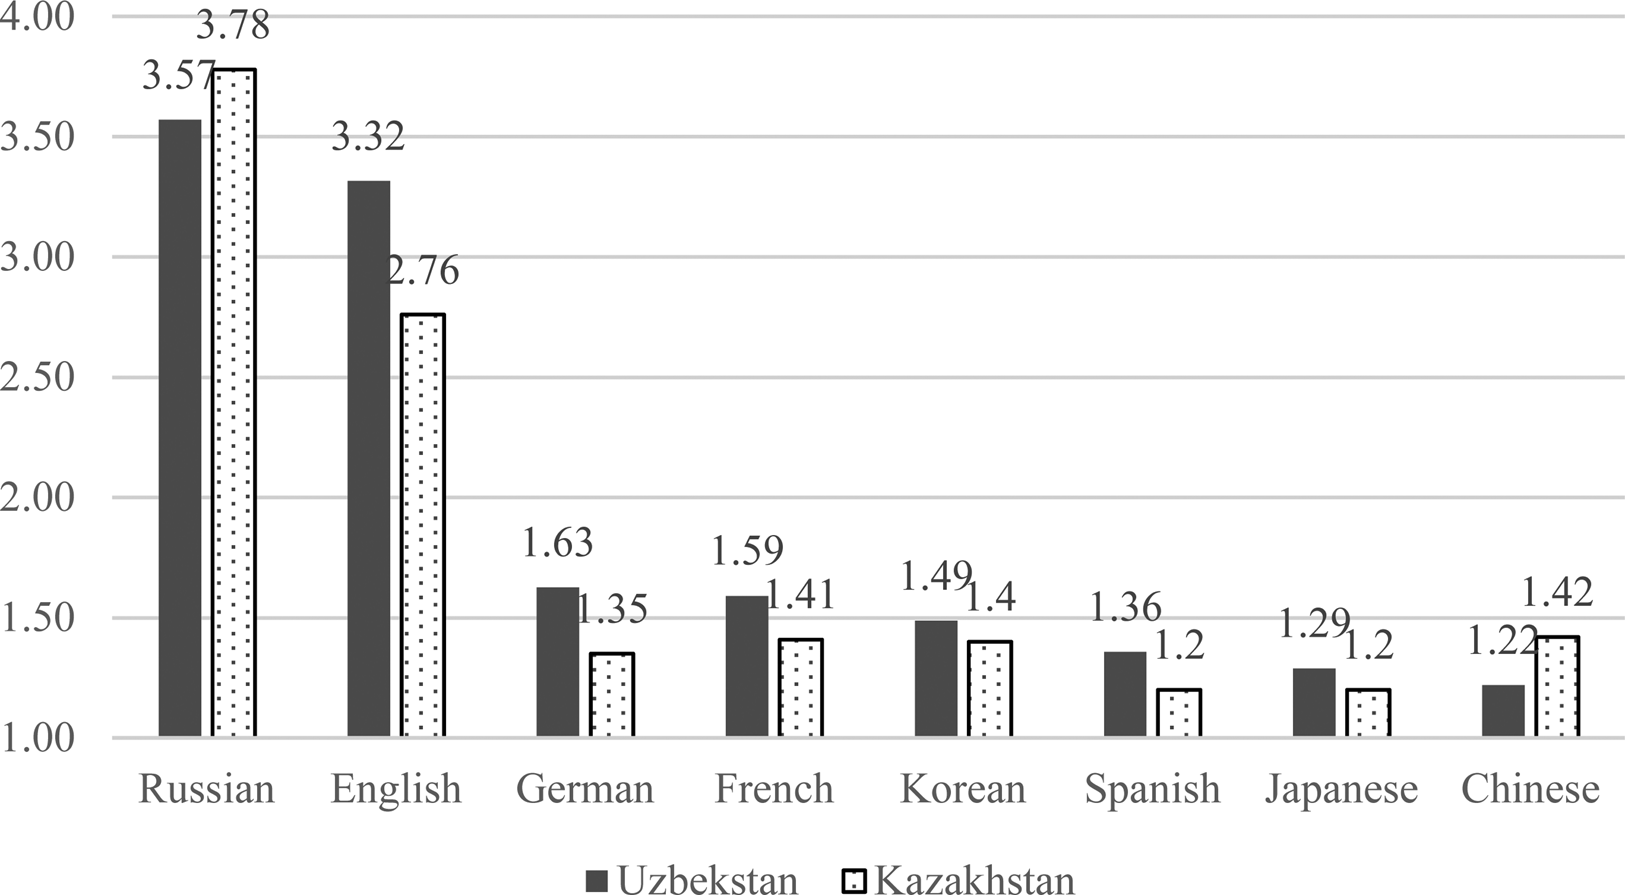
Notably, the above data are an indication of the ideal situation for Uzbek and Kazakh youth. In reality, however, although the majority of those students polled emphasized the importance of English-speaking countries for further studies, their foreign language acquisition still demonstrates that Russian is the language that most respondents either expect to acquired (see Fig. 11) or have factually acquired (see Fig. 12), not English. Given that Russian remains the most widespread foreign language for youth, Russian educational institutions are thus frequently the easiest for them to enter. Compared to local standards of education, Russian educational institutions rate higher in terms of the knowledge they offer to CA students. In addition, many CA students find employment in Russia and an easier pathway to obtaining Russian citizenship after graduating from Russian educational institutions, thus improving their chances in the Russian labor market, which is well known for its discrimination toward CA citizens without Russian degrees or training certificates.
Expectation of language acquisition (from 1 low to 4 high).
Source: Asian Student Survey Third Wave (2018).

Current levels of language proficiency acquisition (from 1 low to 4 high).
Source: Asian Student Survey Third Wave (2018).

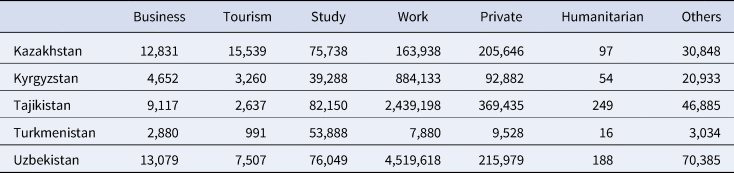
Russian government realizes the role of the Russian language as such important media to deliver Russian perspective to the CA public, especially focusing on the younger generations. In order to support its status, the Russian government has undertaken a two-fold policy. On the one hand, it promoted policy according to which Russian universities provide scholarships and quotas for a great number of CA students for their barrier-free enrollment into Russian educational institutions. Until 2014, their numbers reportedly ranged between 130,000 and 160,000 students (PONARIS 2014). The current data, which include not only university students, but also inclusive of vocational, language, and any other type of education, collected by the Ministry of Internal Affairs of Russia (see Table 1) has the following records of those who registered their residence status as that of students: 82,150 from Tajikistan, 76,049 from Uzbekistan, 75,738 from Kazakhstan, and 39,288 from Kyrgyzstan (MVD RF 2022).

In addition to offering educational opportunities to CA youth, the second pillar of the educational policy supported by the Russian government is the policy of establishing CA branches and campuses of Russian universities or joint universities in the region to promote Russian-language-based education. The largest number of these currently at 15 and increasing is established in Uzbekistan to reflect on the large and young population of the country with a number of branches established in Kazakhstan, Kyrgyzstan, and Tajikistan.
The current language acquisition of Russian language demonstrated in our university students poll, which is the highest among other foreign languages can serve as the data which reflects these educational opportunities offered to CA students.
Such large numbers of people who will potentially seek employment or education in Russia remain one of the factors that have forced CA governments to seek middle-ground positions amid the conflict between Russia and Ukraine. Given CA's large, young, and increasing populations, Russia, for better or worse, remains an available destination that is almost exclusively capable of absorbing such large populations. While concerns remain about the impact of Russian sanctions on remittances and employment opportunities in Russia (Cabar.Asia 2022), for now, the structure of the CA population's dependence on the Russian labor market remains the same.
CA regional developmental agenda and anti-Russian sanctions as developmental opportunities
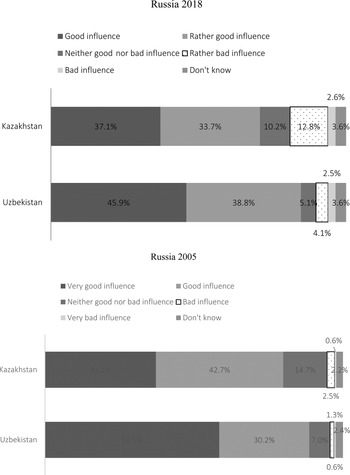
Supporting our argument above, Asian Student Survey Third Wave in 2018 registered Russia as the most favored choice when respondents were asked about the country that contributes the most to the development of their country (see Fig. 13). Similarly, the number of respondents in Kazakhstan who selected Russia as the most contributing country to their nation's development, while slightly decreased from approximately 80% in the 2005 poll, was 70%. In addition, Russia was a preferred destination for children from mixed families where one of the parents is from a different ethnic group (and often nontitular or Russian).
Perception of Uzbek and Kazakh students with respect to Russia.
Source: AsiaBarometer 2005 and Asian Student Survey Third Wave (2018).
Note: 2005 data were obtained from AsiaBarometer 2005. At the time of analysis, those who were in their twenties and graduated from universities were selected to secure comparability with 2018 data.

This can mostly be explained by the largest CA diaspora population being in Russia, the large-scale seasonal migrations of populations from CA region to Russia, and the educational and employment opportunities Russia offers to those who have a certain level of Russian-language fluency. In addition, those students who enroll in Russian educational institutions can study in the Russian language, which for many is easier to acquire than English.
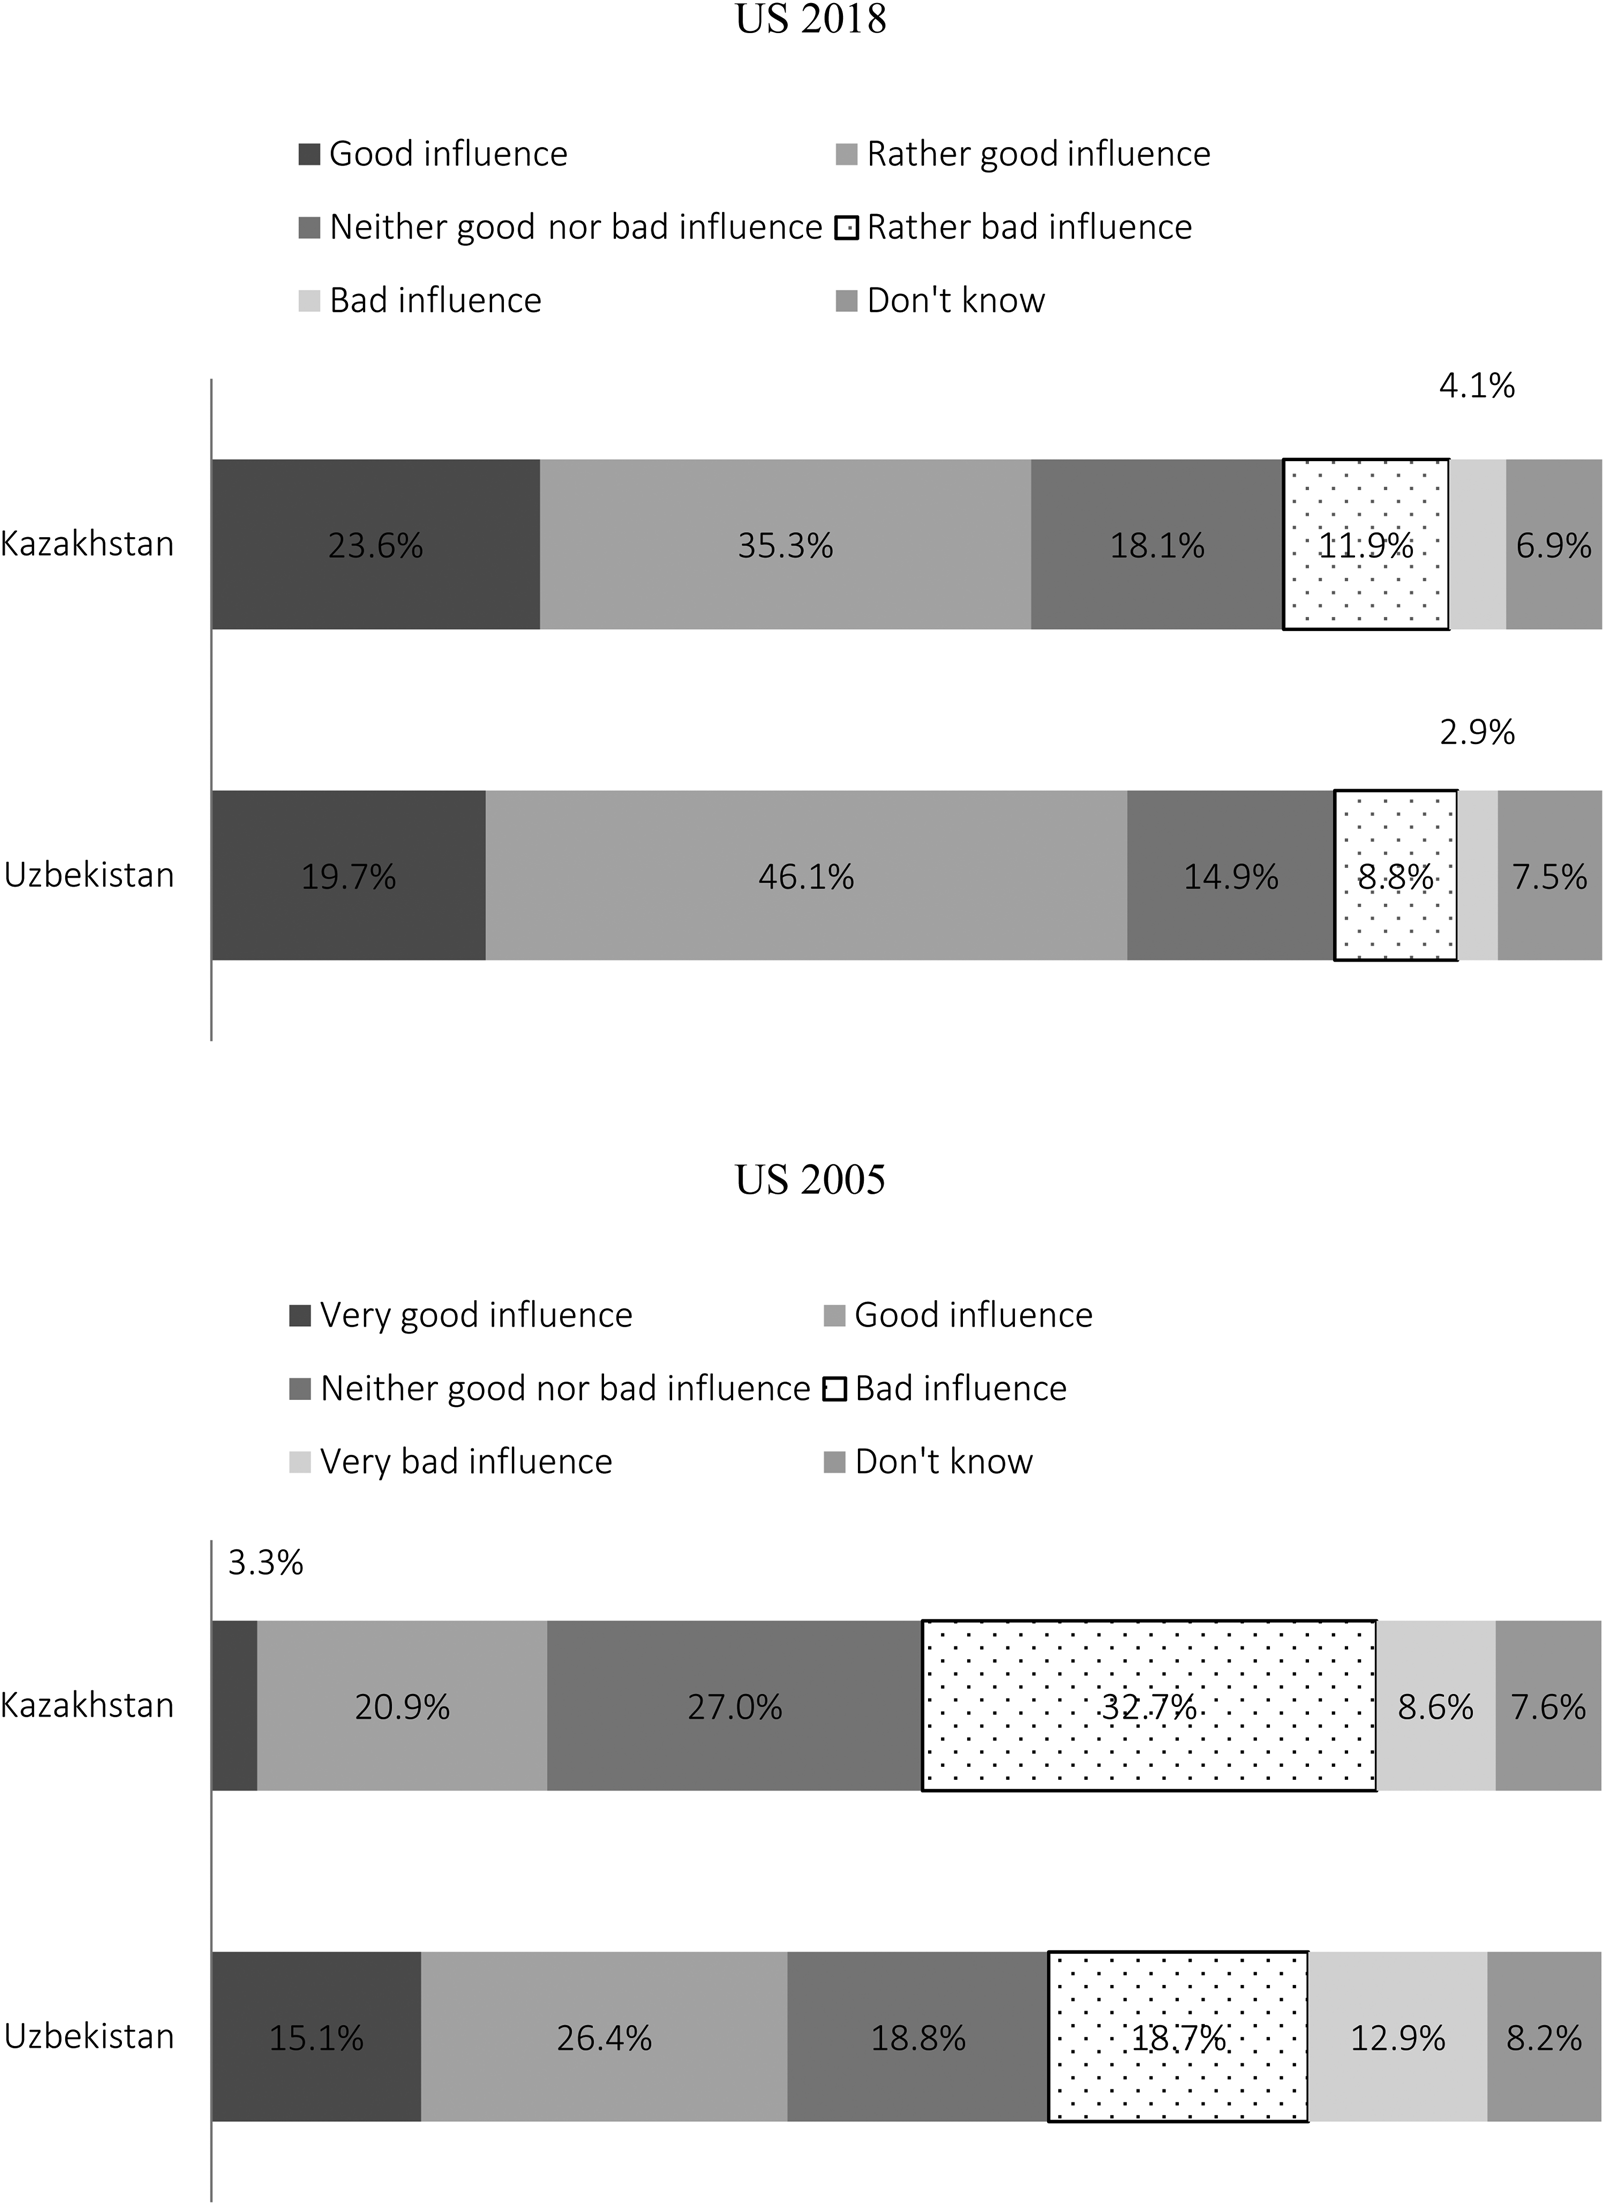
The contrast is obvious when these figures are compared to students' evaluation of the contributions of the USA to Kazakhstan (23.6% for good influence and 35.3% for rather good influence) and Uzbekistan (19.7 and 46.1%, respectively), which received far less support (see Fig. 14). Although the degree of support displayed toward the USA increased between 2005 and 2018 while the support of Russia decreased, there was still a difference that was largely in favor of Russia, which was influenced both by CA's shared information/language space and the large CA diaspora population in Russia.
Perception of Uzbek and Kazakh students with respect to the USA.
Source: AsiaBarometer 2005 and Asian Student Survey Third Wave (2018).
Note: 2005 data were obtained from AsiaBarometer 2005. At the time of analysis, those who were in their twenties and graduated from universities were selected to secure comparability with 2018 data.

Meanwhile, strikingly, such large support rates for leadership in Russia and the numbers of those seeking employment and education in Russia do not necessarily suggest that CA populations support the Russian model of development.
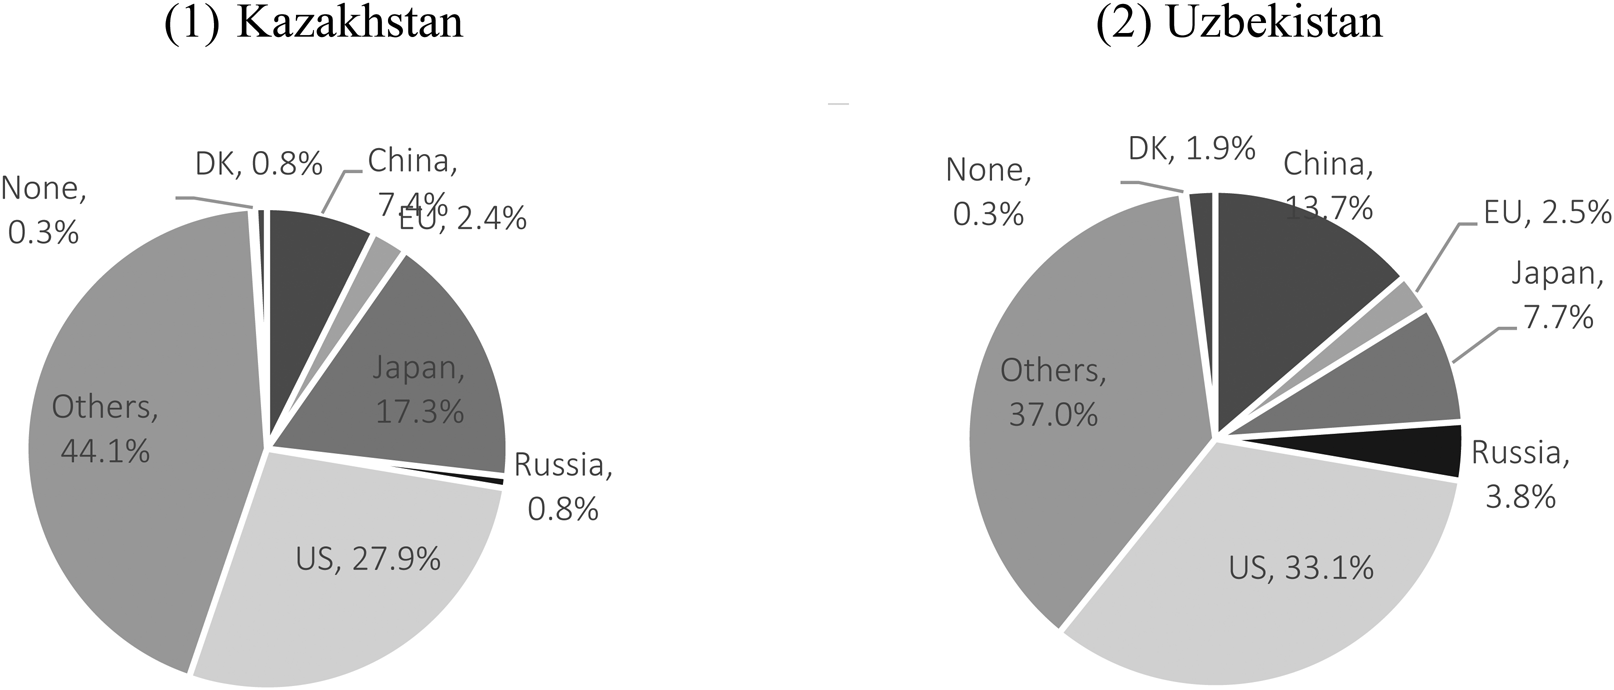
That is, according to the data of the University Students Poll of 2018, the number of surveyed students who advocated the Russian model of economic development in Uzbekistan was only 3.8%, while in Kazakhstan, it only accounted for 0.8%.
In contrast, the majority of CA youth aspired to adopt the US model of economic development and free enterprise, with 33.1% of Uzbek youth advocating this model, followed by 27.9% of Kazakh youth in favor of it. The Japanese economic model, combining state incentives while safeguarding free-market principles for enterprises, was favored by 17.3% of youth in Kazakhstan and 7.7% of youth in Uzbekistan. The Chinese economic model of state-led economic growth was the third favored model, with 13.7% of Uzbeks and 7.4% of Kazakhs favoring such a developmental path (see Fig. 15).
Model of economic development.
Source: Asian Student Survey Third Wave (2018).

In regard to development in the post-Ukrainian war environment, many among the populations and policy-makers in CA regional states fear the impact of the Russian sanctions on CA economies and households (see, for instance, Kumenov Reference Kumenov2022a; Lillis Reference Lillis2022a). Those countries within the Eurasian Economic Union such as Kazakhstan, Kyrgyzstan, and Tajikistan fear that the sanctions imposed on Russia will also have a damaging effect on their investments, markets, and industrial production levels (Kumenov Reference Kumenov2022b). Countries that are not part of the EEC such as Uzbekistan and Turkmenistan fear the sanctions' impact on the financial remittances of their citizens who work in Russia and support their family households in their respective countries (Lillis Reference Lillis2022b). In addition, they are aware of the negative influences of Russian sanctions on trade and economic infrastructure connected to the Russian economy (Hess Reference Hess2022), which is driving the exits of organizations that are economically connected to Russia (Ibraimov Reference Ibraimov2022). On the other hand, these governments also discern the beneficial aspects of the sanctions imposed on Russia. For example, they identify the opportunities of operating as a bridge between the Russian economy and Western economic interests when direct interactions between Russian enterprises and Western companies are impeded by economic sanctions (Ria.Ru 2022).
Specifically, they aim to fill the gaps in air-transit services provided to Russian tourists (because Aeroflot cannot operate in Europe and elsewhere), serve as tourist destinations for the Russian public (who are cut off from other major touristic markets), and provide various goods (agricultural products, machinery, etc.) and services (financial remittances through CA banking institutions, etc.) (Kumenov Reference Kumenov2022c). Such a structure entails that the CA governments are less interested in openly voicing their concerns with respect to Russia's actions in Ukraine.
The introduction of sanctions on Russian and Russia-based enterprises has caused an exodus of not only Western companies from Russia, but also internationally competitive Russian enterprises, many of which have preferred to relocate to areas close to Russia. The South Caucasus and Central Asia have been directly affected by this process. Kazakhstan, Kyrgyzstan, and Uzbekistan currently serve as potential countries for IT-related companies' relocation because they have Russian-speaking populations and labor forces that are able to accommodate the needs of these companies both linguistically and professionally, and because these countries are considered friendly toward Russia (Eurasianet 2022). They have not imposed sanctions against Russia, they have functioning Russian payment systems, and their transportation networks with Russia remain largely unaffected, with daily air flights available between various Russian cities and these CA countries. Local entrepreneurs and policy-making officials in these countries have easily adapted to the needs of these Russian enterprises by introducing special residence permits and preferential treatment for them. Kazakhstan and Kyrgyzstan are part of the EEC and have no trade tariffs between them, serving Russia again as comfortable bases for companies affected by Western sanctions.
Under such conditions, both the general public and government officials have little, if any, incentive to impose sanctions on Russia or encourage their populations to vocally state their opinions. Indeed, most of these states have attempted to utilize their position as a bridge between Russia and the West to benefit their economies with the opportunities that have been unexpectedly afforded them by the war between Ukraine and Russia and the strong Western responses to it.
Conclusions
Throughout this paper, we have emphasized that the reactions of CA governments and populations to the Russian invasion of Ukraine need to be conceptualized as strategic silences. Such silences do not need to be considered withdrawals from international affairs. Rather, they are the result of a shared Russian information space that provides CA with the Russian narrative of events. In addition, the constrained reactions of CA governments have been attempts to facilitate the developmental agenda of CA states and employment opportunities for their general population.
In addition, these responses of CA governments and public officials also show the signs of being hybrids of their own personal perceptions, the importance of both Russia and Ukraine for them, the importance of their own sovereignty, and a mixture of public emotions with respect to this aggression. We already indicated that because of the structure of dependence on Russia in terms of remittances and seasonal labor, governments in Uzbekistan, Kyrgyzstan, and Tajikistan are cautious about not antagonizing Russia. This is partly a pattern of how public officials are informed (and bound) by the general public needs and perceptions.
In this sense, although CA governments are autocratic in their majority, their responses to Ukraine are not necessarily one-way communication between the public and officials. In recent years, these responses are also being informed by various NGOs, intellectuals, and public activists in addition to seasonal laborers.
Accordingly, we have shown how CA's shared linguistic space (often dominated by Russian mass-media and Russian-language programs) and close network of interdependence regarding educational and labor opportunities have impacted how policy-makers and the public have digested Russia's invasion of Ukraine.
Furthermore, we suggest that because the CA region is located in close proximity to Russia and China, CA states' interactions and influences are often limited to these powers. While countries such as Ukraine, Georgia, and Moldova, which strongly support Western liberal values, border the EU, the CA region shares borders with states that are not necessarily friendly toward Western notions and ideas, such as Russia, China, Afghanistan, Iran, and Turkey. Therefore, these factors are primarily responsible for why CA states and populations have not rushed to support anti-Russian rhetoric; they do not perceive such rhetoric to be driven by universal values to eliminate war but rather as another Western attempt to harm non-Western rivals in Eurasia.
Finally, we argue that CA states consider the situation developing around Russia at once potentially damaging to and beneficial for their development prospects. On the one hand, these states are fearful of the potential sanctions that may be imposed on them for operating with Russian entities. On the other hand, they also grasp the great opportunities offered by operating as a bridge between the Russian economy and Western economic interests while direct interactions between Russian enterprises and Western companies are hindered by economic sanctions. In addition to deeming Russia a labor market for migrants from CA states, they grasp the emerging opportunities amid the harsh economic sanctions that have been imposed on Russia. Therefore, they aim to fill the gaps in air-transit services provided to Russian tourists (because Aeroflot cannot operate in Europe and elsewhere), serve as tourist destinations for the Russian public (who are cut off from other major touristic markets), and provide various goods (agricultural products, machinery, etc.) and services (financial remittances through CA banking institutions, etc.). Hence, in such a structure, CA governments are less interested in openly voicing their concerns with respect to Russia's actions in Ukraine.
Acknowledgment
We would like to thankfully acknowledge the constructive and very insightful comments of two anonymous reviewers. In addition, we are very grateful to Professor Takashi Inoguchi and Ambassador Akio Kawato for their invaluable comments and encouragement regarding the first pre-submission draft of this paper.
Information on Funding
Parts of the current study have been funded by the Japanese Society for the Promotion of Science Grant-in-Aid for scientific research No. 21K12400 and No. 21H00686.