Introduction
Potato (Solanum tuberosum Linnaeus; Solanaceae) growers in North America struggle to prevent economic losses caused by Bactericera cockerelli (Šulc) (Hemiptera: Psylloidea: Triozidae). Bactericera cockerelli is a small, phloem-feeding insect having host plants primarily in the Solanaceae. The pest occurs in Mexico, Central America, and western North America as far north as southern Canada (Pletsch Reference Pletsch1947; Munyaneza et al. Reference Munyaneza, Crosslin and Buchman2009; Horton et al. Reference Horton, Cooper, Munyaneza, Swisher, Echegaray and Murphy2015; Johnson et al. Reference Johnson, Kawchuk and Meers2017). Damage to potato is due to a toxin transmitted during the feeding process, and to a bacterium, “Candidatus Liberibacter solanacearum” Liefting et al. (Phyllobacteriaceae) (causal agent of zebra chip disease), that is vectored by B. cockerelli (Munyaneza et al. Reference Munyaneza, Crosslin and Upton2007). This pathogen is closely related to the bacterium that causes huanglongbing (“citrus greening”) in citrus crops (Hansen et al. Reference Hansen, Trumble, Stouthamer and Paine2008). Zebra chip was first documented in 1994 near Saltillo, Mexico (Secor et al. Reference Secor, Rivera, Abad, Lee, Clover and Liefting2009). Initial records in the United States of America are from southern Texas in the growing season of 2000 (Secor et al. Reference Secor, Rivera, Abad, Lee, Clover and Liefting2009). Infected fields subsequently were documented in a number of other states, eventually showing up in the potato growing regions of Washington, Idaho, and Oregon in 2011 (Crosslin et al. Reference Crosslin, Hamm, Eggers, Rondon, Sengoda and Munyaneza2012a, Reference Crosslin, Olsen and Nolte2012b; Munyaneza Reference Munyaneza2012).
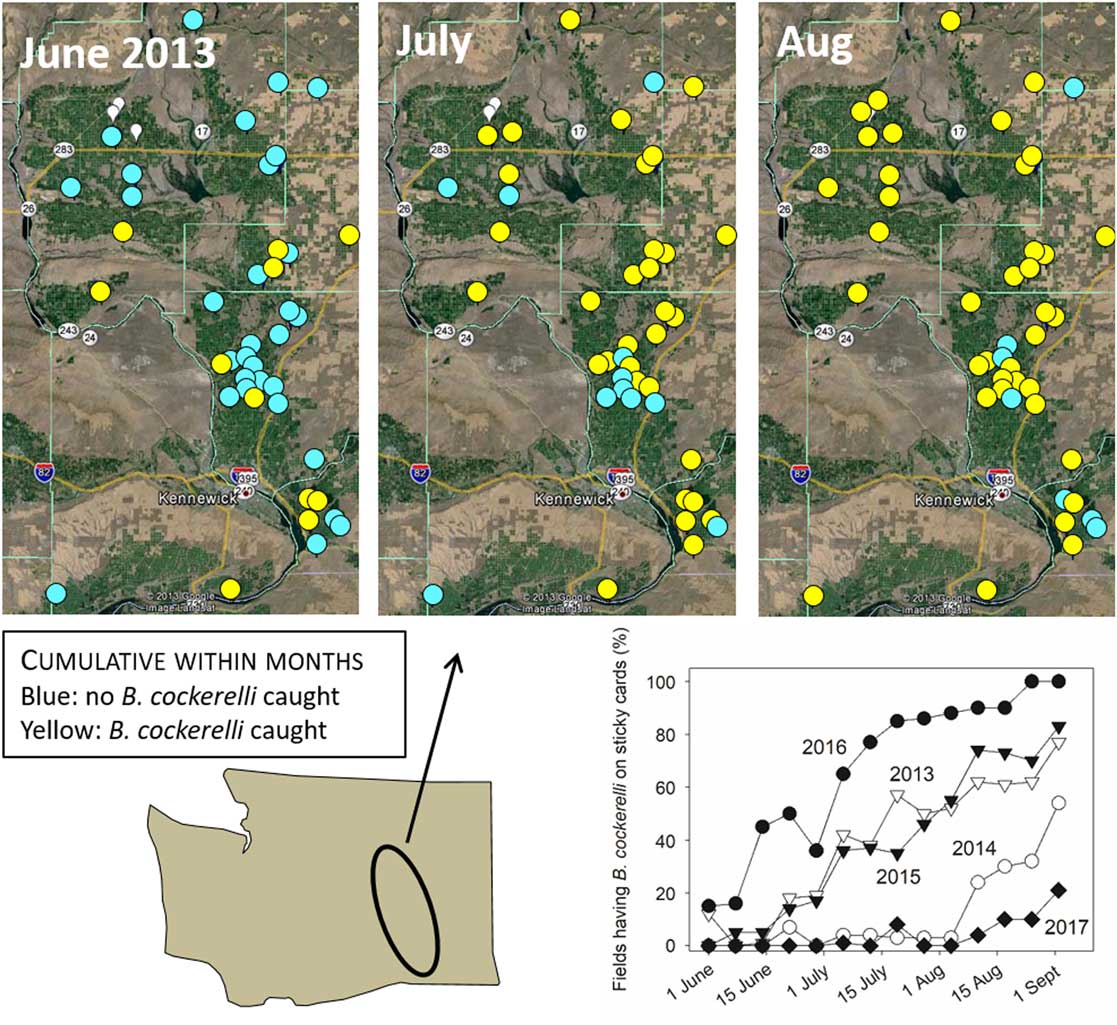
Preventing zebra chip disease requires control of the B. cockerelli vector. Growers in the Pacific Northwest have largely abandoned integrated pest management programmes in favour of calendar-based applications of insecticides. These applications begin in late spring once B. cockerelli has been detected in fields. Bactericera cockerelli arrival in fields is unpredictable year-to-year and field-to-field (Johnson et al. Reference Johnson, Kawchuk and Meers2017; Wenninger et al. Reference Wenninger, Carroll, Dahan, Karasev, Thornton and Miller2017; Wohleb Reference Wohleb2017), and this unpredictability complicates knowing what dates insecticide applications should be initiated. Due to these uncertainties, landscape-wide monitoring programmes for B. cockerelli have been implemented in potato growing regions of Washington State, Idaho, northern Oregon, and southern Canada for the purpose of detecting B. cockerelli arrival (Johnson et al. Reference Johnson, Kawchuk and Meers2017; Wenninger et al. Reference Wenninger, Carroll, Dahan, Karasev, Thornton and Miller2017; Wohleb Reference Wohleb2017). Bactericera cockerelli are monitored using yellow sticky cards, placed in multiple potato fields over the duration of the growing season (Fig. 1). The line graph in Figure 1 illustrates the difficulties facing growers in predicting arrival in fields. In some years, B. cockerelli may arrive in large numbers beginning as early as late May (Fig. 1: 2016), whereas in other years arrival is delayed until well into June (Fig. 1: 2014). Bactericera cockerelli generally first appear in a small subset of fields, but then spread to colonise most fields within the monitoring region (Fig. 1). Rates of spread among fields also vary year to year (Fig. 1: compare 2014 and 2016).
Maps showing the results of season-long trapping in central Washington potato fields. Each yellow or blue circle depicts a single field: blue – no B. cockerelli captured on sticky cards at that location; yellow – at least one B. cockerelli captured on sticky cards at that location. Black oval shows the trapping location within state. Panel at bottom right shows seasonal progression in percentage of fields at which sticky cards captured at least one Bactericera cockerelli summarised by year. Figures modified from figures and data in Horton et al. (Reference Horton, Cooper, Munyaneza, Swisher, Echegaray and Murphy2015) and Wohleb (Reference Wohleb2017).

An additional important function of these monitoring programmes is to provide specimens for estimating what fraction of the B. cockerelli population is carrying the zebra chip pathogen (Johnson et al. Reference Johnson, Kawchuk and Meers2017; Wenninger et al. Reference Wenninger, Carroll, Dahan, Karasev, Thornton and Miller2017; Wohleb Reference Wohleb2017). Specimens collected on cards are assayed using polymerase chain reaction to determine whether B. cockerelli arriving in a region include individuals that are carrying the zebra chip pathogen. These data have been valuable in allowing scientists and pest control advisors to monitor region-to-region and year-to-year variation in infectivity of the B. cockerelli population (Wenninger et al. Reference Wenninger, Carroll, Dahan, Karasev, Thornton and Miller2017; Wohleb Reference Wohleb2017). Sticky cards allow researchers to collect large numbers of specimens over large geographic regions in a relatively short time.
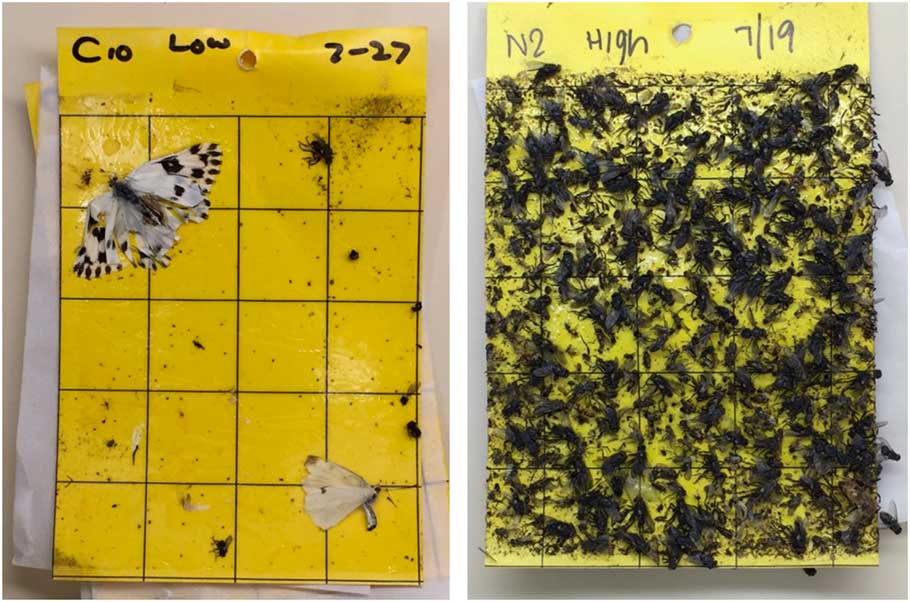
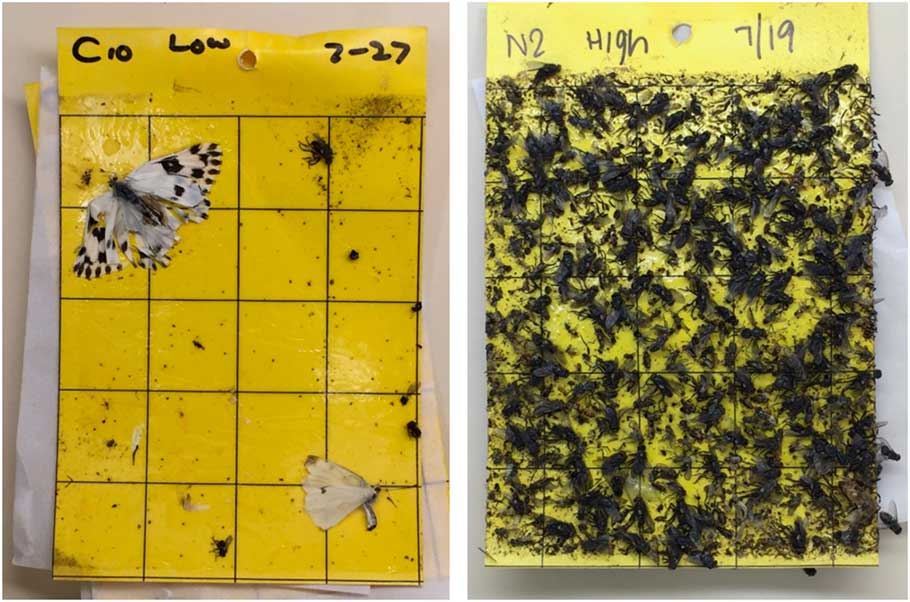
The yellow sticky cards used to monitor potato psyllid exploit the tendency of Psylloidea to be attracted to yellow (Adams et al. Reference Adams, Domeisen and Ford1983; Krysan and Horton Reference Krysan and Horton1991; Hall Reference Hall2009). While cards do indeed intercept B. cockerelli as the insects enter fields, they have drawbacks. A major drawback is that insects other than psylloids are attracted to yellow, and this leads to often massive captures of nontarget species that add to difficulties in examining cards and detecting the target species (Fig. 2). Cards are also sticky and difficult to process, and are difficult to store if needed for additional evaluation or examination. The actual dollar cost of cards can be a drawback. Sticky cards are replaced weekly, and to monitor a large geographic region and multiple fields over an entire growing season (Fig. 1) requires a large investment in cards. Season-long monitoring in central Washington State leads to an up-front expense approaching USD$9000 for the purchase of sticky cards. Finally, deterioration of specimens on cards due to summer temperatures or sunlight affects how well molecular assays detect the zebra chip pathogen in specimens (Katie Wentz, Heritage University, Toppenish, Washington, United States of America, personal communication). A trap that accumulates specimens directly into a preservative would provide specimens more amenable to molecular work than those removed from sticky cards.
Standard yellow sticky card from potato fields showing the range of variation in capture of nontarget insects. Each square is 2.5 × 2.5 cm.
These shortcomings prompted us to search for an alternative monitoring tool. A suitable alternative would have the following traits: captures B. cockerelli, but is less prone than sticky cards to accumulate nontarget insects; is seasonally less costly than sticky cards; is easy to service; will preserve specimens for molecular work; and, critically, captures B. cockerelli when densities are low, most notably beginning in late May when B. cockerelli arrive in fields (Fig. 1). In this study, we field-tested a prototype trap constructed using three-dimensional (3D) printing technology. The prototype was created as part of an ongoing project of the Florida Department of Agriculture and Consumer Services, Division of Plant Industry (Gainseville, Florida, United States of America) to develop a trap for monitoring Diaphorina citri Kuwayama (Hemiptera: Psylloidea: Liviidae). The technology creates 3D objects from digitally produced designs, by depositing successive layers of heated plastic until the final product having the size and shape of the digital model has been created. We compared the numbers of B. cockerelli captured by the standard yellow card to numbers collected by a prototype trap developed for D. citri. By comparing trap catch between paired prototype traps and sticky cards, at multiple potato fields, we could compare the efficiency of the prototype trap and sticky card in monitoring the target insect. Because the study encompassed the duration of the growing season, we were also able to test whether the efficacy of the prototype trap changed as B. cockerelli numbers in fields increased seasonally. Finally, we identified and counted nontarget insects in traps and on cards to determine whether the prototype trap reduces accumulation of nontarget taxa that often inundate yellow sticky cards.
Materials and methods
Trap development
Construction and field-testing of a prototype trap proceeded through a series of steps. The initial design work was done by the Florida Department of Agriculture and Consumer Services, Division of Plant Industry in developing traps for D. citri. Digital models were created using Rhinoceros 5 software (www.rhino3d.com). Models were designed taking into consideration known behavioural traits of Psylloidea, notably psylloid attraction to yellow and the tendency of psylloids to walk upwards towards light. Traps were constructed from digital images by use of a MakerBot Replicator 2 printer (MakerBot Industries, Brooklyn, New York, United States of America), and then examined for attractiveness to D. citri by hanging traps in psylloid-filled cages. The cage trials allowed us to visually monitor whether psylloids landed on traps and then entered the trap interior, or whether the characteristics of traps appeared to interfere with psylloid behaviour or prevent entry into traps. Poor behavioural response or failure of psylloids to enter traps led to changes in the digital model and to construction and testing of new designs. A trap shown to readily accumulate D. citri in cage trials (hereafter referred to as the “prototype trap”) was then forwarded by the Florida Department of Agriculture and Consumer Services, Division of Plant Industry to United States Department of Agriculture, Agricultural Research Service cooperators in Washington State for field trials with B. cockerelli.
Field trial
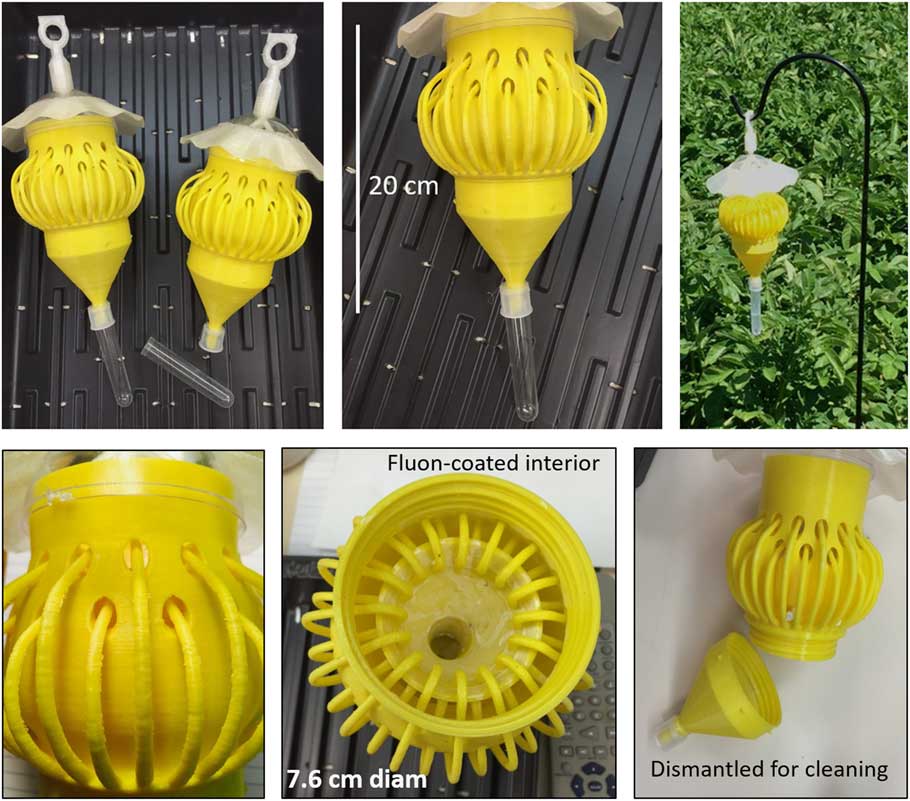
We examined capture of B. cockerelli in the prototype trap and on yellow sticky cards from the first week of June to the end of August 2016 at potato fields in Washington State (Grant, Adams, and Franklin counties). The prototype trap was constructed of 1.75 mm yellow filament (Verbatim PLA; www.verbatim.com/prod/3D-printing/PLA%20Filament%201.75mm/verbatim-pla-filament-3.00mm-yellow-sku-55259) topped with a partly clear dome-like awning (purchased from a local hobby shop) to prevent accumulation of water and debris (Fig. 3). The clear portion of the top allowed light to filter through and encourage upwards movement by psylloids that had landed on the trap. Multiple curved “stems” on the exterior of the trap travelled upwards and entered the trap through entry holes (12.7 × 9.5 mm). These stems acted to guide psylloids to the entry holes. Stems connect to a funnel on the interior of trap, which in turn funnels insects into the collection vial attached at the bottom of the trap (Fig. 3). A thin coating of fluon (Insect-a-slip; BioQuip Products, Rancho Dominguez, California, United States of America) was applied to the interior funnel of the trap to reduce surface friction of the funnel (Fig. 3). Observations made during the cage trials indicated that psylloids travelled upwards along these stems and entered the holes, eventually falling through the fluon-coated funnel and into the fluid-filled vial attached at the bottom of the trap. Trap exteriors were coated with a thin layer of a clear rubberised sealant (Flex Seal; www.flexsealproducts.com), as cage assays with D. citri showed that the sealant led to improved mobility of psylloids on the trap exterior and to higher rates of catch.
Prototype trap examined in potato fields, June–August 2016.

The prototype was tested in 15 commercial potato fields located within the larger trapping network (Fig. 1) currently managed by Washington State University. Prototype traps were suspended from Shepherd’s hooks (Fig. 3) at approximately 1 m above ground level, in a perimeter row of each field. A single trap was used at each location. Collecting vials were each filled with approximately 5 mL of preservative (75% ethanol). Each trap was paired with two of the standard (12.7 × 10.2 cm) yellow sticky cards. The two-sided cards are subdivided on both faces into 20 squares (each square 2.5 × 2.5 cm; Fig. 2) and we used these squares extensively as we examined cards for nontarget species (see following paragraphs). Cards were clipped to wooden stakes at two heights above ground level: at the same height of the prototype trap approximately 1 m above ground level; hereafter, “upper” cards); or, at canopy level (hereafter, “lower” cards). Both heights were tested at each location. Both cards at a given location were placed within 5 m of the prototype trap.
Traps and cards were placed in the field the first week of June and monitored weekly until the last week of August. Collection vials on prototype traps were replaced each week with new vials and fresh preservative. Vial contents were then examined for B. cockerelli and for nontarget species. Counts of psylloids were analysed within three seasonal intervals to reflect time periods of biological interest: (1) the arrival period, encompassing the first week of June (= onset of test) to 22 June (hereafter “June”); (2) 29 June through July (hereafter “July”); and (3) 1 August to the end of the trial in late August (hereafter “August”). We were particularly interested in efficacy of traps during the June interval, as monitoring at this time is important in allowing growers to make informed decisions about initiating B. cockerelli controls (Fig. 1). Captures of B. cockerelli in July and August are assumed to reflect B. cockerelli arrival from outside sources supplemented to an unknown extent by capture of within-field residents. Counting of nontarget arthropods was limited to the critical June sampling period. Nontarget specimens other than aphids and psyllids were classified to order or family. Aphididae were identified to species to evaluate whether the prototype trap, in addition to capturing B. cockerelli, might also be useful for monitoring aphid pests arriving in potato fields. Nontarget psylloid species were monitored due to interest by Florida cooperators in determining whether the prototype trap might be of use in monitoring for arrival of exotic psylloids in Florida.
Yellow sticky cards were replaced weekly on the same days that vial contents from the prototype traps were collected. Bactericera cockerelli numbers were again summarised by seasonal interval. Each sticky card was scanned three times to obtain psylloid and nontarget data. First, the entire surfaces of both sides of each card were scanned for captures of B. cockerelli. Following that initial scan, six randomly selected squares on each card (three per side) were examined for nontarget specimens other than Thysanoptera. Once we had counted and categorised the nontarget specimens in those six squares, two squares in each card were examined for Thysanoptera. Nontarget specimens other than psylloids were categorised by order and family. We made no attempt to identify aphids to species, but pooled specimens into a single category (Aphididae). Nontarget psylloids were identified to species. We again limited the examination of nontarget specimens to the June sampling interval.
Results
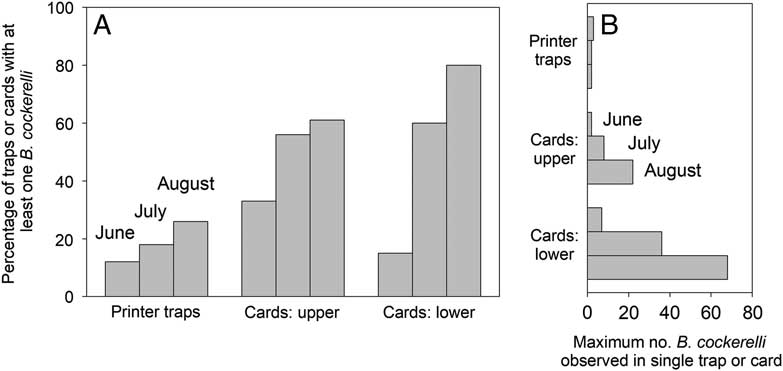
Percentage of prototype traps capturing at least one B. cockerelli increased from 12% of traps to 27% of traps between June (arrival in fields) and August (Fig. 4A: data pooled across fields and across weeks within month). Sticky cards showed the same seasonal increase in B. cockerelli presence, but with percentage values substantially larger than found for the prototype trap in July and August (Fig. 4A). The maximum number of B. cockerelli captured by the prototype trap never exceeded three specimens per trap (Fig. 4B). The maximum number of psylloids captured per sticky card was similar to what was observed for the prototype trap during the June arrival period, but was considerably larger than numbers accumulating in the prototype trap during July and August (Fig. 4B). One sticky card at the lower height in August was found to have captured 68 B. cockerelli, substantially dwarfing all results for the prototype trap in August (Fig. 4B).
Seasonal comparisons of prototype trap and sticky cards (upper: card is at height of prototype; lower: card is at canopy-level). A, Percentage of traps or cards in which at least one Bactericera cockerelli was captured, summarised by month; B, maximum numbers of B. cockerelli captured by single trap or card, summarised by month.

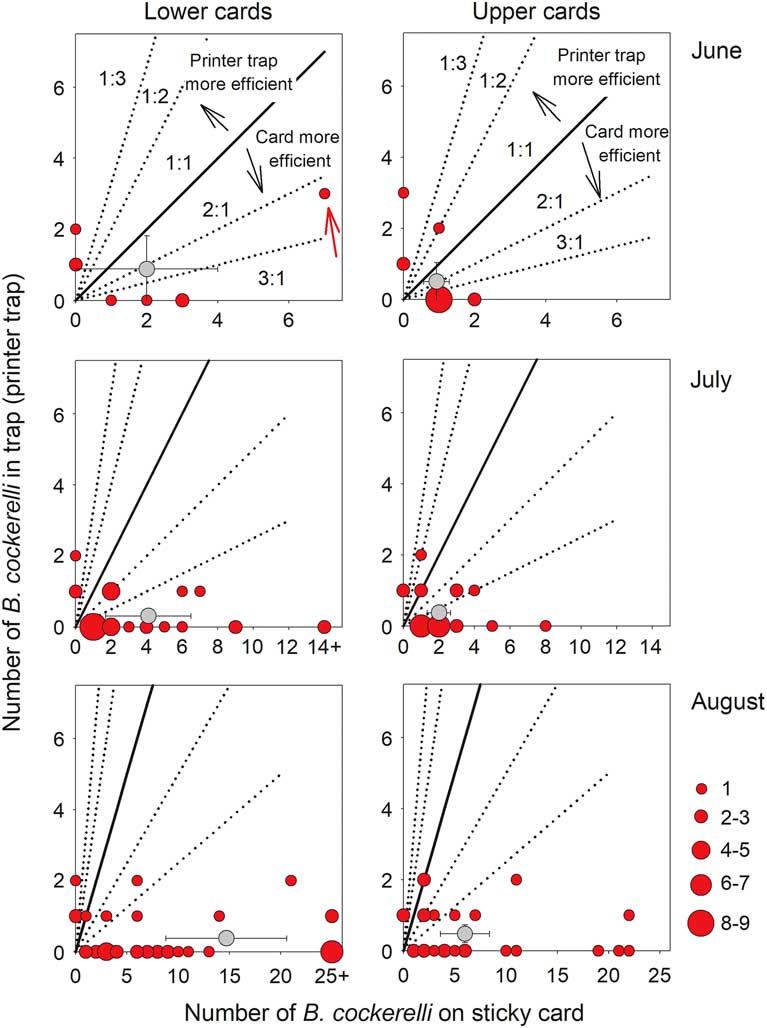
We examined the efficiency of the prototype trap versus sticky cards in capturing B. cockerelli by plotting numbers of B. cockerelli captured in the prototype trap against numbers captured by the sticky card with which the trap had been paired (Fig. 5). As an example, the red arrow in the June/lower card panel of Figure 5 points to a sample in which the prototype trap captured three B. cockerelli while the (lower) sticky card with which the prototype had been paired captured seven B. cockerelli over that same weekly sampling period. Size of the red bubbles is proportional to frequency of samples producing a particular combination of paired trap versus card captures. The bubble to which the red arrow points is small and indicates that a single sample produced this combination of trap versus card captures. The largest bubble depicts a frequency of 8–9 samples showing the specified combination of captures. A solid diagonal line was added to each plot to indicate the position on the plot in which captures by the prototype trap would be equivalent to numbers accumulating on the sticky card with which the prototype was paired. Points above the solid diagonal line indicate that captures by the prototype trap were larger than captures on the card with which the prototype had been paired, while points below that line indicate that cards were more efficient than the prototype. The grey circle in each plot shows mean (with the 95% confidence interval) number captured. The results in Figure 5 exclude all observations in which both the prototype and the card with which it was paired failed to collect B. cockerelli.
Efficacy figures comparing B. cockerelli numbers in prototype traps against numbers captured by the sticky card with which the trap had been paired. Data are summarised by month and by card height. Upper: card is at height of prototype; lower: card is at canopy level. Red circles depict the number of samples in which a particular trap – card combination in psylloid captures was observed; size of circle proportional to the frequency of samples. The figures exclude all samples in which both the prototype trap and the card with which it was paired failed to capture a B. cockerelli. The solid diagonal line shows the region in plot in which capture rates were equivalent between trap and card. Dashed diagonal lines show the varying levels of trap versus card efficacies. Grey circles show mean trap and card catch (95% confidence interval). Red arrow in June/lower card panel: see text.

Most of our samples fell either on the x-axis or on the y-axis, indicating that cards captured B. cockerelli when the prototype did not (observations falling on x-axis) or that the prototype captured B. cockerelli without accompanying captures by cards (observations falling on y-axis). Most of our results fall below the solid diagonal line, indicating that capture rates were higher on the sticky cards than in the prototype traps. The seasonal shift in location of the grey circle shows that the efficiency of the prototype trap relative to sticky cards changed seasonally. Efficiency of the prototype declined noticeably between the June (arrival) period and the July or August monitoring periods. That is, we estimate that two to three prototype traps would be needed to accumulate as many B. cockerelli as a single yellow sticky card during the June monitoring period (note position of the grey circles in the June panels of Fig. 5), whereas this ratio jumped to almost 40 prototype traps for the August sample paired against the canopy-level (“lower”) cards. Bactericera cockerelli numbers on sticky cards in August may often jump as surrounding potato fields are harvested, and it is likely that increases in capture rates during mid-August to late-August included B. cockerelli displaced by harvest of neighbouring potato fields.
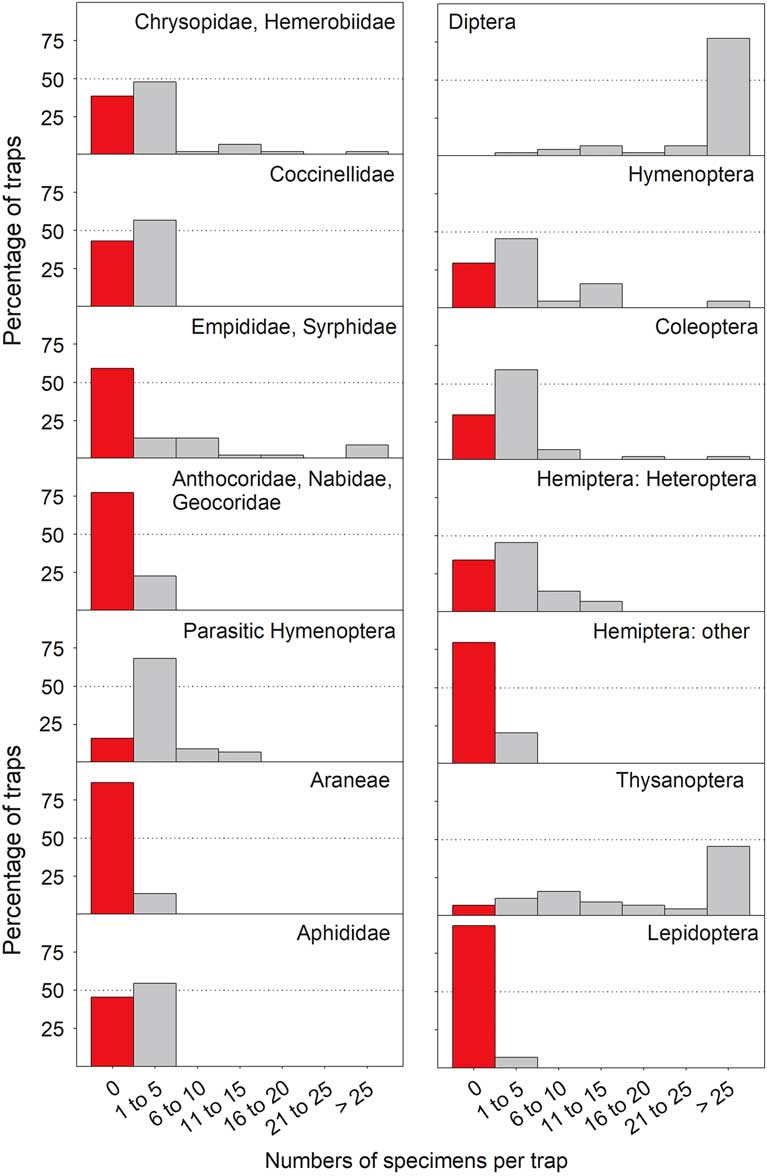
Captures of nontarget arthropods by the prototype trap were pooled across fields and weeks and are summarised as percentage of trap samples in which a given number of specimens were captured per trap (Fig. 6). Taxa of possible interest in biological control or other integrated pest management programmes are shown in the seven panels in the left column of Figure 6. The panels in the right column of Figure 6 show data for the remaining specimens. Weekly captures exceeded 25 specimens per trap for some taxa, notably Thysanoptera and nonpredatory Diptera, as shown by the rightwards skew of histograms along the x-axis (Fig. 6). Taxa for which the samples skew to the left indicate that specimens were rare in traps; red bars show the percentage of traps in which no specimens of that taxon were collected.
Nontarget taxa accumulating in prototype trap. Bars indicate the percentage of traps showing specified numbers of specimens per trap; red bars indicate the percentage of traps in which the nontarget was not collected. Samples limited to June collections; fields pooled. Panels in column at left: taxa of possible interest in integrated pest management studies (i.e., beneficial arthropods and aphids); panels in column at right: remaining taxa.

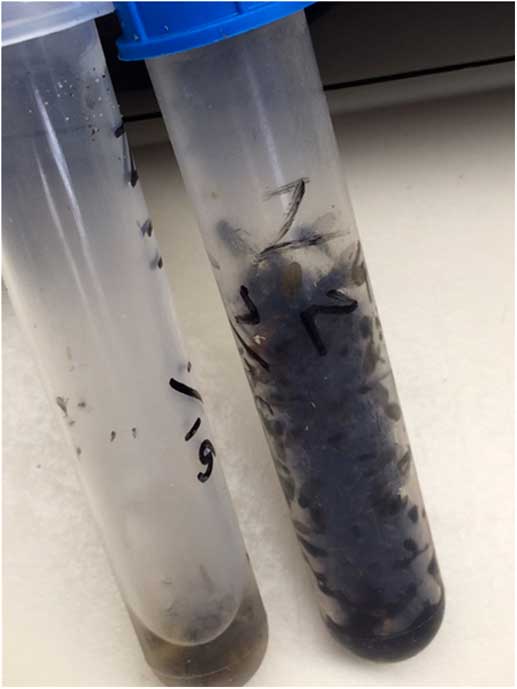
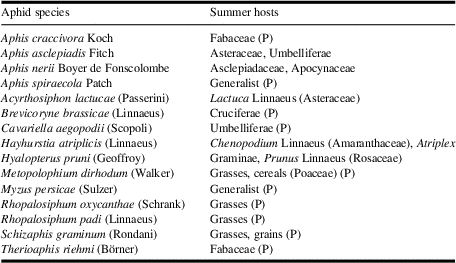
The prototype trap in some samples accumulated surprisingly large numbers of relatively large arthropods, including Neuroptera and Syrphidae (Diptera) (Fig. 6). Other beneficial arthropods in trap vials included Coccinellidae (Coleoptera), Heteroptera (Hemiptera), Araneae, and parasitic Hymenoptera. Nontarget Psylloidea were also captured, and included specimens from three families: Aphalaridae (Aphalara Förster; hosts likely Polygonaceae); Psyllidae (Cacopsylla pyricola (Förster); host Pyrus Linnaeus (Rosaceae)); and Triozidae (Heterotrioza chenopodii (Reuter); host Atriplex Linnaeus (Amaranthaceae)). Collection of these nontarget specimens suggests that the prototype trap could be used to help monitor certain arthropod taxa of importance in pest management. Traps unfortunately also accumulated sometimes very large numbers of Diptera unlikely to be of interest in agricultural studies (Figs. 6–7). Vials with large numbers of Diptera often had noticeable odour of decay, and it may be that these odours were attractive to Diptera and contributed to the large numbers of flies seen in some vials. The prototype trap was also found to collect aphids (Fig. 6). Species of aphids accumulating in the prototype trap included the known pests of row and forage crops, as well as species of common occurrence on weedy plants in the study area (Table 1).
Photograph showing the extremes in numbers of nontarget specimens accumulating in vials. Vial at right contains very large numbers of Muscoidea (Diptera).

Species of aphids accumulating in prototype trap and summer hosts of those species; (P), species is known pest in row or forage crops.

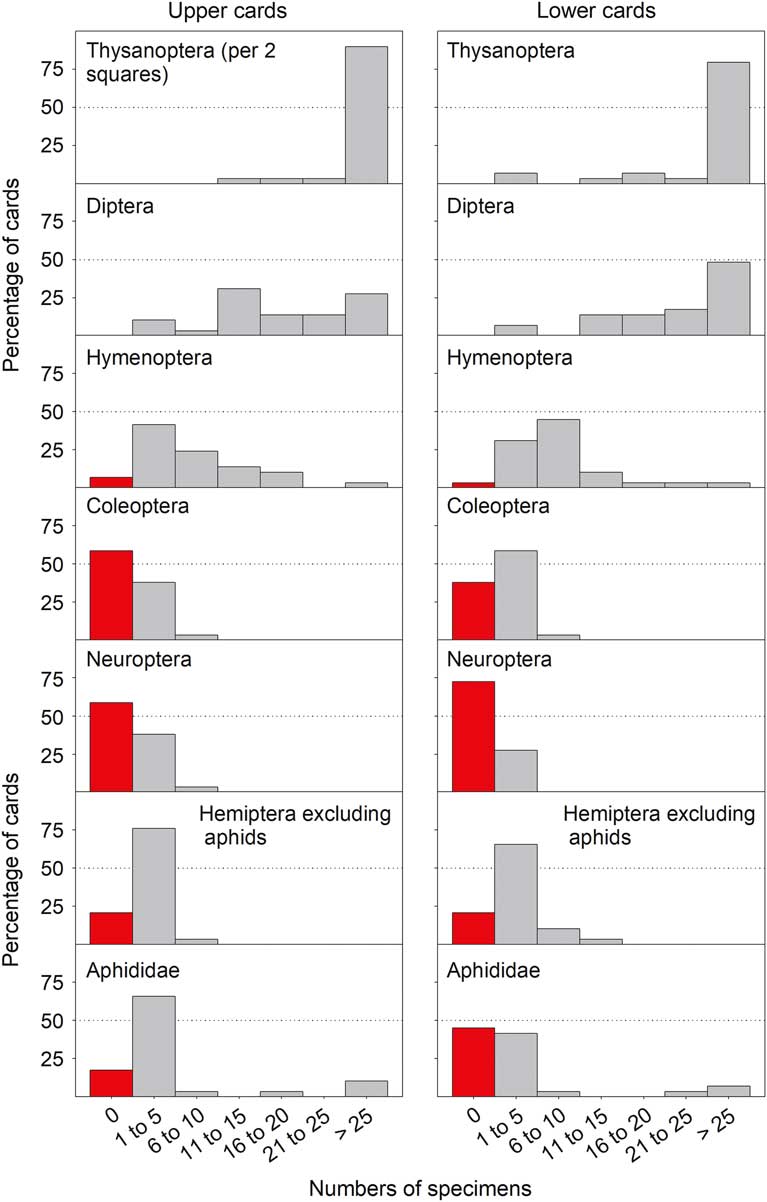
As with the prototype trap, sticky cards captured large numbers of Diptera and Thysanoptera (Fig. 8). Aphididae were occasionally abundant on cards, particularly on cards placed above canopy level (“upper” cards). Sticky cards also captured several taxa of nontarget Psylloidea, again representing three families: Aphalaridae (Aphalara); Triozidae (H. chenopodii; Bactericera minuta (Crawford), host Salix Linnaeus (Salicaceae); Bactericera maculipennis (Crawford), host Convolvulus arvensis Linnaeus (Convolvulaceae)); and Psyllidae (C. pyricola; Cacopsylla Ossiannilsson species, host likely Salix). The weed-feeding species B. maculipennis and H. chenopodii are regularly captured on yellow sticky cards in northern potato growing regions of North America (Horton et al. Reference Horton, Miliczky, Lewis, Cooper, Munyaneza and Mustafa2017, Reference Horton, Miliczky, Lewis, Cooper, Waters and Wohleb2018). Heterotrioza chenopodii may be especially abundant on cards, dwarfing even captures of the target pest B. cockerelli (Horton et al. Reference Horton, Miliczky, Lewis, Cooper, Waters and Wohleb2018).
Nontarget taxa accumulating on upper (panels in column at left) and lower sticky cards (panels in column at right). Bars indicate the percentage of traps showing specified numbers of specimens per trap; red bars indicate the percentage of traps in which the nontarget was not collected. Samples limited to June collections; fields pooled. Upper: card is at height of prototype; lower: card is at canopy level. All data based upon examination of six squares (each 2.5 × 2.5 cm) per card with exception of Thysanoptera (two squares per card).

Discussion
The potato industry of the United States of America harvested over 400 000 ha of potatoes in 2015 leading to sales totalling over USD$3.5 billion (National Agricultural Statistics Service 2016). These national returns are driven substantially by the potato industries of Idaho, Washington, and Oregon. Warm spring and summer temperatures, long summer days, and the rich soils of these regions have led to potato yields among the highest in the world, and these three states together account for about 57% of total United States of America potato production (National Agricultural Statistics Service 2016). Impact of the potato industry on the local economies of these regions has been estimated to exceed multiple billions of dollars annually (Beleiciks Reference Beleiciks2005; Galinato and Tozer Reference Galinato and Tozer2016).
Processors and fresh markets demand a harvested tuber free of disease and insect damage, and end users will reject entire lots of tubers if defects exceed acceptable levels. Arrival of zebra chip in the Pacific Northwest caused growers to abandon integrated pest management programmes in favour of calendar-based applications of insecticides targeting B. cockerelli. These applications begin in June as B. cockerelli arrive in fields from noncrop host plants, and may continue almost to harvest even when it is unclear that pressure is high enough to warrant insecticide applications. Bactericera cockerelli is especially difficult to detect early in infestation, which prevents growers from knowing when insecticide applications should begin. The standard tool for detecting the arrival of B. cockerelli is the yellow sticky card. While cards may not be consistently useful in estimating actual densities of B. cockerelli in fields (Prager and Trumble Reference Prager and Trumble2018), they have been found to be effective at detecting arrival of B. cockerelli in fields and in describing seasonal spread among fields (Johnson et al. Reference Johnson, Kawchuk and Meers2017; Wenninger et al. Reference Wenninger, Carroll, Dahan, Karasev, Thornton and Miller2017; Wohleb Reference Wohleb2017). The cards do have shortcomings that complicate their use. Yellow cards are nonspecific and collect large numbers of nontarget insects in addition to the target pest, and these nontarget specimens complicate processing. Sticky cards are collected and replaced at regular intervals, and season-long use of cards over a large geographic region leads to high costs. An inexpensive and easily serviced monitoring tool that detects low densities of B. cockerelli, but that does not accumulate large numbers of nontarget organisms, would be a useful replacement for the yellow sticky card.
While there has been some use of 3D printing technology by entomologists, its use has not been extensive (Domingue et al. Reference Domingue, Pulsifer, Lakhtakia, Berkebile, Steiner and Lelito2015; Will and Steplowski Reference Will and Steplowski2016). The technology has been used to design and produce components for Malaise traps (Will and Steplowski Reference Will and Steplowski2016), and for constructing decoy mimics of a beetle (Coleoptera) that were then used to attract conspecific beetles (Domingue et al. Reference Domingue, Pulsifer, Lakhtakia, Berkebile, Steiner and Lelito2015). The capability to custom-design traps by exploiting behavioural traits of insects suggests that the technology deserves more use in entomological studies than is currently apparent. A prototype trap designed for D. citri is shown here to capture B. cockerelli under field conditions. The trap was designed to take advantage of known psylloid behaviours, including attraction to yellow and movement towards light (Krysan and Horton Reference Krysan and Horton1991). It was designed to allow easy service in the field, having collection vials that readily detach from the trap body for replacement with a new vial and fresh preservative. Entry holes were constructed to allow psylloid access to the trap interior while slowing accumulation of larger-bodied arthropods. The cost for us to produce the prototype trap falls between USD$7.00 and USD$12.00 per trap (excluding labour), depending on source and cost of filament used in printing the trap. Because traps do not require frequent replacement with new traps, unlike what is needed for yellow sticky cards, season-long monitoring of psylloids over multiple fields leads to substantially lower up-front purchase costs for prototype traps than sticky cards.
We believe that this prototype trap is a promising step towards developing an improved tool with which to monitor B. cockerelli. Bactericera cockerelli were captured by the prototype trap during the critical monitoring interval in early June when the pest first shows in potato fields, indicating that the trap could be of use in providing growers the warning needed to initiate insecticide applications. The field trials did show that capture rates by the prototype trap were generally lower than numbers accumulating on sticky cards, and in some seasonal intervals (mid- to late-season intervals) the numbers were noticeably lower than collected on cards. However, we believe that modifications can easily be made to traps that will improve psylloid capture rates. The easiest modification would be a change in preservative from 75% ethanol to a more effective preservative. Vial contents later in summer often had a noticeable odour of decay, and we suspect that these odours affected psylloid willingness to enter trap interiors. Trials in Florida with the prototype trap incorporate propylene glycol and table salt as the preservative rather than ethanol, and this preservative seems to be better at preventing decay. A second modification would be changes to the trap exterior to prevent water from overhead irrigation accumulating in vials. Vials in which decay was evident often also showed noticeable accumulation of water from overheard irrigation, and the water almost certainly led to dilution of the preservative. Eliminating this dilution effect would likely help reduce decay.
One important benefit of the prototype trap not provided by sticky cards is that specimens are captured into preservative and are therefore available for molecular work. Research is showing that B. cockerelli captured by sticky cards may deteriorate enough that it reduces our ability to detect (with polymerase chain reaction) the zebra chip pathogen even when the pathogen is present in specimens. Psylloid specimens carrying the zebra chip pathogen yield more pathogen DNA and are more likely to produce the pathogen signal if they have been captured into preservative than if captured on sticky cards (Katie Wentz, Heritage University, Toppenish, Washington, United States of America, personal communication). Monitoring programmes for D. citri often pair the prototype trap with sticky cards. The sticky cards provide information about D. citri presence, while specimens collected into preservative by the prototype trap are then available to be examined molecularly for the presence of the citrus greening bacterium. Several types of molecular data are of interest in our field studies with B. cockerelli, including genetic haplotype of specimens (Swisher et al. Reference Swisher, Munyaneza and Crosslin2012), presence or absence of the zebra chip pathogen, and dietary history of specimens. The latter information is obtained by sequencing and identifying plant DNA in field-captured B. cockerelli (Cooper et al. Reference Cooper, Horton, Unruh and Garczynski2016), with the information then used to identify noncrop sources of B. cockerelli arriving in potato fields. These molecular data are difficult to obtain from specimens collected on sticky cards due to drying and deterioration of specimens.
The prototype trap accumulated large numbers of nontarget arthropods in some samples. Nontarget captures were dominated by Diptera and Thysanoptera, although even larger-bodied insects such as Neuroptera were collected. Use of a more effective preservative might be an easy fix to reduce captures of Diptera that are attracted to decaying specimens. Another fix would be a change in size of entry holes. A primary benefit of this technology is that traps could easily be redesigned to have smaller holes than currently in place, reducing accumulation of the larger nontarget specimens. The capture of nonpsylloid arthropods by the prototype trap may be desirable for research objectives other than those explored here. For example, winged aphids were regularly found in collection vials. Aphids included several pest species, including an important pest of potatoes (Myzus persicae (Sulzer)). While we did not compare the numbers or types of aphids captured by the prototype trap to what was captured on sticky cards, our results indicate that the prototype trap will indeed collect aphids and may therefore be useful in aphid integrated pest management programmes. The prototype trap also collected nontarget psylloid species and might therefore be useful for monitoring psylloid species in crops other than potato. Finally, the flexibility of this technology allows trap designs to easily be changed for targeting larger arthropods such as Neuroptera and other beneficial species. Enlargement of entry holes to allow Neuroptera-sized arthropods could lead to a trap design that would be useful in biological control programmes.
Our efforts to develop a monitoring tool for psylloid pests that could replace the yellow sticky card are continuing. Three-dimensional printing technology has been found to be very useful in providing the flexibility needed to rapidly design, produce, and test modifications. The prototype that was tested here was competitive with the sticky card during the June arrival period. We are continuing to explore modifications in trap design that will lead to improved capture rates of B. cockerelli, including manipulations of trap colour, surface texture, and opacity of the dome-top. Our studies here suggest that use of a more effective preservative and modifications to the trap exterior that would minimise accumulation of overhead irrigation water would likely be helpful in reducing captures of nontarget species. Finally, innovative modifications of current interest that might eventually be used to encourage specimen entry into traps include incorporation of a source of artificial light (e.g., solar-powered light-emitting diode lights) or addition of a chemical attractant to the trap interior.
Acknowledgements
We are grateful to Rodney Cooper and Joe Munyaneza for reviewing an earlier version of this paper. Partial funding support for this work was obtained from an Agricultural Research Service Federal-State Partnership Potato Research Grant (D. Horton, T. Waters, C. Wohleb, S. Halbert), the Washington State Potato Commission, and United States Department of Agriculture, National Institute of Food and Agriculture, Specialty Crop Research Initiative (project 2015-51181-24292). The B. cockerelli monitoring programme in Washington State (C. Wohleb and T. Waters) has received funding support from the Washington State Potato Commission, the United States Department of Agriculture Specialty Crops Research Initiative, and the United States Department of Agriculture Technical Assistance for Specialty Crops programme. The initial work to develop the prototype trap for use in monitoring D. citri was completed with funding support by United States Department of Agriculture, National Institute of Food and Agriculture (2015-70016-22992). We thank the Florida Department of Agriculture and Consumer Services for support of this work.