INTRODUCTION
Wine flavour presents an extremely complex chemical pattern in both qualitative and quantitative terms. Over 1000 volatile compounds have been identified, with a wide concentration range varying between hundreds of mg/l down to μg/l (Etievant Reference Etievant and Maarse1991). Moreover, wine aroma is generated by several classes of compounds, such as hydrocarbons, alcohols, terpene alcohols, esters, aldehydes, ketones, acids, ethers, lactones, sulphur and nitrogen compounds (Etievant Reference Etievant and Maarse1991). Aroma production is influenced by several factors: environment (soil, climate), grape variety, ripeness, fermentation conditions and biological factors (i.e. yeast strain and other components of the oenological microflora), winemaking processes and aging (Rapp Reference Rapp1988). Most of the volatile compounds may play a role in the aromatic profile of each wine type depending on their concentration. In some cases it has been possible to isolate a few key compounds, mostly representing the typical flavour of a wine (Williams et al. Reference Williams, Strauss and Wilson1980; Wilson et al. Reference Wilson, Strauss and Williams1984, Reference Wilson, Strauss and Williams1986), while in the majority of wines several compounds seem to cooperate, with specific ratios between them (Bayonove & Cordonnier Reference Bayonove and Cordonnier1971; Strauss et al. Reference Strauss, Wilson and Williams1988; Guth Reference Guth1997). A better understanding of the key aroma compounds helps to control quality and may have an impact on the viticultural and wine technological processes (Bonino et al. Reference Bonino, Schellino, Rizzi, Aigotti, Delfini and Baiocchi2003).
Because of the complexity of the wine aroma and the great variety of aroma compounds responsible, it is a far from simple task for researchers to quantify the volatiles and measure the wine aroma intensity. The great number of the volatile components and the fact that they have different chemical natures covering a wide range of polarity, solubility, volatility and pH explains the difficulty of this undertaking. An important number of those components in wine can only be found at very low concentrations; therefore, the samples need to be highly concentrated in order to be accurately quantified. Moreover, many of the aromatic components are unstable. They may be easily oxidized in contact with air or degraded by heat or extreme pH, giving rise to the appearance of analytical artefacts.
One of the main problems that researchers face when studying the compounds responsible for wine aroma is the choice of a suitable isolation procedure, obtaining a representative extract similar to that of the wine aroma. Several methods have been developed in an attempt to achieve that goal, each with advantages and disadvantages (Etievant Reference Etievant1996).
Liquid–liquid extraction continues to be the reference technique for the extraction of volatile components from wine. In this method, all volatile compounds (low, medium and high volatility) have a high partition coefficient to the organic phase, although it requires solvent evaporation, which in some cases involves loss or degradation of some of the components and formation of some others that were not in the original wine. The liquid–liquid microextraction method described by Ortega et al. (Reference Ortega, Lopez, Cacho and Ferreira2001) is an improved method to isolate and concentrate the volatiles of the wine, because the amount of solvent required is considerably less. The main advantages of these methods are speed, simplicity, low cost, good reproducibility, suitability for routine analysis and ability to quantify many of the most important wine volatiles (Ortega et al. Reference Ortega, Lopez, Cacho and Ferreira2001).
Static headspace techniques, like solid-phase microextraction, are fast and the sample is hardly manipulated. However, their main disadvantage is their low sensitivity (Vas et al. Reference Vas, Gal, Harangi, Dobo and Vekey1998). Furthermore, they are too complicated and not suitable for semivolatile compounds, i.e. for overall analysis.
Dynamic headspace analysis has been proposed in different forms: by the use of a trap containing an adsorbent, or by the ingenious combination of the purging system and a continuous liquid–liquid extraction with Freon 11 (Rapp & Knipser Reference Rapp and Knipser1980). However, the sensitivity of these techniques is severely restricted by the volatility of the compounds to be analysed, and compounds heavier than β-phenetyl alcohol can hardly be detected (Ferreira et al. Reference Ferreira, Sharman, Cacho and Dennis1996, Reference Ferreira, Lopez, Escudero and Cacho1998; Ortega-Heras et al. Reference Ortega-Heras, Gonzalez-SanJose and Beltran2002).
Distillation has also been proposed (Etievant & Bayonove Reference Etievant and Bayonove1983) but this is a rather complicated design, not suitable for routine analysis.
Supercritical fluid extraction and simultaneous distillation–solvent extraction present several disadvantages, such as complexity, time, possible generation of analytical artefacts and degradation of the aromatic compounds (Ferreira et al. Reference Ferreira, Lopez, Escudero and Cacho1998; Castro et al. Reference Castro, Marin, Moreno and Barroso2002; Bonino et al. Reference Bonino, Schellino, Rizzi, Aigotti, Delfini and Baiocchi2003; Demyttenaere et al. Reference Demyttenaere, Dagher, Sandra, Kallithraka, Verhe and de Kimpe2003).
Solid-phase extraction is an expensive and complex method, requiring a large amount of solvent and showing low repeatability (Lopez et al. Reference Lopez, Anzar, Cacho and Ferreira2002).
Gas chromatography of volatile compounds in wine is a very important and useful tool for wine classification (Ferreira et al. Reference Ferreira, Sharman, Cacho and Dennis1996), for quality control and for understanding wine sensory properties. The complete analysis of wine aroma is, however, extremely complex and expensive.
The main target of the present work was to develop a simple method, with good reproducibility and suitability for routine analysis, able to quantify the major volatile compounds in a single chromatographic run. The targets for analysis were fusel alcohols and their acetates, short-chain fatty acids and their ethyl esters and other miscellaneous compounds important for the aroma. All of them are volatile compounds with remarkable sensory properties (Kotseridis & Baumes Reference Kotseridis and Baumes2000) and are at concentrations high enough to be analysed in a single gas chromatography–flame ionization detection (GC–FID) run. The selected method was based on liquid–liquid microextraction with dichloromethane and the use of an internal standard to correct for matrix effects. The analysis can provide information about viticultural and technological applications. In the present work, this method was used in order to study the influence of prefermentative maceration on the major volatile compounds of a white variety originating from the island of Santorini, Vitus vinifera L. cv. Asyrtiko. This variety is probably the most interesting Greek white variety, well adapted to the special climatic conditions on the volcanic island of Santorini. Skin extraction is normally used by the winemaker to enhance the varietal character of white wines and generally to produce wines with higher aromatic intensity. This procedure provides acceptable, well-balanced, better-rounded wines, with a stronger body in the mouth; however, it occasionally alters the wine typicity (a technical term used to describe the degree to which a wine reflects its varietal origins) and introduces heavy, coarse aromas (Ribereau-Gayon et al. Reference Ribereau-Gayon, Dubourdieu, Doneche and Lonvaud2000). During recent years, many winemakers have experimented with applying this method to winemaking using Asyrtiko in order to produce more intensively aromatic white wines.
MATERIALS AND METHODS
Wine samples
All wine samples were from Santorini and the experiment was performed on two consecutive vintages, 2004 and 2005. Grapes of cv. Asyrtiko were harvested at an industrial ripeness stage (13–15 August), corresponding to wines containing approximately 120 ml/l ethanol for both of the vintages. Three samples from each year were processed (destemmed and crushed) separately to obtain two batches of must, one by direct pressing of the grapes and the other by pressing the product resulting from grapes subjected to skin maceration immediately after crushing at 12°C for 12 h. Potassium metabisulphite was added to the grapes prior to pressing, adjusting the total SO2 at 40 mg/l. All the musts obtained after decanting were inoculated with 0·25 g/l of active dry yeasts of Saccharomyces cerevisiae with the commercial name UVAFERM 228. Fermentations were conducted using 30-litre inox tanks kept at 16–18°C throughout. All macerations and fermentations were performed in triplicate. In this way, three samples of control wines and three of macerated wines of each variety were obtained for both the vintages.
Analysis of ethanol, reducing sugars, absorption at 420 nm, volatile acidity, total acidity, pH and total phenolics (absorbance at 280 nm) were determined using OIV (1990) official methods. Octan-3-ol (1 g/l) in absolute ethanol was used as the internal standard solution and exact masses (1 g/l) of the chemical standard compounds were dissolved in absolute ethanol.
Synthetic wine samples
Standard solutions were diluted with water and alcohol (adjusting final alcohol content to 120 ml/l, v/v) at concentrations typically found in wine. Tartaric acid (5 g/l) was added to all the solutions and the pH was adjusted to 3·2 with 1 M NaOH. The wine extracts were concentrated under a nitrogen stream (N, 5·0 quality, extra high purity).
Gas chromatography
A Hewlett-Packard 5890 Series II gas chromatograph was used. The column (30 m×0·32 mm and 0·25 mm film thickness) was a DB-WAX from J & W Scientific (Folsom, CA, USA). The temperature programme was as follows: 40°C for 5 min, then raised by 3°C/min up to 230°C. The carrier gas was He at 1 ml/min. Injection: 1 μl in split mode. Split flow was 70·6 ml/min. Detection was achieved by FID.
Proposed method
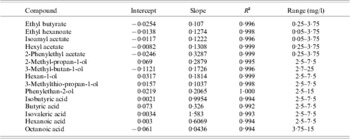
The method used was an application of the method proposed by Ortega et al. (Reference Ortega, Lopez, Cacho and Ferreira2001). In a 10 ml volumetric flask, 3 ml of wine and 10 μl of internal standard solution were added and the volume was made up to 10 ml with water. The contents of the volumetric flask and 1 ml of dichloromethane were added to a 40 ml vial containing 4·5 g of (NH4)2SO4. The vial was stirred using a magnetic stirrer for 5 min at 300 rpm and then 5 min at 150 rpm. After waiting for 5 min, the phases had separated; the dichloromethane phase was recovered and transferred to a 4 ml vial. In the 40 ml vial containing the aqueous phase, 1 ml of dichloromethane was added and the procedure was repeated. In the 4 ml vial, an adequate quantity of Na2SO4 was added to remove any water residues. The dichloromethane phase was transferred to another 4 ml vial and concentrated with nitrogen to 100 μl; thus the volatile compounds were concentrated up to 300 times. The extract was injected into the gas chromatograph under the conditions listed above. The relative response areas for each of individual wine volatile compounds to the internal standard were calculated and interpolated in the corresponding calibration graphs built as described below (Table 1).
Calibration curves and Method Linearity data. For each compound, five augmenting concentrations, situated within the range referred to in the table, were adopted for the creation of the calibration curves and the estimation of the linearity of the method

Calibration graphs
Synthetic wines containing known amounts of the volatile compounds, 120 ml/l (v/v) ethanol, 5 g/l tartaric acid and pH adjusted to 3·2 with 1 M sodium hydroxide, were extracted and analysed following the proposed procedure. The range of concentrations tested was from 0·05 up to 25 mg/l depending on the chemical nature of the analytes (i.e., for the ethylic esters, the range was from 0·05 to 3·75, while it was from 2·5 to 25 mg/l for the higher alcohols). For each compound, five concentrations were plotted against their corresponding relative chromatographic response areas to the internal standard. Each concentration was analysed in triplicate.
Method development and validation
Initial tests to determine the best extraction conditions allowing for a clean phase separation and maximum concentration were carried out. In these experiments, 50 ml of wine was extracted with 5 ml of pentane–diethylether (1:1) and 3 ml of wine was diluted with 7 ml of water and extracted progressively with 1 ml and 1 ml dichloromethane. From these extraction conditions, the second one was chosen as described in the ‘Proposed method’ section.
Relative recovery
Three millilitres of cv. Asyrtiko wine, vintage 2004, was extracted and analysed as indicated in the proposed method. The same wine was spiked with known amounts of wine volatile compounds and with internal standard and then was also analysed. The average increments of relative areas were interpolated in the calibration graphs built with synthetic solutions. Relative recovery for each analyte was estimated as shown in the following equation:

where [SPW] is the concentration of the analyte in the spiked wine, [OW] is the concentration of the analyte in the original wine and [SA] is the concentration of the known amounts of analytes spiked in the original wine.
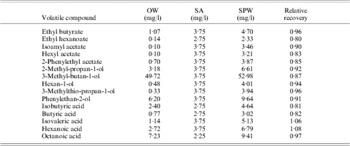
Recoveries were conducted in triplicate. The results are shown in Table 2.
Relative recoveries of volatile compounds from a cv. Asyrtiko wine, vintage 2004. OW is the concentration of the analyte in the original wine and SA is the concentration of the known amounts of analytes spiked in the original wine. SPW is the concentration of the analyte in the spiked wine

Repeatability
One Asyrtiko wine 2004 vintage was spiked with known amounts of wine volatile compounds, with 10 μl of the internal standard solution and extracted as indicated in the proposed method five times during the same day. The relative areas of analytes to the internal standard were calculated. The repeatability was estimated as:

where RSD is the relative standard deviation for each analyte and SD is the standard deviation of the relative areas of the five repeated extractions (relative area1–5).
Sensory analysis tests
To confirm that differences between the control and cryomacerated wines of both vintages were perceptible, difference tests were conducted. Triangle tests (Larmond Reference Larmond1969; Jackson Reference Jackson2002) were used to evaluate differences in aroma between the treated and the untreated wines. For each vintage, the sample produced without cryomaceration was the control sample and it was compared to the sample produced by prefermentative cryomaceration. A trained jury of 12 judges (from the Food Science Department, Agricultural University of Athens) tasted the series of three samples in covered black glasses coded with random three-digit numbers, corresponding to the Association Française de Normalisation (AFNOR) Sensory analysis procedures, containing about 40 ml of liquid. One sample contained the control wine; the other two samples were the cryomacerated wine. In another series of triangular tests, the presentation was reversed. The judges tested the wines in individual testing booths and they were asked to smell the samples and identify the different one.
The following day, the same judges were called to test the same wines and to express an order of preference between them, focusing exclusively on the aroma of the wines. This preference test was performed using a paired comparison test in black glasses coded with random three-digit numbers. The judges compared the control and the corresponding cryomacerated wine of each vintage and they were asked to rate them according to preference. The significance of difference and preference tests was established using the statistical tables of AFNOR.
Statistical methods
Linear regressions were computed (in Microsoft Excel) to create calibration curves in which analyte concentrations were plotted against the relative chromatographic response of the analyte to the internal standard. The standard deviations for estimating the repeatability of the method were also calculated. Analyses of variance were made for comparison of the results and the influence of the production methods on the levels of the analytes.
RESULTS
Method validation
Linearity of the method was determined from the calibration curves created by plotting analyte concentrations against the relative chromatographic response of the analyte to the internal standard. Five concentrations were used for building the calibration graphs for each compound. Linearity is satisfactory in almost all cases (Table 1), with correlation coefficients (r) ranging from 0·992 (butyric acid) to 0·9996 (phenylethan-2-ol). Linearity holds at least for one order of magnitude, and in most cases it holds for at least two, which ensures that the normal concentration range of nearly all the compounds reported in Table 1 is within the linear range of the method. The slope of the straight calibration lines is a measure of method sensitivity and depends on both extraction efficiency and detector response for each compound.
Relative recoveries data (Table 2) are satisfactory for all the volatile compounds, ranging from 0·80 for ethyl hexanoate to 1·08 for hexanoic acid, a finding in agreement with other studies and various methods (Edwards & Beelman Reference Edwards and Beelman1990; Ortega et al. Reference Ortega, Lopez, Cacho and Ferreira2001; Bohlscheid et al. Reference Bohlscheid, Wang, Mattinson and Edwards2006).
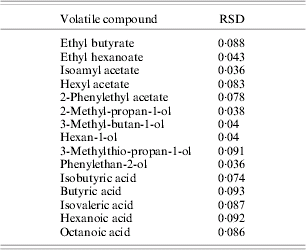
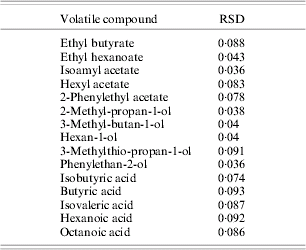
Repeatability is the average standard deviation of a mean obtained from several replicate samples analysed in the same batch. Table 3 shows that RSD ranges from 0·036 (for isoamyl acetate) to 0·093 (for butyric acid), with an average value of below 0·065, which can be considered satisfactory for the purpose of the analysis. Generally, the highest RSD values were found for the acidic compounds; this is normal as these compounds are highly soluble in water and, consequently, are poorly extracted (Ortega et al. Reference Ortega, Lopez, Cacho and Ferreira2001). Also, they have an affinity for the polar column used; thus there are some problems concerning their integration and the calculation of their concentrations.
RSD as found for each analyte after five extractions of the same wine sample. The value of the RSD is an estimation of the repeatability of the method
In conclusion, the proposed method allows for fast and cheap quantitative determination of more than 15 major volatiles in wine. Among these volatiles are some important markers for the microbiological state of wine, for wine sensory characteristics, or for wine origin (both geographic and varietal). The analytical characteristics – linearity, precision and accuracy – of the method are satisfactory. All these characteristics make the method useful for wine quality control and classification and to give information that could be used in the control of winemaking processes.
Standard chemical composition of the wines
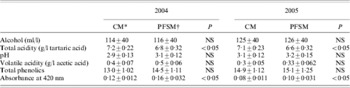
The standard chemical composition of wines from both years, obtained with and without prefermentative skin maceration, is given in Table 4. The wine composition was not significantly affected by the skin maceration, with the exception of total acidity and the absorbance at 420 nm.
General chemical composition of V. vinifera L. cv. Asyrtiko wines (mg/l ±s.e.) subjected to classical white vinification or prefermentative skin maceration

* CM, classical white vinification.
† PFSM, prefermentative skin maceration.
NS, not significant.
Major volatile compounds analysis of the wine samples
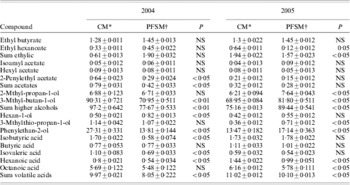
The proposed analytical method was applied to the analysis of Asyrtiko wines produced by different winemaking procedures. A comparison of Asyrtiko wines produced by classical white vinification and by prefermentative cryomaceration (cold extraction) was carried out in order to study the influence of this recent method for the production of these wines. The chemical groups of compounds analysed were those of ethylic esters, acetates, higher alcohols, volatile acids, 3-methylthiopropan-1-ol, hexan-1-ol and phenylethan-2-ol.
In the 2004 vintage, ethylic esters (ethyl butyrate and ethyl hexanoate) were higher in the prefermentative cryomaceration wines, although the differences were not significant, but in the 2005 vintage the levels of ethylic esters were higher for the wines produced by the classical vinification procedure (Table 5). For the acetates, the 2004 vintage gave samples with higher levels for the wines produced by the classical procedure (significant for phenylethyl acetate only), but no statistical difference was observed for the 2005 vintage (Table 5).
Effect of prefermentative cryomaceration (cold extraction) on the concentration (mg/l) of major aroma compounds of V. vinifera L. cv. Asyrtiko wines

* CM, classical white vinification.
† PFSM, prefermentative skin maceration.
NS, not significant at P<0·05.
In 2004, the higher alcohols were higher in the classical vinification sample than in the prefermentative cryomaceration sample, but in 2005 the results were the opposite. 3-Methylthiopropan-1-ol, an odorant giving raw potato hints to the wines, was significantly greater in the prefermentative cryomaceration samples in the 2005 samples, but no significant difference occurred in the 2004 vintage. The same trend was observed by Selli et al. (Reference Selli, Canbas, Cabaroglu, Erten and Gunata2006a) for 3-methylthiopropan-1-ol levels.
Volatile acids, compounds giving fatty, cheesy aromas to the wines, had higher levels in the classical vinification samples for both the vintages when comparing the sum of the volatile acids analysed. Examining the results individually, only hexanoic acid presented levels that were statistically different in both the vintages and higher in the case of the control wines. Isobutyric and isovaleric acids, two compounds giving strong cheesy aromas to the wines (Kotseridis & Baumes Reference Kotseridis and Baumes2000), also presented significantly higher levels in the control wines.
Sensory evaluation of the wine samples
Control and cryomacerated wines of both vintages were evaluated using triangle and preference tests (Larmond Reference Larmond1969; Jackson Reference Jackson2002). For both vintages, the judges found the samples to be different (eight out of 12 correct answers for the 2004 vintage and seven out of 12 correct answers for the 2005 vintage, P<0·05), but in the preference test no significant result was found. In fact, for the pair of wines from 2004, five judges preferred the control sample and seven judges the cryomacerated, while for the pair of 2005 wines the results were six for the control and six for the cryomacerated one.
DISCUSSION
In the present work, a simple analytical method was developed that allows fast and cheap quantitative determination of more than 15 major impact volatile compounds in wine. The analytical characteristics – linearity, precision and accuracy – of the method are satisfactory. All these characteristics make the method useful for wine quality control and for giving information that could be used in the control of winemaking processes.
The comparison of different methods of winemaking, with or without prefermentative cryomaceration, using quantification of these compounds, originating generally from alcoholic fermentation was realized in the present work.
The standard chemical analysis of the wines showed that total acidity values were lower in the case of skin macerated samples for both the vintages and consequently the pH values were higher (although not significantly). These changes could be explained by the liberation of potassium from the skins and thus partial salification of tartaric acid (Ribereau-Gayon et al. Reference Ribereau-Gayon, Dubourdieu, Doneche and Lonvaud2000). Additionally, the wines produced by skin maceration had a significantly greater browning index (absorbance at 420 nm) suggesting solution of phenolic compounds during the maceration, as suggested by Cabaroglu & Canbas (Reference Cabaroglu and Canbas2002) and Selli et al. (Reference Selli, Canbas, Cabaroglu, Erten, Lepoutre and Gunata2006b).
The influence of different methods of winemaking on the major volatile compounds analysed in the present work did not exhibit any important difference, especially when examining two consecutive years. Some of the trends found in the 2004 vintage were not repeated in the samples of the 2005 vintage. In the 2004 vintage, ethylic esters tended to be higher in the case of the prefermentative cryomaceration wines, though not statistically significantly so, but in the 2005 vintage the levels of ethylic esters were higher for the wines produced by the classical vinification procedure. In 2005 wines the difference was not significant for ethyl butyrate, but it was for ethyl hexanoate. The fact that the levels of ethylic esters are higher in the case of the wines produced by the use of prefermentative cryomaceration in one year, while in the other year the classic vinification gave higher amounts, is not surprising because the ethylic esters, as well as the acetates, originate mainly from the fermentation and not from the grape (Nykänen Reference Nykänen1986; Etievant Reference Etievant and Maarse1991) and thus prefermentative maceration should not influence their production. Similar results were reported by Peinado et al. (Reference Peinado, Moreno, Bueno, Moreno and Mauricio2004) and Palomo et al. (Reference Palomo, Perez-Coello, Diaz-Maroto, Gonzalez-Vinas and Cabezudo2006) after examining different varieties and different maceration conditions, respectively. According to Selli et al. (Reference Selli, Canbas, Cabaroglu, Erten and Gunata2006a), who studied the results of the skin contact treatment applying different maceration duration, the level of ethylic esters was significantly higher in the case of the prefermentative cryomaceration. For the acetates, the 2004 vintage control samples presented higher levels (statistically different only in the case of phenylethyl acetate) but for the 2005 vintage no statistical difference was observed. The same trend was observed by Selli et al. (Reference Selli, Canbas, Cabaroglu, Erten, Lepoutre and Gunata2006b). Isoamyl acetate, an important odorant compound giving the aroma of ripe banana to the wines, showed no significantly higher level for the prefermentative cryomaceration samples for both the vintages. Similar results were found by Peinado et al. (Reference Peinado, Moreno, Bueno, Moreno and Mauricio2004). According to Selli et al. (Reference Selli, Canbas, Cabaroglu, Erten and Gunata2006a), the level of isoamyl acetate was noticeably higher in the case of the prefermentative cryomaceration.
All the higher alcohols originate from alcoholic fermentation, except hexan-1-ol, which can also originate from the grapes giving to the wines a vegetal hint (Etievant Reference Etievant and Maarse1991). Selli et al. (Reference Selli, Canbas, Cabaroglu, Erten and Gunata2006a), Palomo et al. (Reference Palomo, Perez-Coello, Diaz-Maroto, Gonzalez-Vinas and Cabezudo2006) and Alvarez et al. (Reference Alvarez, Aleixandre, Garcia and Lizama2006), who studied different maceration conditions, conclude that every higher alcohol, except hexan-1-ol, may be found at either higher or lower concentrations in the prefermentative cryomaceration samples in comparison with the classical vinification samples. Higher alcohols positively affect the wine aroma in quantities less than 400 mg/l (Rapp & Mandery Reference Rapp and Mandery1986). In all the wines analysed during the present study, the levels were lower than 400 mg/l. However, it is noteworthy that hexan-1-ol levels were higher for the prefermentative cryomaceration samples in both the vintages (the results are statistically different for the 2004 vintage, but not for the 2005 vintage) and this seems logical, as this compound could be considered as varietal originating from the wax cuticle of the skins (Etievant Reference Etievant and Maarse1991). Prefermentative cryomaceration processing facilitates the extraction of these compounds as the grape juice is in contact with the skins for 12 h. Similar findings have been reported by Peinado et al. (Reference Peinado, Moreno, Bueno, Moreno and Mauricio2004), Palomo et al. (Reference Palomo, Perez-Coello, Diaz-Maroto, Gonzalez-Vinas and Cabezudo2006) and Selli et al. (Reference Selli, Canbas, Cabaroglu, Erten and Gunata2006a), who have studied the effect of the prefermentative cryomaceration to wine aroma. In fact, according to the results of Palomo et al. (Reference Palomo, Perez-Coello, Diaz-Maroto, Gonzalez-Vinas and Cabezudo2006), the concentration of hexan-1-ol was three times higher in the case of wines that were produced from skin-contact vinification in comparison to classical vinification. Phenylethan-2-ol levels, an aromatic compound participating in the aroma of wines giving rose hints and originating from fermentation and from glycosidical precursors, was higher in the classical vinification samples for 2004 (P⩽0·05), but higher in the prefermentative cryomaceration samples for 2005 (P⩽0·05). According to previous studies (Peinado et al. Reference Peinado, Moreno, Bueno, Moreno and Mauricio2004; Palomo et al. Reference Palomo, Perez-Coello, Diaz-Maroto, Gonzalez-Vinas and Cabezudo2006; Selli et al. Reference Selli, Canbas, Cabaroglu, Erten and Gunata2006a), phenylethan-2-ol levels are higher in the wines produced by prefermentative cryomaceration.
Selli et al. (Reference Selli, Canbas, Cabaroglu, Erten and Gunata2006a) found similar results to the present study for 3-methylthiopropan-1-ol levels.
Volatile acids, compounds giving fatty, cheesy aromas to the wines, presented higher levels in the classical vinification samples for both the vintages when comparing the sum of the volatile acids analysed. Examining the results individually, only the level of hexanoic acid was statistically different in both the vintages and higher in the case of the control wines, as also observed by Selli et al. (Reference Selli, Canbas, Cabaroglu, Erten and Gunata2006a) between the control and 6 h maceration sample. Additionally, isobutyric and isovaleric acids, two compounds giving strong cheesy aromas to the wines (Kotseridis & Baumes Reference Kotseridis and Baumes2000), presented significantly higher levels in the control wines of 2004 vintage. According to previous studies (Peinado et al. Reference Peinado, Moreno, Bueno, Moreno and Mauricio2004; Palomo et al. Reference Palomo, Perez-Coello, Diaz-Maroto, Gonzalez-Vinas and Cabezudo2006; Selli et al. Reference Selli, Canbas, Cabaroglu, Erten and Gunata2006a, Reference Selli, Canbas, Cabaroglu, Erten, Lepoutre and Gunatab), macerated wines generally presented higher levels of volatile acids; however, the differences were not always significant. These different findings should be attributed to the different technologies adopted, differences in the temperatures used and time of maceration and to the different varieties.
The analytical findings were also in accordance with the sensory evaluation results where the judges found differences between the samples but there was no clearly preferred sample. These results show that the performance of a procedure should be examined and evaluated for many years before reaching a conclusion because the vintage effect seemed to play an important role. The present results suggest that prefermentative cryomaceration may not be suitable for cv. Asyrtiko grapes from Santorini, as this method lowered the overall wine quality by a potent rise of the total phenolic compounds and the browning index by the increase of hexan-1-ol (grassy, vegetal odours) levels. Asyrtiko generally presents high levels of phenolics, confirmed by the high phenolic indexes found in the wines of the present work.