


Introduction
Snow plays an important role in the climatic system due to its high surface albedo and heat-insulation effect which influences energy exchange between land surface and atmosphere. It also influences hydrological processes through snow water storage and release. In the past three decades, passive microwave remote-sensing data (e.g. scanning multichannel microwave radiometer (SMMR) and Special Sensor Microwave/Imager (SSM/I)) have shown the capability to obtain large-scale and long-term snow-depth datasets (Reference Armstrong and BrodzikArmstrong and Brodzik, 2002). The deeper the snowpacks, the more snow crystals are available to scatter microwave energy away from the sensor. Hence, microwave brightness temperatures are generally lower for deep snowpacks and higher for shallow snowpacks (Reference Chang, Foster and HallChang and others, 1987). Based on this fact, both snow-depth and snow water equivalent retrieval algorithms were developed using a brightness-temperature difference of 18–37GHz (spectral gradient; e.g. Reference Chang, Foster and HallChang and others, 1987). Using the Chang algorithm in the global scale, it was shown that a single algorithm cannot describe all the different kinds of snow conditions (Reference FosterFoster and others, 1997). Regional algorithms to retrieve snow depth have been developed in the past decade for North American and Eurasian snowpacks (Reference FosterFoster and others, 1997; Reference Ulaby, Moore and FungTait, 1998; Reference Li and MiKelly and others, 2003).
The global snow-depth retrieval algorithms overestimate snow depth in China according to the records of meteorological station observations (Reference Chang, Foster, Hall, Robinson, Li and CaoChang and others, 1992). Snow depth retrieved from passive microwave remote-sensing data can be influenced by the condition of snowpacks, such as snow crystal (Reference Foster, Chang and HallEngland, 1975; Reference Chang, Gloersen, Schmugge, Wilheit and ZwallyChang and others, 1976; Reference FosterFoster and others, 1997), snow density (Reference Wiesmann and MätzlerWiesmann and Mätzler, 1999; Reference GrodyFoster and others, 2005) and vegetation (Reference FosterFoster and others, 1997); Reference Ulaby, Moore and FungTait (1998) reported the different algorithms for different snow features. It is therefore necessary to develop an algorithm favorable to snow-depth study in China.
It is reported that snow grain size and density determine the coefficient of spectral gradient for snow-depth retrieval. For example, using the Chang algorithm with a grain size of 0.3 mm, the coefficient is 1.59, and with a grain size of 0.40 mm, the coefficient is 0.78 (Reference FosterFoster and others, 1997). Reference Kelly, A.T., L. and FosterJosberger and Mognard (2002) reported that while the snowpack was constant, the spectral gradient continued to increase with time due to snow metamorphism. Larger snow grains cause increased microwave scattering, with the result that an algorithm based on a fixed value for grain size will tend to overestimate snow depth (Reference Armstrong, Chang, Rango and JosbergerArmstrong and others, 1993). Thus, the spectral gradient will increase with the time lapses due to the grouping snow grain size and snow density.
Liquid-water content in the snow layer (Reference Wiesmann and MätzlerUlaby and others, 1986; Reference Neale, McFarland and ChangMätzler, 1994) and large water bodies (Reference EnglandDong and others, 2005) can also cause large errors in retrieving snow water equivalent. These two factors should be considered before the linear regression for the coefficient modification as in the Chang algorithm. Microwave radiation will not determine snow depth accurately when snow is wet (Reference Neale, McFarland and ChangMätzler, 1994). The dry-snow and wet-snow criteria were used to discriminate the wet-snow brightness-temperature data, while lake and land–sea boundaries were collected in order to remove meteorological stations near large water bodies. Since the work of Reference Qin, Liu and LiNeale and others (1990), the US National Oceanic and Atmospheric Administration (NOAA)-NASA SSM/I Pathfinder (NNSP) program has also used SSM/I data to derive land surface classifications and to establish dry-snow and wet-snow criteria (Reference TaitSingh and Gan, 2000).
Reference Grody and BasistGrody (1991) reported that it was necessary to remove the rain signal to identify snow cover. When it is raining, snow parameters may not be retrieved. To obtain the long-time-series dataset of snow depth, Grody’s decision-tree method based on the passive microwave remote-sensing data can be adopted so that the snow-depth retrieval algorithm is focused on the snow pixels.
In this study, we modify the Chang snow algorithm to make it suitable for snow-depth retrieval in China using SMMR and SSM/I remote-sensing data and snow-depth data recorded at the China national meteorological stations. We further analyze the accuracy and uncertainty of the new snow product produced from the modified Chang algorithm. The daily snow-depth datasets in China from 1978/79 to 2005/06 are produced, and their spatial and temporal characteristics are analyzed.
Data
Passive microwave remote-sensing data
The SMMR is an imaging five-frequency radiometer (6, 10, 18, 21 and 37 GHz) flown on the Nimbus-7 Earth satellites launched in 1978. The SSM/I sensors on the US Defense Meteorological Satellite Program (DMSP) satellite collect data for four frequencies: 19, 22, 37 and 85 GHz. Both vertical and horizontal polarizations are measured for all except 22 GHz, for which only the vertical polarization is measured. At the US National Snow and Ice Data Center (NSIDC), the SMMR and SSM/I brightness temperatures are gridded to the NSIDC Equal-Area Scalable Earth Grids (EASE-Grids). Because China is located in a mid-latitude region, we used the brightness-temperature data with the global cylindrical equal-area projection (Armstrong and others, http://nsidc.org/data/nsidc-0032.html; K. Knowles and others, http://nsidc.org/data/nsidc-0071.html).
Meteorological station snow-depth observations
Snow-depth observations at national meteorological stations of the China Meteorological Administration were used to modify and validate the coefficient of the Chang algorithm. We used 178 stations within the main snow-cover regions in China, covering northeastern China, northwestern China and the Qinghai–Tibetan Plateau (QTP) (Fig. 1). To modify the Chang algorithm, we collected snow-depth data from the daily observations in 1980 and 1981 for SMMR, and in 2003 for SSM/I. Snow-depth data in 1983 and 1984 (for SMMR) and 1993 (for SSM/I) were then used to validate the modified algorithm.
Position of meteorological stations within main snow-cover regions in China (NWC: northwestern China; QTP: Qinghai– Tibetan Plateau; NEC: northeastern China; and other region).

MODIS snow-cover area products
Reference HouHall and others (2002) described the Moderate Resolution Imaging Spectroradiometer (MODIS) snow-cover area algorithm for the Earth Observing System (EOS) Terra satellite. At present, MODIS snow products are created as a sequence of products beginning with a swath (scene) and progressing, through spatial and temporal transformations, to an 8 day global gridded product. In the NASA Goddard Space Flight Center, the daily Climate Modeling Grid (CMG) snow product gives a global view of snow cover at 0.05˚ resolution. Snow-cover extent is expressed as a percentage of snow observed in the raw MODIS cells at 500m when mapped into a gridcell of the CMG at 0.05˚ resolution. These MODIS snow-cover products can be downloaded from the NASA EOS Data Gateway. In this study, we projected the 0.05˚ daily CMG product to register with the EASE-Grids projection for the accuracy assessment of snow area extent derived from passive microwave satellite data.
Vegetation distribution map in China
Snow-depth retrieval from passive microwave remote-sensing data will be influenced by vegetation, in particular the dense forest. Reference Josberger and MognardHou (2001) published the vegetation atlas of China (1 : 1 000 000), which is the most detailed and accurate vegetation map of the whole country up to now. It was based on the result of nationwide vegetation surveys and their associated researches in 50 years since 1949 and the relevant data from the aerial remote-sensing and satellite images, as well as geology, pedology and climatology. In this study, we digitized and vectorized the vegetation atlas of China, and projected it into cylindrical equal-area projection to register the EASE-Grid data. The forest area fraction will be used to reduce the forest influence for snow-depth retrieval from passive microwave brightness-temperature data.
Lake distribution map/land–sea boundary
Based on the results of Reference EnglandDong and others (2005), large water bodies will seriously influence the brightness temperature. Before modification of the snow-depth retrieval algorithm, those brightness-temperature data and meteorological station data near the lakes or ocean were removed to eliminate the mixed pixel effect. We used the 1 : 1 000 000 lake distribution maps from the Lake Database in China, which was produced by the Nanjing Institute of Geography and Limnology, Chinese Academy of Sciences (CAS), and was shared with the scientific and educational group at the Data-Sharing Network of Earth System Science, CAS (http:// www.geodata.cn). The Data-Sharing Network also archived the 1 : 4 000 000 coastline maps. These spatial data were also projected to register the EASE-Grid data.
Snow-Depth Retrieval Methods
The coefficient of spectral gradient algorithm
Based on theoretical calculations and empirical studies, Reference Chang, Foster and HallChang and others (1987) developed an algorithm for passive remote sensing of snow depth over relatively uniform snowfields utilizing the difference between the passive microwave brightness temperature of 18 and 37GHz in horizontal polarization:

SD is snow depth in cm, and T B(18H) and T B(37H) are brightness temperature at 18 and 37 GHz in horizontal polarization, respectively. Here, brightness temperature at 37 GHz is sensitive to snow volume scattering, while that at 18GHz includes the information from the ground under the snow. Therefore, the basic theory of the spectral gradient algorithm is the snow volume scattering, which can be used to estimate the snow depth after the coefficient (slope) was modified by the snow-depth observations in the field.
Based on Reference FosterFoster and others’ (1997) results of forest influence, the forest area fraction was considered here:

where a is the coefficient, while f is the forest area fraction.
In this study, snow-depth observations at the meteorological stations in 1980 and 1981 were regressed with the spectral gradient of SMMR at 18 and 37GHz in horizontal polarization. Before regression, the adverse factors, such as liquid-water content within the snowpack, should be taken into account. These lead to a large uncertainty due to the big difference between dry-snow and water dielectric characteristics. The brightness-temperature data influenced by liquid-water content were eliminated based on the
following dry-snow criteria:

and

(Reference Qin, Liu and LiNeale and others 1990). Mixed pixels with large water bodies were removed according to the Chinese lake distribution map and the Chinese coastline maps.
According to the regression between the spectral gradient of T B(18H) and T B(37H) and the snow depth measured at the meteorological stations, the coefficient (slope) is 0.78 and the standard deviation from the regression line is 6.22 cm for SMMR data. For the SSM/I brightness-temperature data, the 19GHz channel replaced the SMMR 18GHz channel. Results show that the coefficient is 0.66 and the standard deviation from the regression line is 5.99 cm. Thus, the modified algorithm is:
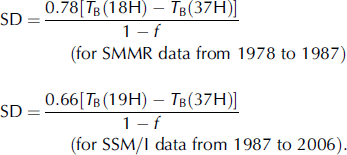
There are 2217 snow-depth observations available in 1980 and 1981, compared to 6799 observations in 2003 because the SSM/I has a greater swath width and longer acquisition period than the SMMR (see Reference Armstrong, Chang, Rango and JosbergerFigs 2 and Reference Chang, Gloersen, Schmugge, Wilheit and Zwally3).
Snow depth estimated from passive microwave brightness-temperature data and observed in meteorological stations: (a) SMMR in 1980 and 1981; and (b) SSM/I in 2003.
Percentage of error frequency distribution of snow depth estimated from passive microwave brightness-temperature data and observed in meteorological stations. (a) SMMR in 1980 and 1981; and (b) SSM/I in 2003.
A simple dynamically adjusted algorithm
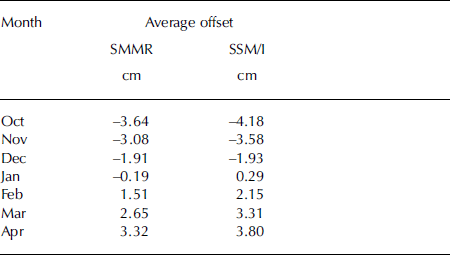
Snow density and grain size are two sensitive factors affecting microwave emission from snowpacks (Reference FosterFoster and others, 1997, Reference Grody2005), because they can partly affect the volume-scattering coefficient of snow. Although Reference Kelly, A.T., L. and FosterJosberger and Mognard (2002) developed a dynamic snow-depth algorithm, it is difficult to use it to map snow-depth estimation in China because of the lack of reliable ground- and air-temperature data for each passive microwave remote-sensing pixel. In this study, we adopt a statistical regression method to adjust the coefficient dynamically based on the error-increasing ratio within the snow season October–April. The original Chang algorithm underestimated the snow depth at the beginning of the snow season and overestimated it at the end (Fig. 4). As statistical results, the average offsets can be obtained in every month for SMMR and SSM/I, respectively (Table 1).
Error increases from snow-density and grain-size variations within the snow season from October to April based on the estimations of SMMR (a) and SSM/I (b) data and observations in meteorological stations.
Average offsets to remove the influence of snow-density and grain-size variations for each month within the snow season based on the linear regression method
Snow-depth retrieval
The spectral gradient algorithm for snow-depth retrieval is based on the volume scattering of snowpacks, which means other scattering surfaces can also influence the results. However, it will overestimate the snow-cover area if the spectral gradient algorithm is directly used to retrieve snow depth (Reference Hall, Riggs, Salomonson, DiGirolamo and BayrGrody and Basist, 1996). This is because the snow cover produces a positive difference between low- and high-frequency channels, but the precipitation, cold desert and frozen ground show a similar scattering signature. Reference Hall, Riggs, Salomonson, DiGirolamo and BayrGrody and Basist (1996) developed a decision-tree method for identifying snow. The classification method can distinguish snow from other scattering signatures (precipitation, cold desert, frozen ground).
Within the decision-tree flow chart, there are four criteria related to the 85 GHz channel. To be able to use SMMR brightness-temperature data which do not have the 85 GHz channel, we adopted other relationships, such as T B(19V) – T B(37V) as the scattering signature, instead of T B(22V) – T B(85V). For the SMMR measures, the simplified decision tree can be described by the following relationships:
-
1. T B(19V) – T B(37V) > 0, for scattering signature;
-
2. T B(22V) > 258 or 258 ≤ T B(22V) ≥ 254 and T B(19V) – T B(37V) ≤ 2, for precipitation;
-
3. T B(19V) – T B(19H) ≥ 18 and T B(19V) – T B(37V) ≤ 10, for cold desert;
-
4. T B(19V) – T B(19H) ≥ 8K and T B(19V) – T B(37V) ≤ 2K and T B(37V) – T B(85V) ≤ 6 K, for frozen ground.
For a more detailed description of the decision-tree method, see Reference Hall, Riggs, Salomonson, DiGirolamo and BayrGrody and Basist (1996).
In this study, we adopt Grody’s decision-tree method to obtain snow cover from SMMR (1978–87) and SSM/I (1987– 2004). The snow-depth data were calculated only on those pixels by the snow-depth retrieval algorithm. The return periods of SMMR and SSM/I measurements are about every 3–5 days depending on latitude. To obtain the daily snow-depth dataset, the intervals between swaths were filled up by the most recent data available. The flow chart to obtain the snow-depth data in China is described by Figure 5.
Flow chart of snow-depth data in China derived from passive microwave brightness-temperature data.
Accuracy and Uncertainty
Accuracy assessment (snow depth)
To assess the accuracy of snow depth retrieved from the modified algorithm, we used measured snow-depth data at the meteorological stations in 1983 and 1984 to compare with the SMMR results, and those in 1993 for the SSM/I results. The two absolute errors less than 5 cm hold about 65% of all the data (Fig. 6). The standard deviations are 6.03 cm and 5.61 cm for SMMR and SSM/I, respectively.
Percentage error-frequency distribution of validation by the snow-depth observations in meteorological stations and the spectral gradient of SMMR in 1983 and 1984 (number of data = 2070) (a) and SSM/I in 1993 (number of data = 6862) (b).
Accuracy assessment (snow cover)
We collected MODIS snow-cover products from 3 December 2000 to 28 February 2001 to compare with the results of this study. Though MODIS snow-cover products cannot provide snow-depth information, we can compare the agreement or disagreement of MODIS and SSM/I snow extent in each of the SSM/I pixels by resampling the MODIS snow-cover products into the EASE-Grid projection. For a SSM/I pixel, when the snow depth is larger than 2 cm, we consider the pixel to be snow-covered. For the resampled MODIS pixel, the snow-cover area is a fraction of snow-covered, and when the snow-cover area is larger than 50% we consider it as a snow-cover pixel. Reference Dong, Walker and HouserCongalton (1991) described several methods for assessing the accuracy of remotely sensed data. First of all, we considered MODIS snow-cover products as the truth because optical remote sensing has higher spatial resolution and a better comprehensive algorithm than passive microwave remote sensing. We then established the error matrices of the SSM/I results for each day according to MODIS snow-cover products. Finally, two methods (overall accuracy and kappa analysis) were used to assess the accuracy.
The two datasets show good agreement in the overall accuracy analysis. The overall accuracy is about 0.8–0.9 with Grody’s decision-tree method (Reference Hall, Riggs, Salomonson, DiGirolamo and BayrGrody and Basist, 1996), and 0.7–0.8 otherwise (Fig. 7a). The results show that Grody’s decision-tree method can improve the overall accuracy by 10%.
Accuracy assessment of overall accuracy (a) and kappa analysis (b) methods based on the MODIS daily snow-cover area products from 1 December 2000 to 28 February 2001. Solid line shows the results using Grody’s decision-tree method to identify the snow cover, and dashed line shows the results without the decision-tree method.
The kappa analysis is a stricter method to assess the coincidence in two datasets. The K hat statistic was defined as (Reference Dong, Walker and HouserCongalton, 1991):

where r is the number of rows in the error matrix, xii is the number of MODIS observations in row i and column i, xi + and x +i are the marginal totals of row i and column i, respectively, and N is the total number of data. The results of K hat statistics show that Grody’s decision-tree method can improve the accuracy by 20% (Fig. 7b).
Uncertainty
Effect of vegetation
Vegetation cover has a significant influence on snow-depth estimation from remote-sensing data (Reference FosterFoster and others, 1997, Reference Grody2005). In this study, we used the forest-cover parameter to try to remove this influence (Reference FosterFoster and others, 1997). In fact, this method cannot completely remove the influence in dense forest regions. We overlap the stable snow-cover map with the Chinese vegetation map and find dense forests with a large forest-cover fraction (>0.5) mainly distributed in the Xing’aling regions (Heilongjiang Province and eastern Inner Mongolia) with about 160 EASE-Grid pixels (100 000 km2). Although snow depth derived from the modified algorithm may be questionable, the total area of the dense forest regions is very limited.
Effect of snow crystal
The snow grain size can influence the algorithm coefficient of snow-depth retrieval (e.g. Equations (1) and (2)). With a snow grain size of 0.3 mm the coefficient is 1.59, but with a snow grain size of 0.4 mm it is 0.78 (Reference FosterFoster and others, 1997). Snow crystal size can depend on the snowfall condition, such as the wind and temperature. It also varies with snow metamorphism once the snow is on the ground. In this study, we characterize this influence using a statistical regression method and adjust the seasonal offsets. These offsets cannot interpret the regional differences of snow conditions.
Effect of liquid-water content
The snow depth cannot be retrieved when snow is wet because the liquid water within the snow layer will remove the volume scatter of microwave signals. Therefore, only morning brightness-temperature data were used to minimize the errors associated with melting snow in the afternoon.
Analysis of Spatial and Temporal Variations of Snow Depth in China
Spatial and temporal characters of snow depth
Based on the daily snow-depth data from 1978 to 2006, snow cover in China is mainly located in three regions, the QTP, northwestern China and northeastern China, while other regions only hold a small amount of snow mass (Fig. 8). The annual average snow depth from 1978 to 2006 is less than 12 cm, while the average snow depth in winter (December– February) is about twice its annual average value (Figs 8 and 9).
Annual average snow-depth distributions in China from 1978 to 2006 based on the SMMR and SSM/I data.
Average snow-depth distributions in China from 1978 to 2006 during winter (December–February) based on the SMMR and SSM/I data.
Figure 10 demonstrates monthly maximum snow depth from 1978 through 2006 over China. Snow-cover duration is longest on the QTP because of its high elevation. Snow mass on the QTP reaches a maximum in December–February. Snow mass in northwest China reaches a maximum in February and March. Some permanent snow cover can be found in the Tien Shan and western Kunlun mountains as shown in July and August (Fig. 10). In northeast China, seasonal snow cover reaches a maximum in January–March. In the rest of China, the main snow type is temporary snow cover which only survives for a matter of days and only occurs in winter.
Monthly maximum snow-depth distributions from 1978 to 2006 in China based on the SMMR and SSM/I data.
Using the snow-depth time-series data, we analyzed the annual average duration of snow cover, which can be used to identify the stable snow-cover regions (Fig. 11). Generally, the steady snow cover is defined as snow cover that continuously survives more than 60 days (Reference MätzlerLi and Mi, 1983). The average areal extent of steady snow cover from 1978 to 2006 is about 3.0×10⁶ km2 (Fig. 11). Comparison of Figures 8 and 11 shows that stable snow-cover regions agree well with main snow-cover regions.
Annual average distributions of snow-cover period in China from 1978 to 2006 based on the SMMR and SSM/I data.
Though the interannual variation of the areal extent of seasonal snow cover in the Northern Hemisphere has shown a weak decreasing trend (Reference Armstrong and BrodzikArmstrong and Brodzik, 2002), the snow mass in China from 1978 to 2006 does not show a clear trend (Fig. 12). The interannual fluctuations are very visible. According to the snow-mass statistics, the minimum (shallow-snow year) is about 292km3 in 1984, while the maximum (deep-snow year) is about 528km3 in 2000 (Fig. 12). These year-to-year variations may result from both snowfall and snow-season temperature patterns. Reference Rikiishi and NakasatoQin and others (2006) analyzed the western China snow cover with respect to climate factors and found a positive snow-cover trend in western China.
Seasonal and interannual variations of snow mass in China from 1978 to 2006 based on the SMMR and SSM/I data.
Regional characteristics of snow depth
Snow depth of the QTP
The QTP snow cover has the longest duration due to high elevation, although the main snow season is from October to April (Fig. 13). The main snow mass within the southeast regions of the Plateau dominates the total amount of snow mass on the QTP. There exists some permanent snow cover over the Himalaya and the Plateau margin.
Seasonal and interannual variations of snow mass on the QTP from 1978 to 2006 based on the SMMR and SSM/I data.
There were significant interannual variations of snow mass over the Plateau. The largest snow mass reaches 234km3 in deep-snow years, but only about 60km3 in shallow-snow years. The trend of changes in snow mass is not clear. If a simple linear regression model is used, a positive trend can be obtained. However, the significance level is very low because the noise of the interannual fluctuation in changes of snow mass is very large. Qin and others (2006) reported that the long-term variability of the western China snow-cover area extent was characterized by a large interannual variation, with a small increasing trend, according to the observations from SMMR and meteorological stations from 1951 to 1997. Reference Singh and GanRikiishi and Nakasato (2006) reported a reduction in seasonal snow-cover area in this region using data from the Northern Hemisphere EASE-GridWeekly Snow Cover and Sea Ice Extent for the period 1966 to July 2001. The disagreement between these studies may be due to the use of different time periods and different snow parameters (snow mass as discussed in this study and snow-cover extent in other studies).
Snow depth of northwestern China (NWC)
The interannual variation of snow depth in NWC is not as large as over the QTP, and a positive trend is found from 1978 to 2006. The annual maximum varies from 90km3 in 1978 to 148km3 in 2006 (Fig. 14).
Seasonal and interannual variations of snow mass over northwestern China from 1978 to 2006 based on the SMMR and SSM/I data.
Snow depth of northeastern China (NEC)
In NEC, snow depth has a large seasonal and interannual fluctuation, with no clear change trend. The linear trend analysis shows a decrease, but the significance level is very low because of the large interannual fluctuation. The annual maximum varies from 115km3 in 1978 to 236km3 in 2006 (Fig. 15). Figures 10 and 15 both show that snow cover disappears in summer, so that snow in NEC is completely dominated by seasonal snow cover.
Interannual variations of snow mass over northeastern China from 1978 to 2006 based on the SMMR and SSM/I data.
Snow depth of other regions
Snow depth in other regions shows a positive trend, with a large interannual variation from 1978 to 2006 (Fig. 16). This may be the result of climate change in these regions.
Interannual variations of snow mass of the other regions of China from 1978 to 2006 based on the SMMR and SSM/I data.
Conclusion and Prospect
In this paper, we reported a method for retrieving snow depth in China from SMMR (1978–1987) and SSM/I (1987– 2006), and analyzed spatial and temporal variations of snow depth over China. First, we modified and extended the retrieval algorithm of snow depth by Reference Chang, Foster and HallChang and others (1987) using ground-based observations. The snow-depth retrieval flow chart for the modified algorithm presented here considers factors that influence snow-depth retrieval accuracy, such as precipitation, cold deserts, frozen ground, large water bodies (lakes, rivers, and oceans), vegetation and dense forests, liquid-water content of snowpacks, and seasonal variation of snow density and snow grain size. By analyzing accuracy and uncertainty, we provide the error estimation of the snow-depth data.
Analysis of snow-depth characteristics at temporal and spatial scales shows that the main characteristic of snow in China in the past three decades is visible interannual snow-depth variations, with a weak increasing trend. The annual average snow depth from 1978 to 2006 is less than 12 cm, while the average snow depth in winter (December– February) is about twice the annual average value. The average areal extent of steady snow cover is about 3.0× 10⁶ km2. The minimum snow mass (shallow-snow year) is about 292 km3 in 1984, while the maximum (deep-snow year) is about 528 km3 in 2000. The largest values in the main snow regions are 234 km3 in 1998 over the QTP, 148km3 in 2006 in NWC, and 236km3 in 2000 in NEC.
The resolution of passive microwave brightness-temperature data is very low (about 25×25 km), making it easy to obtain large-scale and long-term time-series data. The disadvantage, however, is that the low resolution can make validation difficult because observations at some sites cannot represent the regional information within a single large (625km2) pixel. Therefore, it will be useful to fuse other remote-sensing data with a resolution such as MODIS and active microwave remote-sensing data, in order to study regional-scale characteristics of seasonal snow cover.
Only long-term snow-depth data are analyzed in this study. Further work should be carried out to analyze snow variation at a finer spatio-temporal scale and the relationship between snow depth and climate/hydrological factors. In particular, snow cover in the QTP can significantly influence the thermal interaction in the troposphere due to high elevation. The relationships between snow and other climate factors have been discussed in China (e.g. H.F. Blanford’s hypothesis (Reference Rikiishi and NakasatoQin and others, 2006); snow cover and floods in the Yangtze River; the snow cover and summer monsoon of East Asia). However, these discussions are not common knowledge because snow data are lacking. The results of this work can be used to support these climate analyses.
Acknowledgements
We thank the NSIDC for providing the passive microwave remote-sensing data, and the Chinese Meteorological Administration for providing the snow-depth data of the meteorological stations. The work was funded by the China State Key Basic Research Project (2007CB411506), the Chinese Academy of Sciences Action Plan for West Development Project ‘Watershed Airborne Telemetry Experimental Research (WATER)’ (KZCX2-XB2–09) and the National Natural Science Foundation of China (40601065, 40671040).



