Introduction
Growing demand for energy requires a diversification of primary raw materials as well as a re-evaluation of low grade ores, which may occur in large tonnage deposits. Current primary ores processed in the nuclear industry mostly include uraninite (UO2) and coffinite U(SiO4)1–x⋅(OH)4x. Unconventional target ores include brannerite, a uranium titanate (UTi2O6), due to its high U content of up to 55 wt.% U (Patchett and Nuffield, Reference Patchett and Nuffield1960; Szymanski and Scott, Reference Szymanski and Scott1982). Worldwide, brannerite is reported in a variety of geological environments including sedimentary (e.g. Witwatersrand, South Africa; Smith, Reference Smith, de Vivo, Ippolito, Capaldi and Simpson1984), hydrothermal (e.g. Chateau-Lambert, France; Branche et al., Reference Branche, Chervet and Guillemin1952), magmatic (e.g. Crocker's Well, Australia; Ludwig and Cooper, Reference Ludwig and Cooper1984) and metamorphic (e.g. San Bernardino county, USA; Hewett et al., Reference Hewett, Stone and Levine1957) settings. In some deposits, brannerite is the main U-bearing mineral, such as at Elliot Lake, Canada (Szymanski and Scott, Reference Szymanski and Scott1982), Mount Isa, Australia (Wilde et al., Reference Wilde, Otto, Jory, MacRae, Pownceby, Wilson and Torpy2013) and Olympic Dam, Australia (Macmillan et al., Reference Macmillan, Cook, Ehrig and Pring2017). In the Witwatersrand conglomerate, brannerite accounts for 8 to 19 wt.% of the total uranium mineralisation (Lottering et al., Reference Lottering, Lorenzen, Phala, Smit and Schalkwyk2008). While U can be extracted easily from oxide minerals, brannerite has long been considered as refractory to direct leaching and for this reason it has, to date, not been extensively mined and/or processed (Vance et al., Reference Vance, Watson, Carter, Day, Lumpkin, Hart, Zhang, McGlinn, Stewart and Cassidy2000, and references therein). Recent advances in hydrometallurgy have shown that U can be recovered from brannerite using acid solutions under physical- and chemical-controlled conditions (Charalambous et al., Reference Charalambous, Ram, McMaster, Pownceby, Tardio and Bhargava2014). Uranium recovery from brannerite is not a straightforward process and the efficiency of recovery is strongly influenced by the ore paragenesis (Lottering et al., Reference Lottering, Lorenzen, Phala, Smit and Schalkwyk2008; Sapsford et al., Reference Sapsford, Bowell, Geroni, Penman and Dey2012). Although brannerite is formed in a large variety of geological environments, its crystal chemistry and petrogenesis remains under-investigated.
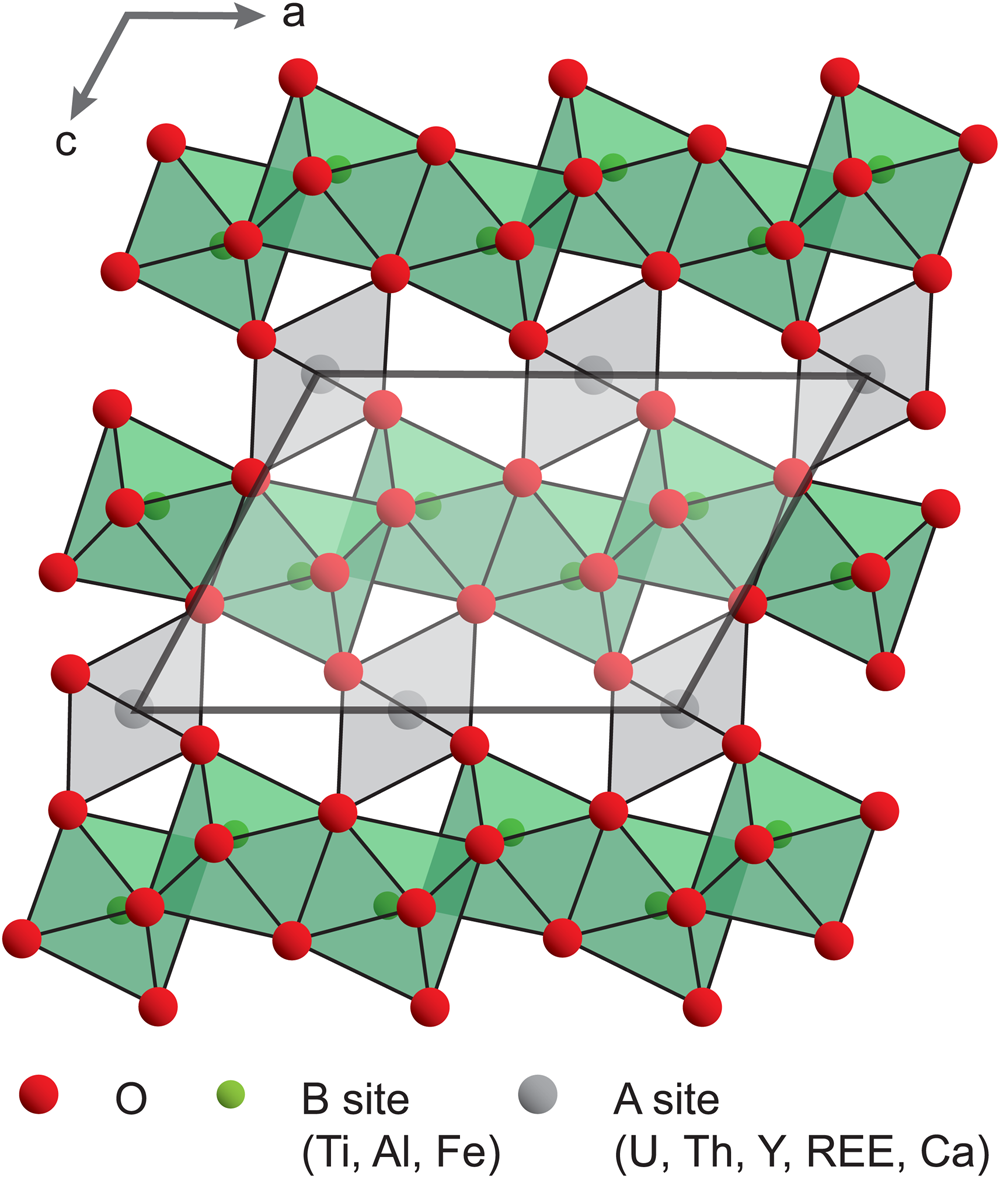
Brannerite crystallises in the monoclinic system, with space group C2/m (Szymanski and Scott, Reference Szymanski and Scott1982). The general formula is best described as AB 2O6, where A is U and B is Ti. Both A and B sites are distorted octahedra (six-coordinated), which share corners and/or edges to form a structural framework (Szymanski and Scott, Reference Szymanski and Scott1982, Fig. 1). Natural brannerite is commonly non-stoichiometric, and exhibits variable compositions related to substitution mechanisms varying in complexity (Ditz et al., Reference Ditz, Sarbas, Schubert and Töpper1990; Lumpkin et al., Reference Lumpkin, Leung and Ferenczy2012; Macmillan et al., Reference Macmillan, Cook, Ehrig and Pring2017). The A site is occupied mainly by U, Ca, Th and rare earth elements (REE), whereas the B site includes Ti, Al and Fe. Due to the high content of radioactive elements (U, locally Th, and their daughter elements), the self-irradiation of natural brannerite causes significant structural damage leading to the amorphisation of the crystal lattice (Smith, Reference Smith, de Vivo, Ippolito, Capaldi and Simpson1984; Lumpkin et al., Reference Lumpkin, Leung and Ferenczy2012). Such processes lead to favourable conditions for fluid circulation that contributes to the inception of alteration (Seydoux-Guillaume et al., Reference Seydoux-Guillaume, Bingen, Paquette and Bosse2015; Duran et al., Reference Duran, Seydoux-Guillaume, Bingen, Gouy, de Parseval, Ingrin and Guillaume2016) and further incorporation of impurities into the brannerite structure. Such variations in composition, together with the complex nature of brannerite ores have major effects on the dissolution rates of brannerite (Goldney et al., Reference Goldney, Canning and Gooden1972; Polito et al., Reference Polito, Kyser and Stanley2009; Charalambous et al., Reference Charalambous, Ram, Pownceby, Tardio and Bhargava2012).
Crystal structure of brannerite, down the b axis (modified after Mesbah et al., Reference Mesbah, Szenknect, Clavier, Lin, Baron, Beaufort, Batonneau, Mercadier, Eglinger, Turuani, Goncalves, Choulet, Chapon, Seydoux-Guillaume, Pagel and Dacheux2019).

The detailed chemical characterisation of minerals, such as columbite–tantalite (Melcher et al., Reference Melcher, Sitnikova, Graupner, Martin, Oberthür, Henjes-Kunst, Gäbler, Gerdes, Brätz, Davis and Dewaele2008) and uraninite (Mercadier et al., Reference Mercadier, Cuney, Lach, Boiron, Bonhoure, Richard, Leisen and Kister2011; Eglinger et al., Reference Eglinger, André-Mayer, Vanderhaeghe, Mercadier, Cuney, Decrée, Feybesse and Milesi2013; Frimmel et al., Reference Frimmel, Schedel and Brätz2014) has led to classifications of minerals based on their geological environment. Such chemical fingerprints also have direct applications to the exploration industry and forensic science. Owing to the large variety of brannerite occurrences and its complex crystal chemistry, a similar chemical characterisation approach is developed in this contribution. On the basis of both optical and electronic microscopy, major- and trace-element analyses of natural brannerite minerals collected from magmatic (pegmatitic) and hydrothermal occurrences, the objective of this study is to identify the chemical substitutions leading to a large variety of compositions. Such characterisation leads to a classification of brannerite based on the genetic type of their occurrence. This has implications for: (1) ore deposit fingerprints; (2) using brannerite as a geochronometer tool; and (3) determination of the key parameters for optimised U recovery during leaching operations.
Material and methods
Brannerite ores
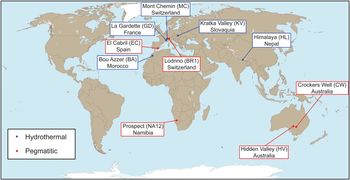
The samples investigated include single crystals and ores collected from hydrothermal and pegmatitic occurrences worldwide (Fig. 2). In this section, only a brief geological overview of the localities is provided; more detailed information on ore deposits or occurrences can be found in the Appendix (Supplementary material see below) and in the referred literature. Five samples from hydrothermal occurrences were studied: La Gardette (GD) from the French Western Alps; Bou Azzer (BA) from the Moroccan Anti Atlas Belt; Chhuling Khola Valley (HL) in the Nepalese Himalaya; Mont Chemin (MC) in the Western Swiss Alps; and Kratka Valley (KV) in the Bohemian Massif. These hydrothermal veins formed after local or regional events, without direct connection to a magmatic event, and they might record a complex evolution of the fluid composition. Within veins, brannerite is associated spatially with gangue minerals within a more-or-less polyphase paragenetic sequence.
Map showing the locations of brannerite samples investigated and their genetic type.

Five samples from magmatic–pegmatitic occurrences were studied: Crocker's Well (CW) in Central Australia; Hidden Valley (HV) in the Finders Ridge, Australia; El Cabril (EC) in the Sierra Albararrana, Andalusia; Lodrino (BR1) in the South-Central Swiss Alps; and Marienfluss Valley (NA12) in Northern Namibia. These occurrences are generally dykes spatially and/or temporally associated with magmatic and metamorphic complexes. The pegmatites, which commonly correspond to the last stage of the magmatic evolution, are composed of K-feldspar, quartz, albite and, among accessory minerals (listed in the Appendix and in the referred literature), brannerite. For simplification, brannerite formed in magmatic–pegmatitic environments will be named ‘pegmatitic brannerite’, while those formed in non-magmatic hydrothermal settings will be named ‘hydrothermal brannerite’.
Analytical methods and data processing
Polished thin-sections and plugs were prepared from rock samples and mineral chips at GeoRessources, Nancy (France). Identification of the paragenesis and textures was carried out using optical microscopy and a FEI Quanta 450 scanning electron microscope (SEM) equipped with an energy-dispersive spectrometer (EDS) and a back-scatter electron (BSE) detector, hosted by the MIMENTO platform (RENATECH Network) at the Femto-ST lab, Besançon (France). Acceleration voltages between 10 and 15 kV were used.
As representatives of pegmatite and hydrothermal settings, respectively, two thin lamellae from Lodrino and Bou Azzer samples were prepared using a FEI Helios 600i FIB/SEM instrument (MANUTECH USD, Saint-Etienne, France). After localisation of the area of interest by BSE imaging, a first 300 nm protective coating of platinum was deposited. A thick amorphous carbon coating was then deposited using a gallium ion beam. The lamellae were firstly pre-thinned at 30 kV, transferred on a Cu semi grid and thinned down to be sufficiently transparent to the electron beam (i.e. <100 nm). They were finally cleaned at low voltage (down to 1 kV) in order to remove defects created by the focused ion beam (FIB) process and to optimise its thickness.
Foils were cut within the apparently unaltered (homogenous domains with limited grey-scale variations under the SEM in BSE mode) domains of brannerite grains from Bou Azzer and Lodrino, considered as representative of hydrothermal and pegmatitic settings. Foil observations were carried out at Centre Technologique des Microstructures (CTμ) in Lyon 1 University (France), with a JEOL2100F transmission electron microscope (TEM) operated at 200 KeV, equipped with EDS (SDD Oxford) and a high angle annular dark field (HAADF) detector used in scanning transmission electron microscopy (STEM) mode.
Raman microspectroscopy was performed at ambient temperature on polished thin-sections and plugs at IC2MP, Poitiers (France). Raman spectra were acquired using a LabRAM HR800UV confocal microspectrometer (Horiba Jobin Yvon, Villeneuve d'Ascq, France) equipped with a Peltier effect-cooled CCD (charged coupled device) detector. The excitation wavelength was set at 632.8 nm (He-Ne laser), or at 514.5 nm (Ar+ laser), or at 532.4 nm (diode solid laser). Laser power delivered at the sample was ca 19 mW (without filtering) and filters of optical densities of either 1 or 2 were used for all spectra. Samples were analysed using a confocal high-stability BXFM Olympus microscope equipped with either a 50× LMPlan (numerical aperture: 0.55), or a 100× MPlan (numerical aperture: 0.9) Olympus objective. The spatial resolution was ca 1 μm × 1 μm. The spectrometer was calibrated with a pure silicon wafer using the Raman scattering line centred on 520.7 cm–1, which resulted in an accuracy of no less than 0.5 cm–1. The apparatus had 1800 grooves mm–1 holographic grating. Spectra were recorded in the 50–1000 cm–1 Raman shift range with a spectral bandwidth of either 3.2 cm–1(with a confocal hole aperture of 200 μm at 532.4 nm), or of 8.4 cm–1 (with a confocal hole aperture of 400 μm at 514.5 nm). Data acquisition and processing were carried out using LabSpec version 5 software (Horiba Jobin Yvon).
The major-element composition of brannerite was obtained by electron probe micro-analyser (EPMA), at GeoRessources, Nancy, (France), using a Cameca SX100 equipped with five wavelength dispersion spectrometers (WDS). Carbon-coated polished thin sections were analysed with an acceleration voltage of 20 kV and a current of 100 nA. The spatial resolution is ca. 1 μm, with an average acquisition time of 5 minutes. Oxides, silicates, and pure metals were used as standards (Table A1, deposited as Supplementary material see below). In addition, quantitative and qualitative elemental composition maps were obtained using: (1) a Field-Emission Gun (FEG) Cameca SXFive FE, equipped with five WDS at the Centre de MicroCaractérisation Raimond Castaing at Toulouse (France) (for samples from Himalaya and El Cabril); and (2) a JEOL 8200 Superprobe equipped with five WDS, hosted at the University of Geneva (for the sample from Bou Azzer), respectively. In these cases, the acceleration voltage was 10 kV and current 100 nA. Elemental composition maps were produced with a resolution of 1 μm and an acquisition time of 600 ms per pixel. Following Colella et al. (Reference Colella, Lumpkin, Zhang, Buck and Smith2005), U4+, U5+ or U6+ relative content was estimated on a basis of 6 oxygen atoms and 3 cations. There is no unique solution to balance charges, therefore the average valence state has been chosen as the most reliable parameter.
The minor- and trace-element contents were quantified using a laser ablation (193-nm excimer Geolas Q Plus System) coupled to an inductively-coupled plasma mass spectrometer (Agilent 7500c Quadrupole) at Georessources, Nancy (France). The fluence was 5 J cm−2, using a repetition rate of 5 Hz. The laser spot sizes were 24 or 32 μm in diameter, depending on the size of brannerite crystals. The total acquisition time, including background and signal was limited to 200 s per analysis, with a background acquisition of 30 s before ablating the material for 40 s. The following elements were measured: B, Mb, Al, Si, Ca, Ti, Cr, Mn, Fe, Co, Ni, Cu, Zn, Y, Nb, Mo, the REEs, Pb, Th and U with a dwell time of 10 ms (except 5 ms for U and Pb). The cycle time was 394 ms. The He flux was fixed at 0.5 l min–1 and 0.9 l min–1 of Ar was added before it entered the plasma. The reference material was a SRM NIST 610 glass standard (Pearce et al., Reference Pearce, Perkins, Westgate, Gorton, Jackson, Neal and Chenery1997) and Ti and/or U contents measured by EPMA on the same area were used as an internal standard. Data reduction was carried out with IOLITE software (Paton et al., Reference Paton, Hellstrom, Paul, Woodhead and Hergt2011). Analytical precision is calculated for all elements analysed using standard deviation of recorded intensity, is greater than ± 15% for concentrations higher than 10 ppm, and becomes greater (±50% to ± 70%) for concentrations <10 ppm. The limit of detection varies for each element as a function of signal intensity and was calculated for each ablation from signal intensities using the 3σ criterion (Longerich et al., Reference Longerich, Jackson and Gunther1996). The most commonly achieved detection limits are <2 ppm for the trace-elements measured.
The comparison between compositions of brannerite from different deposits was achieved by estimating the difference in content of a given element (see detailed procedure in Machault et al., Reference Machault, Barbanson, Augé, Bailly and Orgeval2014). For this, we first calculated the coefficient of variation defined by Cv (%) = σ/μ (where σ is the standard deviation and μ is the average) to describe the degree of homogeneity for the distribution of the elements analysed. The non-parametric Kolmogorov–Smirnov test (e.g. Press et al., Reference Press, Flannery, Teukolsky and Vetterling1986) was then used to compare two populations and therefore evaluate the homogeneity between two samples. We also applied multivariate statistical processing, to highlight the substitution trends within brannerite. Principal component analysis (PCA) is a powerful variable-reduction technique, which is increasingly applied to geochemical data (e.g. Belissont et al., Reference Belissont, Boiron, Luais and Cathelineau2014). By recalculating principal components, which are defined as orthogonal linear combinations of the initial variables, it is possible to project multivariate data in two-dimensions with minimal data loss. The two first principal components, which are used in this study, carry the highest explained variance, corresponding to the most significant relationships between the variables. More detail about the PCA method can be found in Koch (Reference Koch2012). For all calculations, we used R software and the FactorMin R package for PCA (Lê et al., Reference Lê, Josse and Husson2008).
Results
Petrography of brannerite ores
Hydrothermal brannerite
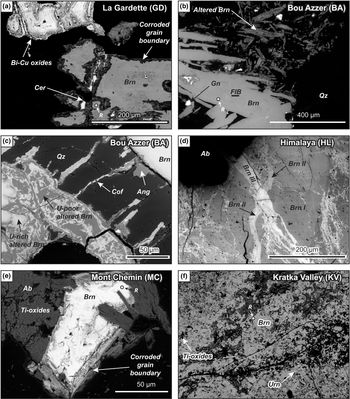
Brannerite crystals from La Gardette occur as laths, associated with Bi–Cu minerals (emplectite and wittichenite), native gold and quartz (Fig. 3a). A corroded boundary is always observed and composed of newly formed and compositionally different brannerite, cerussite, REE phosphates, and iron oxides. Brannerite includes minute inclusions of U-rich minerals (not determined), while inclusion-free brannerite veins are also very common.
Back-scattered scanning electron (BSE) images of hydrothermal brannerite. (a) Brannerite from La Gardette, associated with Cu–Bi sulfides and surrounded by a corroded grain boundary. (b) Altered (upper right corner) and unaltered brannerite from Bou Azzer. The location of a FIB foil cut across unaltered brannerite is marked. (c) Detailed view of altered Bou Azzer brannerite characterised by a complex association of U-rich and U-poor domains. Note the presence of radial fractures filled with coffinite around altered brannerite. (d) Stockwork with early brannerite (Br I) crosscut by two successive brannerite veins (Br II and Br III) from Himalaya. (e) Partly altered (light grey) brannerite crystal from Mont Chemin. (f) Brannerite from Kratka Valley, associated with undetermined Ti oxides and minute uraninite inclusions. The location of Raman analyses (R) is reported for each brannerite sample. Abbreviations: Ab: Albite; Ang: Anglesite; Brn: Brannerite; Cer: Cerussite; Cof: Coffinite; Gn: Galena; Qz: Quartz; Urn: Uraninite.

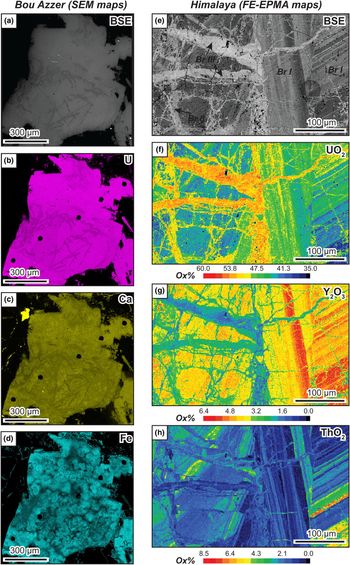
Samples from Bou Azzer exhibit elongated laths of brannerite associated with quartz, baryte and minor galena (Fig. 3b). Except for the presence of galena inclusions, BSE images of brannerite crystals show a rather homogeneous internal structure suggesting that brannerite crystals may be homogeneous in composition. However, element distribution mapping reveals a complex inner structure within crystals (Fig. 4a–d), marked by the presence of sub-rounded domains with varying Fe contents (Fig. 4d) Alteration also occurs as partial-to-full replacement (Fig. 3b), marked by an intricate association of U-rich and U-poor Ti oxides that coexist with coffinite and sulfate minerals (baryte, anglesite) (Fig. 3c).
False-colour (a–d) qualitative EDS-SEM X-ray compositional maps of brannerite crystals from the Bou Azzer occurrence; and (e–h) quantitative FE-EPMA element-distribution maps from the Himalaya occurrence.
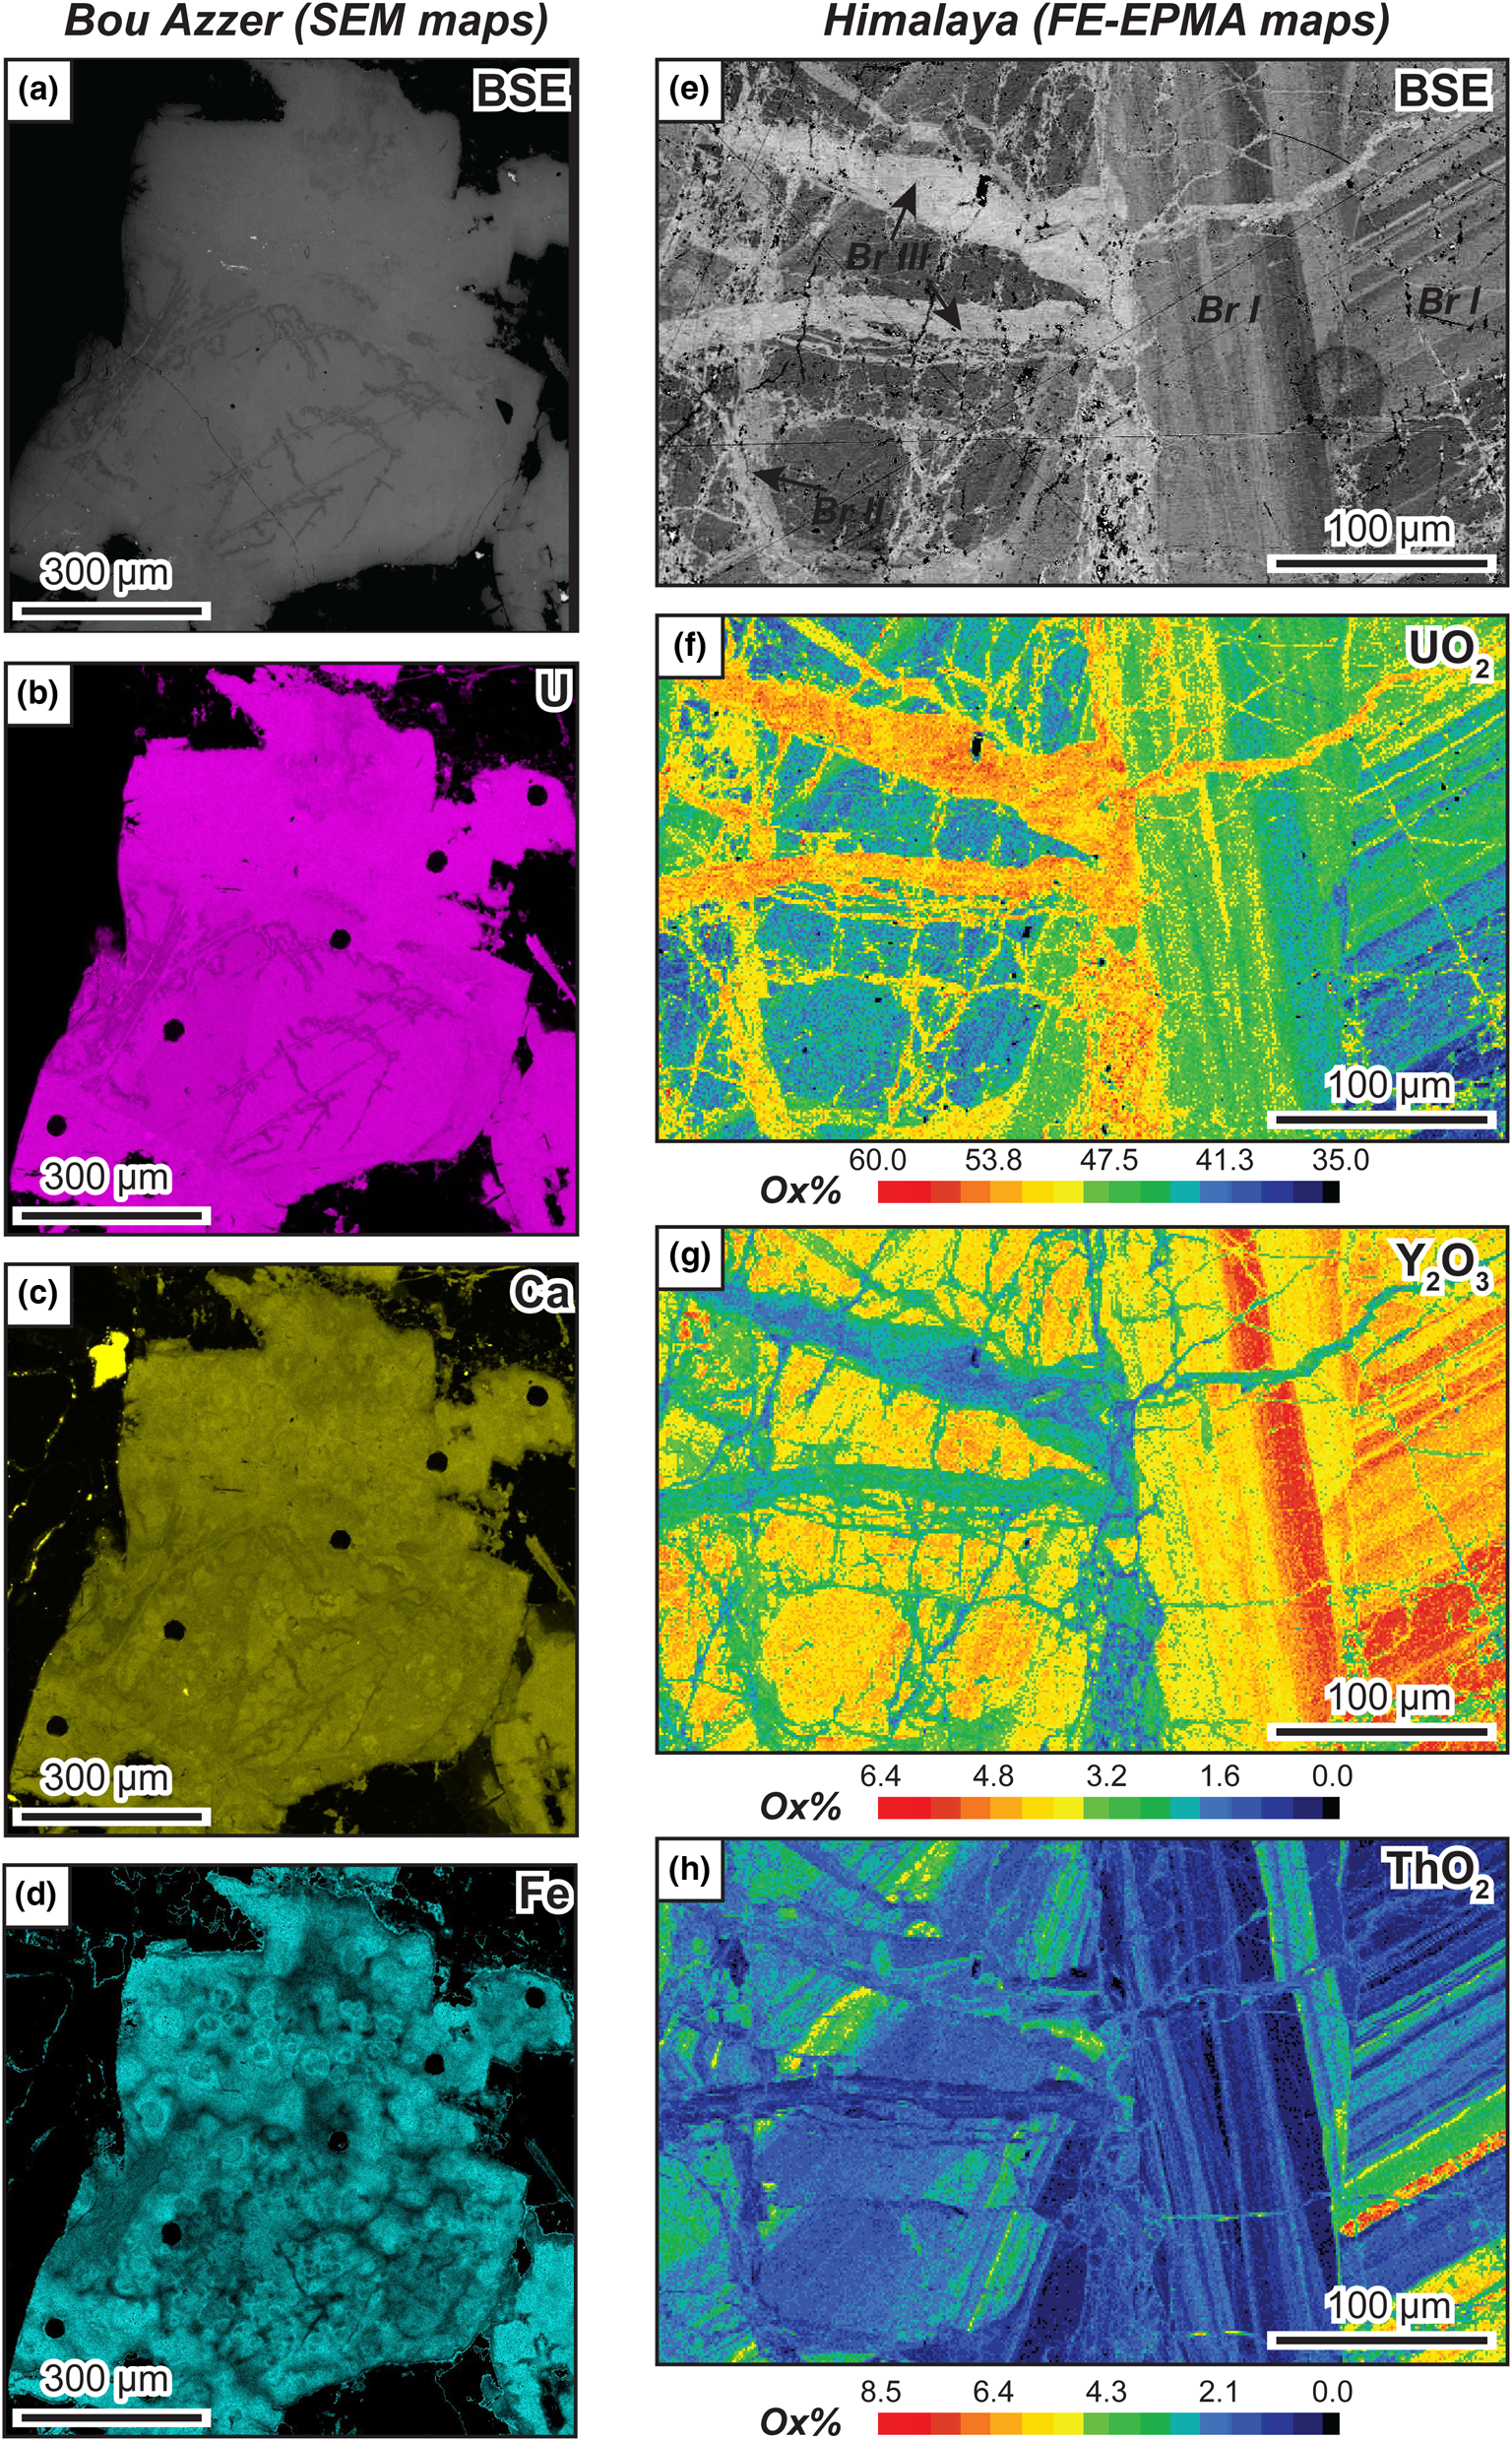
Millimetre-sized anhedral crystals of brannerite from Himalaya are enclosed in albite. BSE images and X-ray mapping reveal at least three distinct stages of brannerite crystallisation (Figs 3d, 4e–h). The first stage (Br I) is characterised by oscillatory-zoning and U, Th and Y chemical variation (Fig. 4f–h). This primary brannerite is cross-cut by two successive generations of veins (Br II and Br III) that can resemble a stockwork. These veins are rich in U and poor in Y and Th. Alteration rims are very limited, but a Cu-U-bearing arsenate, possibly (meta-)zeunerite, and unidentified phosphate minerals are commonly found around these crystals.
Brannerite from Mont Chemin occurs as small crystals (<150 μm), associated with anatase, biotite, K-feldspar, REE carbonates and minor uraninite inclusions. Crystals are usually prismatic and display a large rim of altered brannerite (Fig. 3e). At Kratka Valley, brannerite occurs as sub-rounded crystals within a quartz matrix. Fractures are common and numerous inclusions of Ti oxides and uraninite are observed (Fig. 3f). Alteration is pervasive.
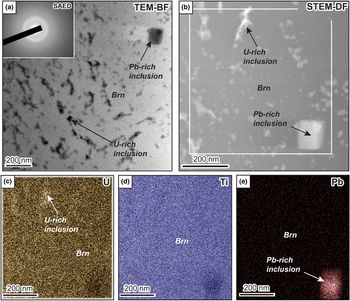
In the sample from Bou Azzer, TEM-Bright Field (BF, Fig. 5a) and STEM-HAADF (STEM-DF, Fig. 5b) images reveal the presence of a dense network of inclusions, either enriched in U (Fig. 5c) or in Pb (Fig. 5e). Selected area electron diffraction (SAED) patterns identified within brannerite and dark U-rich inclusions result in broad diffuse rings equivalent to amorphous material (inset in Fig. 5a). The only trace of nano-crystalline material within the Bou Azzer sample corresponds to the cubic-like Pb-rich inclusion, undoubtedly galena. The amorphous state of natural hydrothermal brannerites is also verified by Raman microspectroscopy (Fig. A1, deposited as Supplementary material, see below). The Raman spectra of hydrothermal brannerite samples, acquired in unaltered domains (Fig. 3), do not exhibit the characteristic features of pure synthetic brannerite (Mesbah et al., Reference Mesbah, Szenknect, Clavier, Lin, Baron, Beaufort, Batonneau, Mercadier, Eglinger, Turuani, Goncalves, Choulet, Chapon, Seydoux-Guillaume, Pagel and Dacheux2019). The Raman spectra of brannerite samples exhibit a small but significant feature at 151 cm–1 (only for the La Gardette sample) and broad and poorly resolved features around 600, 750 and 820 cm–1 (Fig. A1).
TEM and scanning TEM (STEM) images from a FIB foil cut across a brannerite crystal from Bou Azzer. (a) TEM Bright Feld (BF) image showing the abundance of U-rich and more rarely Pb-rich inclusions within brannerite (Brn). Inset corresponds to SAED pattern from brannerite filled with U-rich inclusions and demonstrates its amorphous state. (b) STEM HAADF (STEM-DF) image of a magnified area shown in (a). In this mode, bright areas correspond to high-density materials (e.g. U-rich or Pb-rich inclusion) or thicker regions. The white rectangle indicates the location of EDS chemical maps (c–e) for U, Ti and Pb, respectively, revealing the presence of Pb and U-rich domains;

Pegmatitic brannerite
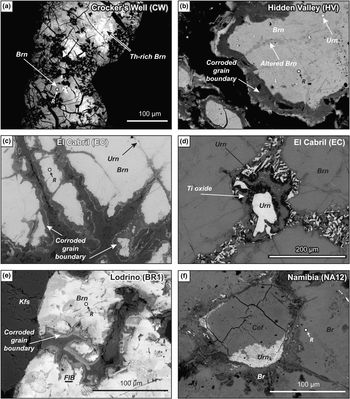
Samples from Crocker's Well display sub-rounded elongated crystals of brannerite showing intensive microfracturation (Fig. 6a). Brannerite is associated with Ti oxides, which are also present as micrometre-sized euhedral inclusions within brannerite. Along fractures and in the rim, U–Th-rich silicates (possibly uranothorite) coexist with brannerite, although no genetic relationships can be demonstrated. This association is characteristic of an altered zone, which can also display U-depleted zones (Fig. 6a) and apatite. Microfractures are filled with U-Th secondary products, which are too small to be identified with the techniques employed here.
BSE images of pegmatitic brannerite: (a) brannerite monocrystal from Crocker's Well, showing pervasive cracking and chemical zoning due to variable Th enrichment; (b) brannerite from Hidden Valley exhibiting altered domains along fractures (dark grey), uraninite inclusions and a complex corroded boundary; (c) brannerite from El Cabril with uraninite inclusions and pervasive corrosion along grain margins; (d) brannerite from El Cabril showing partial replacement by secondary uraninite, Ti oxide and unknown Y-rich minerals (see Fig. 6d); (e) partly altered brannerite from Lodrino pegmatite (the location of the FIB foil cut across unaltered brannerite is shown); and (f) secondary uranium minerals developing along cracks in brannerite from NA12 pegmatite (Namibia). The location of Raman analyses (R) is reported for each brannerite sample. Abbreviations: Brn: Brannerite; Cof: Coffinite; Kfs: K-feldspar; and Urn: Uraninite.
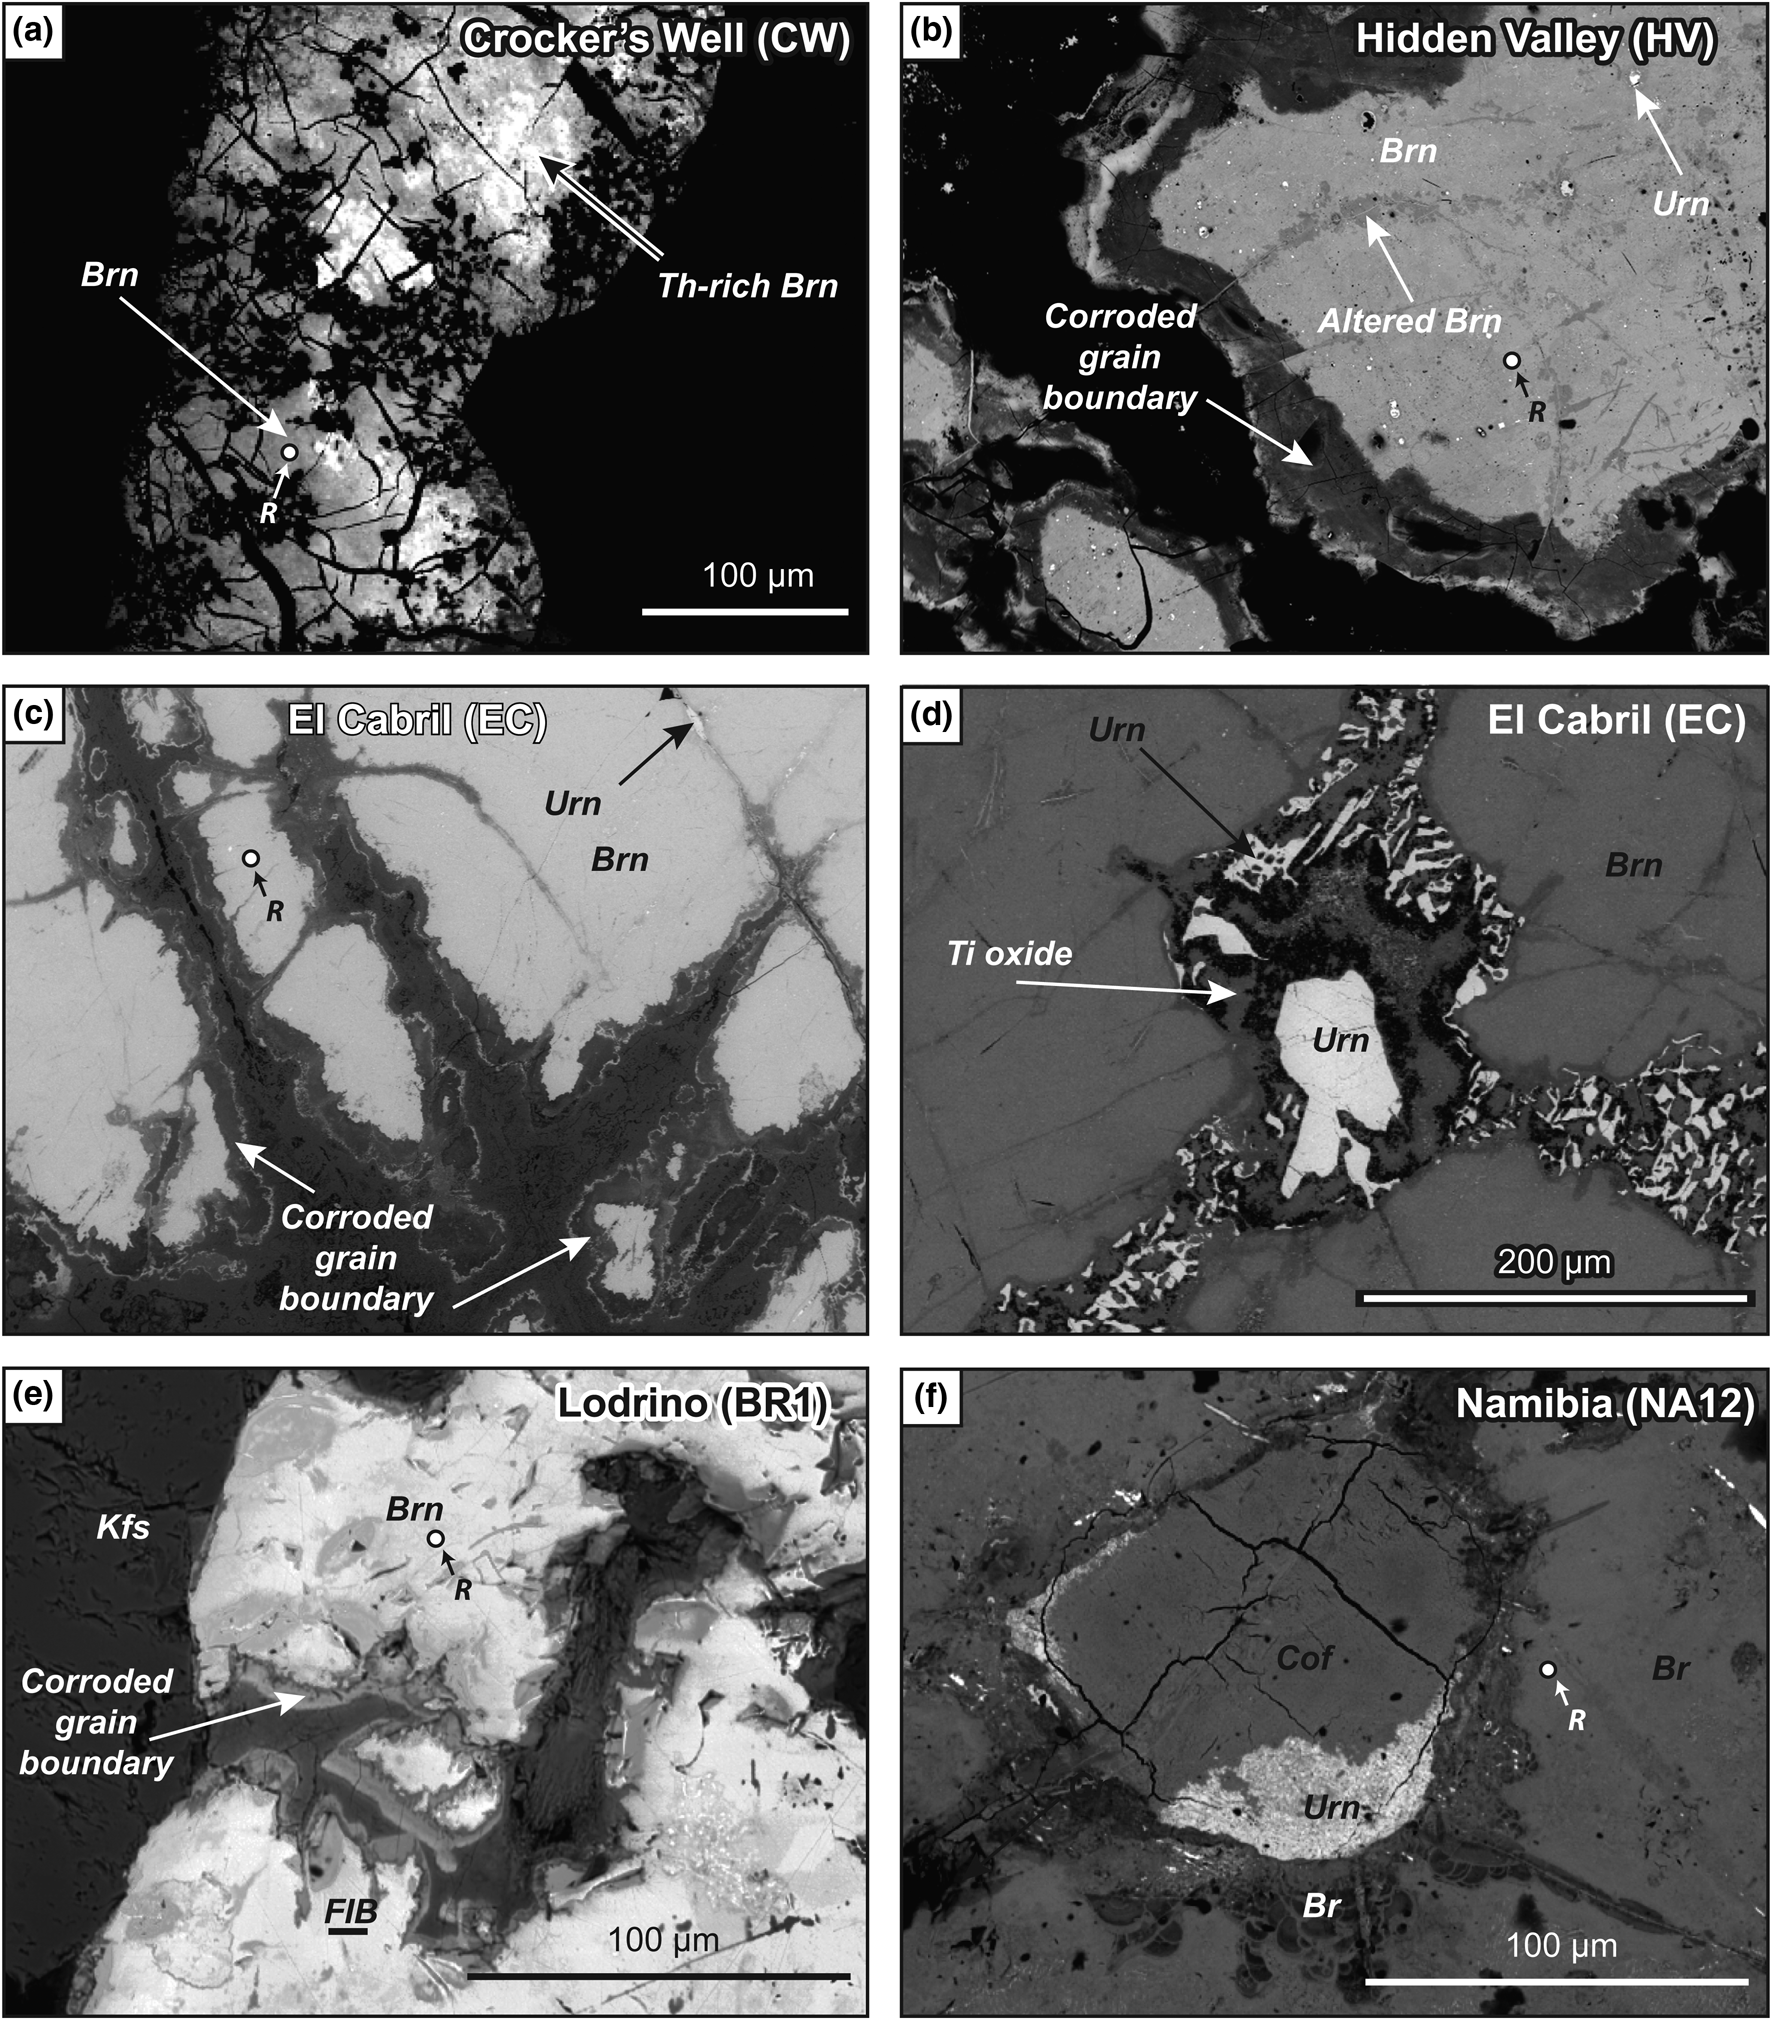
Brannerite from Hidden Valley is a single elongated millimetre-sized crystal, which displays well-developed corroded boundaries and transversal fracturing with alteration (Fig. 6b). Preserved brannerite exhibits tiny uraninite inclusions. The rim is zoned, showing differences in U depletion; it also contains secondary U–Th minerals, which belong to the thorite–coffinite series, according to Raman spectroscopic analyses.
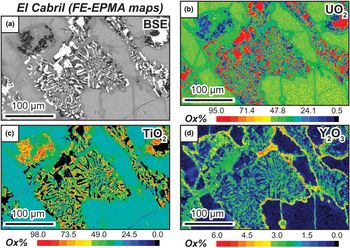
The single crystal of brannerite from El Cabril is also characterised by a pervasive corroded boundary (Fig. 6c), but we also observed the presence of parallel fractures filled with a symplectite-like association of uraninite and Ti oxides (Figs 6d, 7a–c), locally associated with an unknown yttrium-rich phase (Fig 7d). At sites of dilational discontinuities, uraninite crystals are bigger in size, but still anhedral. This fracturing/filling stage predates alteration, which occurs as a large and complex rim, surrounding the single crystal. This rim presents a succession of U-depleted domains with locally botryoidal aggregates and thin lamina of U–Ti oxides.
False-colour quantitative FE-EPMA element-distribution maps for samples from the El Cabril occurrence.

Euhedral prismatic brannerite crystals from Lodrino are associated with K-feldspar. They display no evidence of internal texture, but, locally, a complex zoned rim of altered brannerite has been observed (Fig. 6e). Brannerite from Namibia is also a single crystal, which presents a sub-rounded irregular shape. Inclusions are rare within brannerite, but fractures are locally filled with uraninite partially replaced by coffinite (Fig. 6f). Interestingly, brannerite also occurs with a collomorph texture, very similar to frequently observed pitchblende (Fig. 6f).
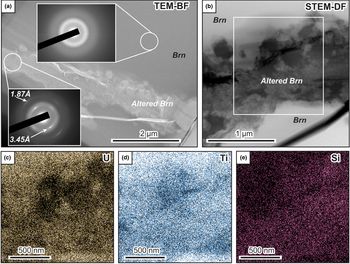
In the Lodrino sample, BF-TEM and DF-STEM images show the presence of altered domains within brannerite (Fig. 8a–b), with a variation in composition for U, Ti and Si (Fig. 8c–e). The brightest parts within this area (Fig. 8b) seem to be enriched in Si, and sometimes correlated with U enrichment. In contrast, darker areas are depleted in U and Ti. Pristine brannerite areas only reveal U and Ti. The diffraction pattern within the unaltered brannerite domain indicates it is completely amorphous (upper inset in Fig. 8a); in contrast the diffraction pattern from the altered domain shows evidence of nano-crystalline material, with two intense rings with d spacings of 3.45 Å and 1.87 Å (lower inset in Fig. 8a). The amorphous state of natural pegmatite brannerite is confirmed by Raman microspectroscopy (Fig. A1), as similarly to hydrothermal brannerite, the Raman spectra acquired in unaltered domains (Fig. 6), do not exhibit the characteristic features of pure synthetic brannerite (Zhang et al., Reference Zhang, Karatchevtseva, Qin, Middleburgh and Lumpkin2013; Mesbah et al., Reference Mesbah, Szenknect, Clavier, Lin, Baron, Beaufort, Batonneau, Mercadier, Eglinger, Turuani, Goncalves, Choulet, Chapon, Seydoux-Guillaume, Pagel and Dacheux2019). Again, with the exception of the well-defined feature at 151 cm–1, the sample from Namibia, only has broad and poorly resolved features around 600, 750 and 820 cm–1 (Fig. A1).
TEM and STEM images from a FIB foil cut across a brannerite crystal from Lodrino. (a) TEM-BF image, showing the presence of altered domains within unaltered brannerite. SAED patterns from unaltered brannerite (top insert) also supports the amorphous state of brannerite, while SAED pattern from altered brannerite (lower insert) indicate the presence of nanocrystalline domains (possibly coffinite). (b) STEM-DF magnified image in the same area. The white rectangle indicates the location of EDS chemical maps (c–e) for U, Ti and Si, respectively, demonstrating depletion or enrichment in the altered domain relative to the unaltered domain. Brn: brannerite.

Major- and minor-element content
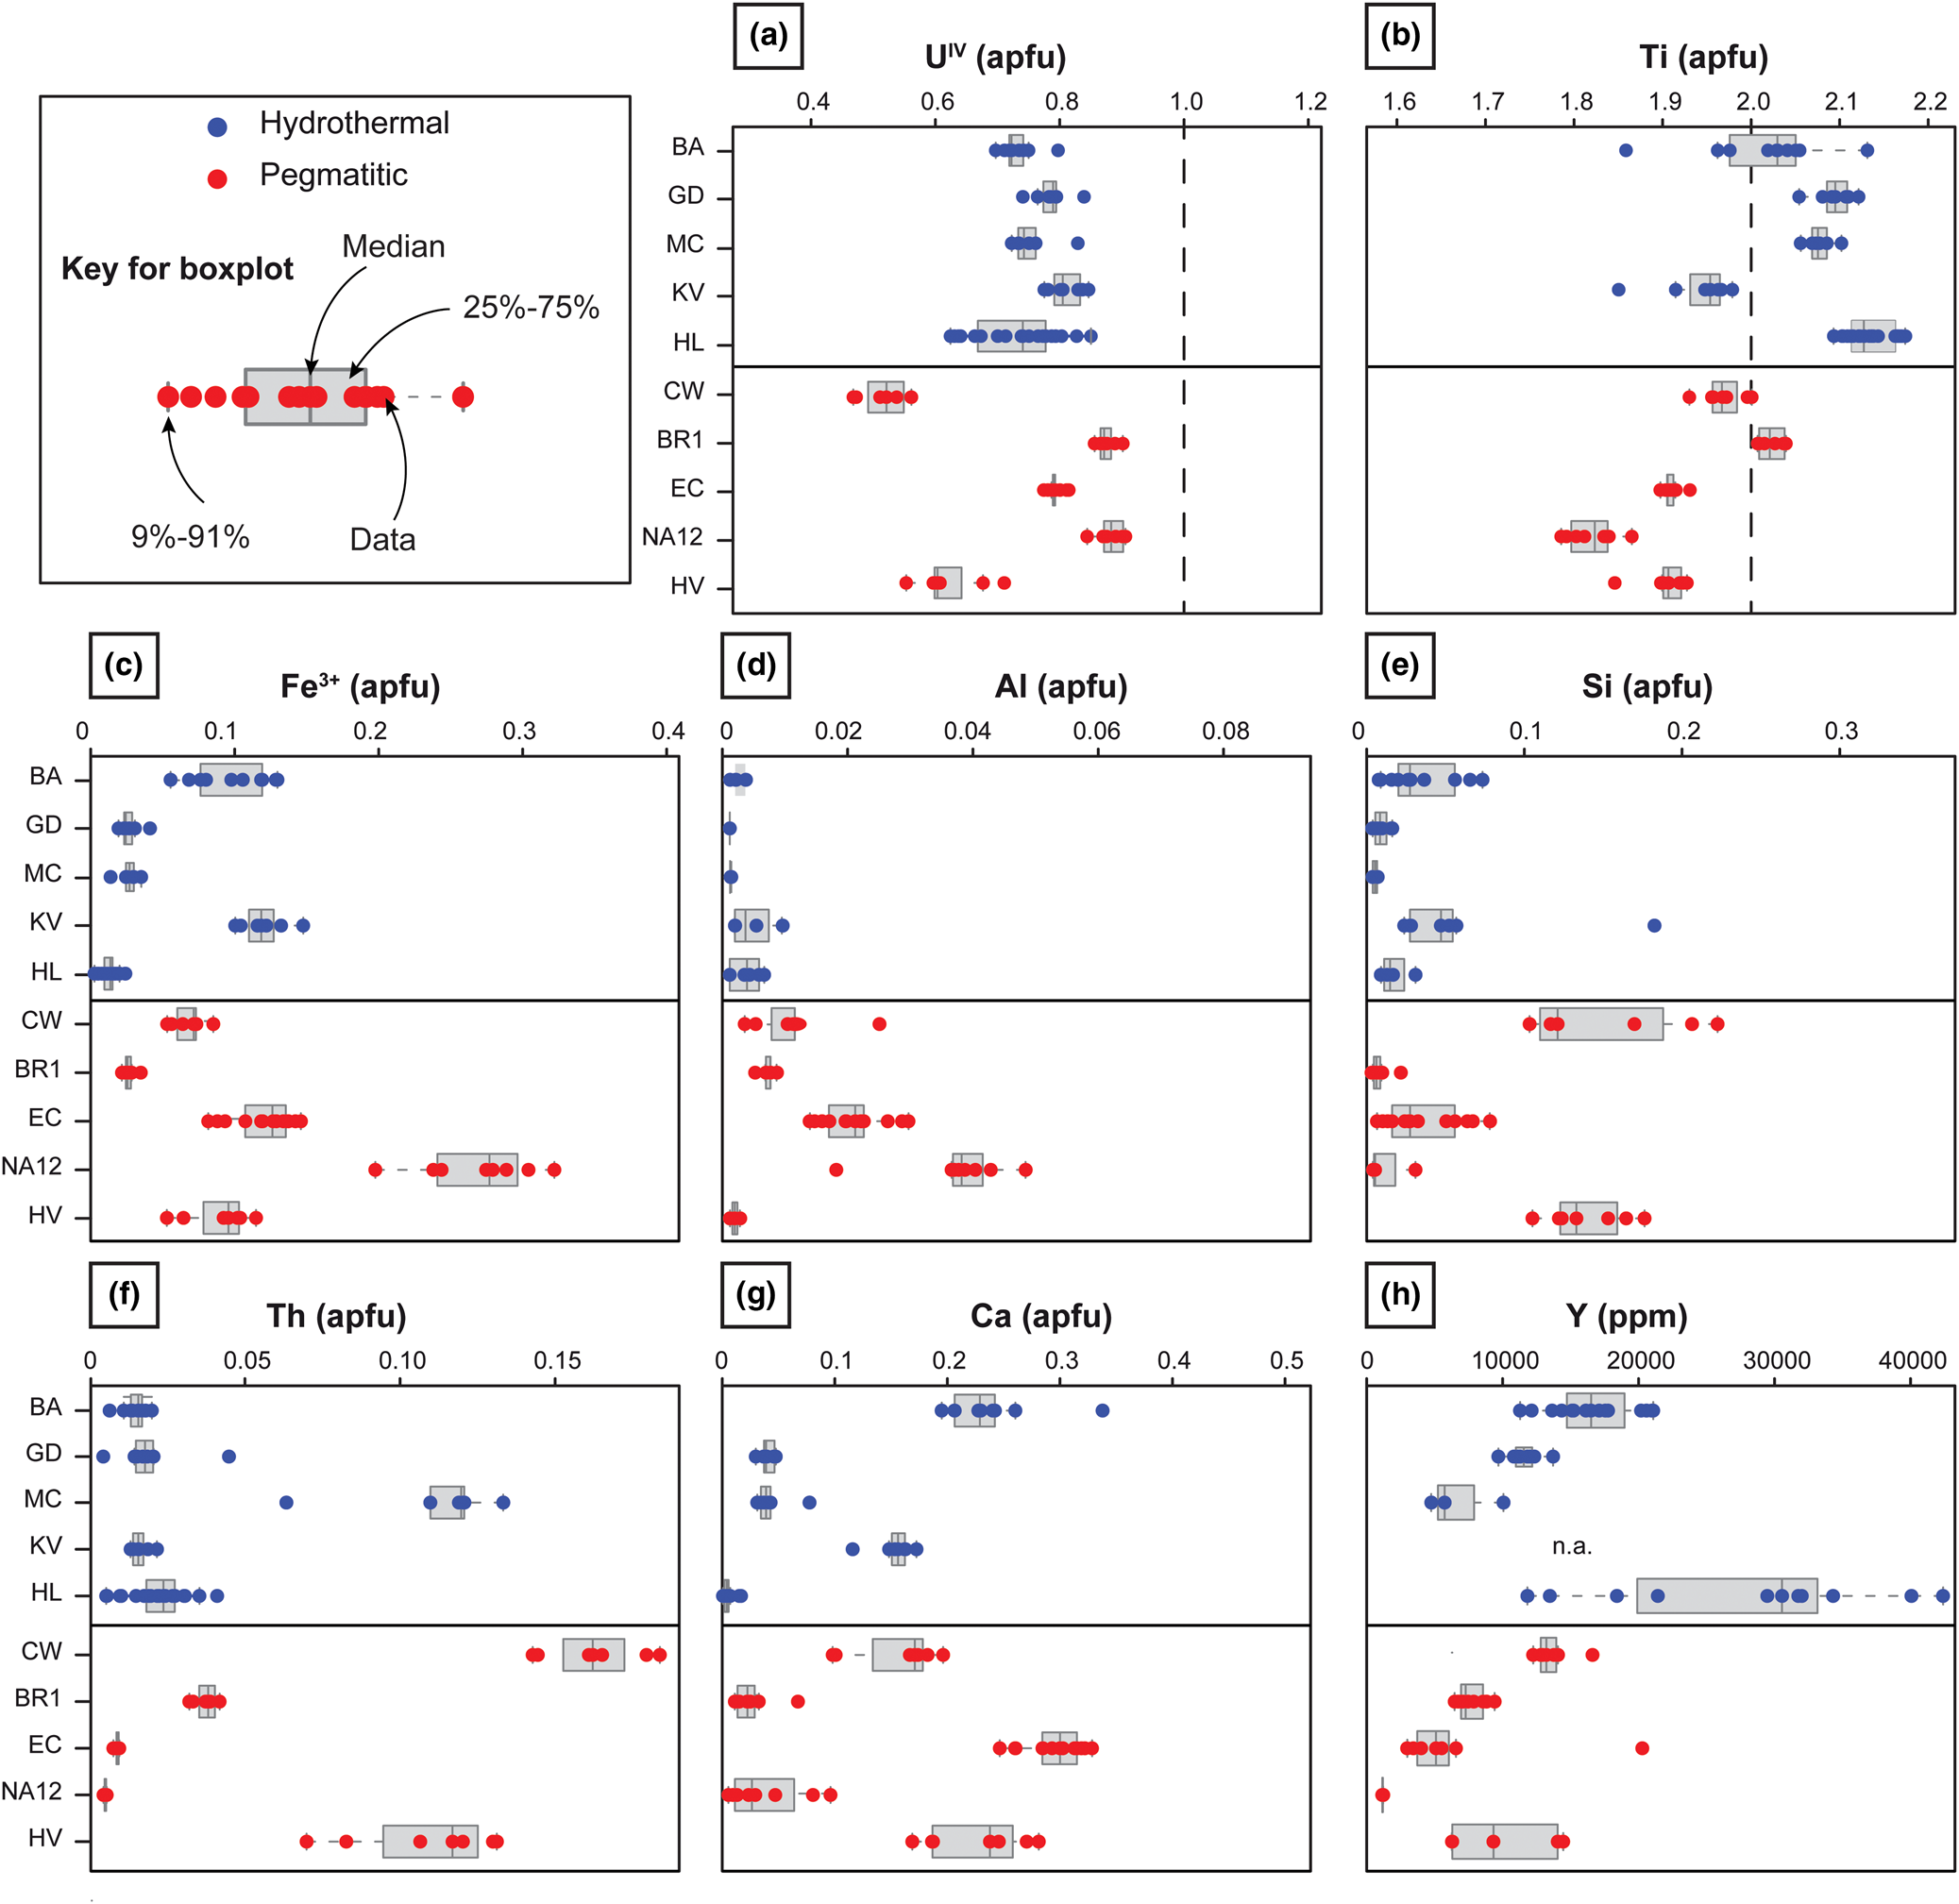
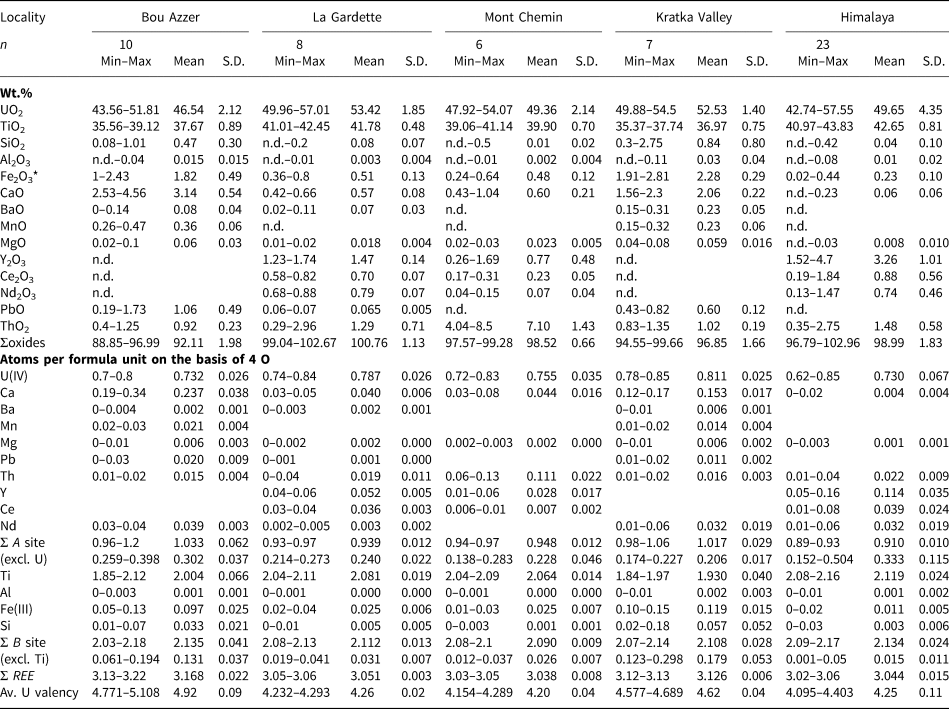
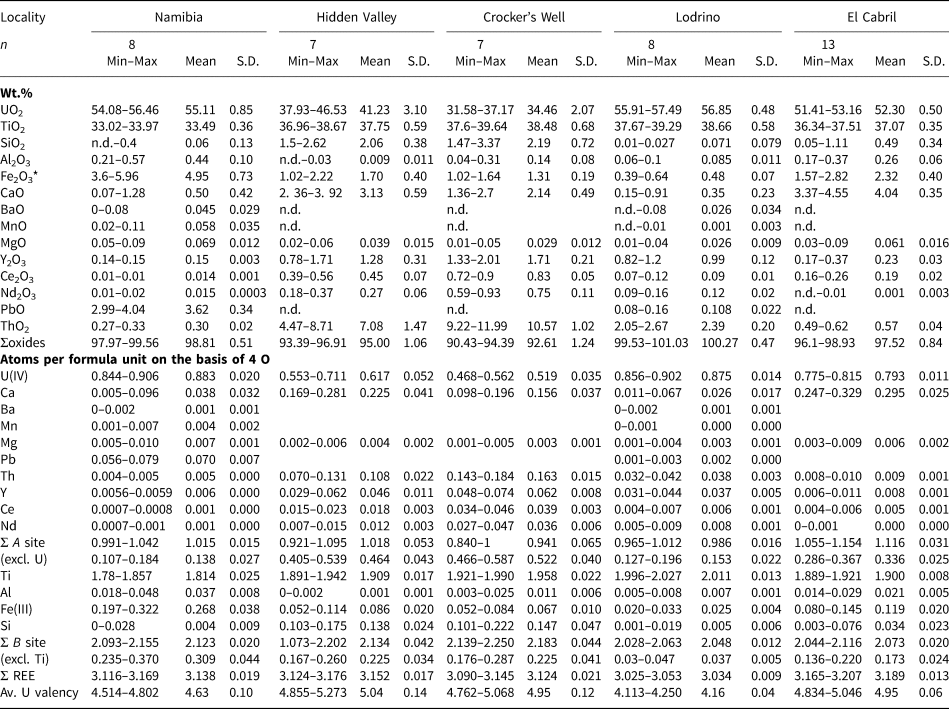
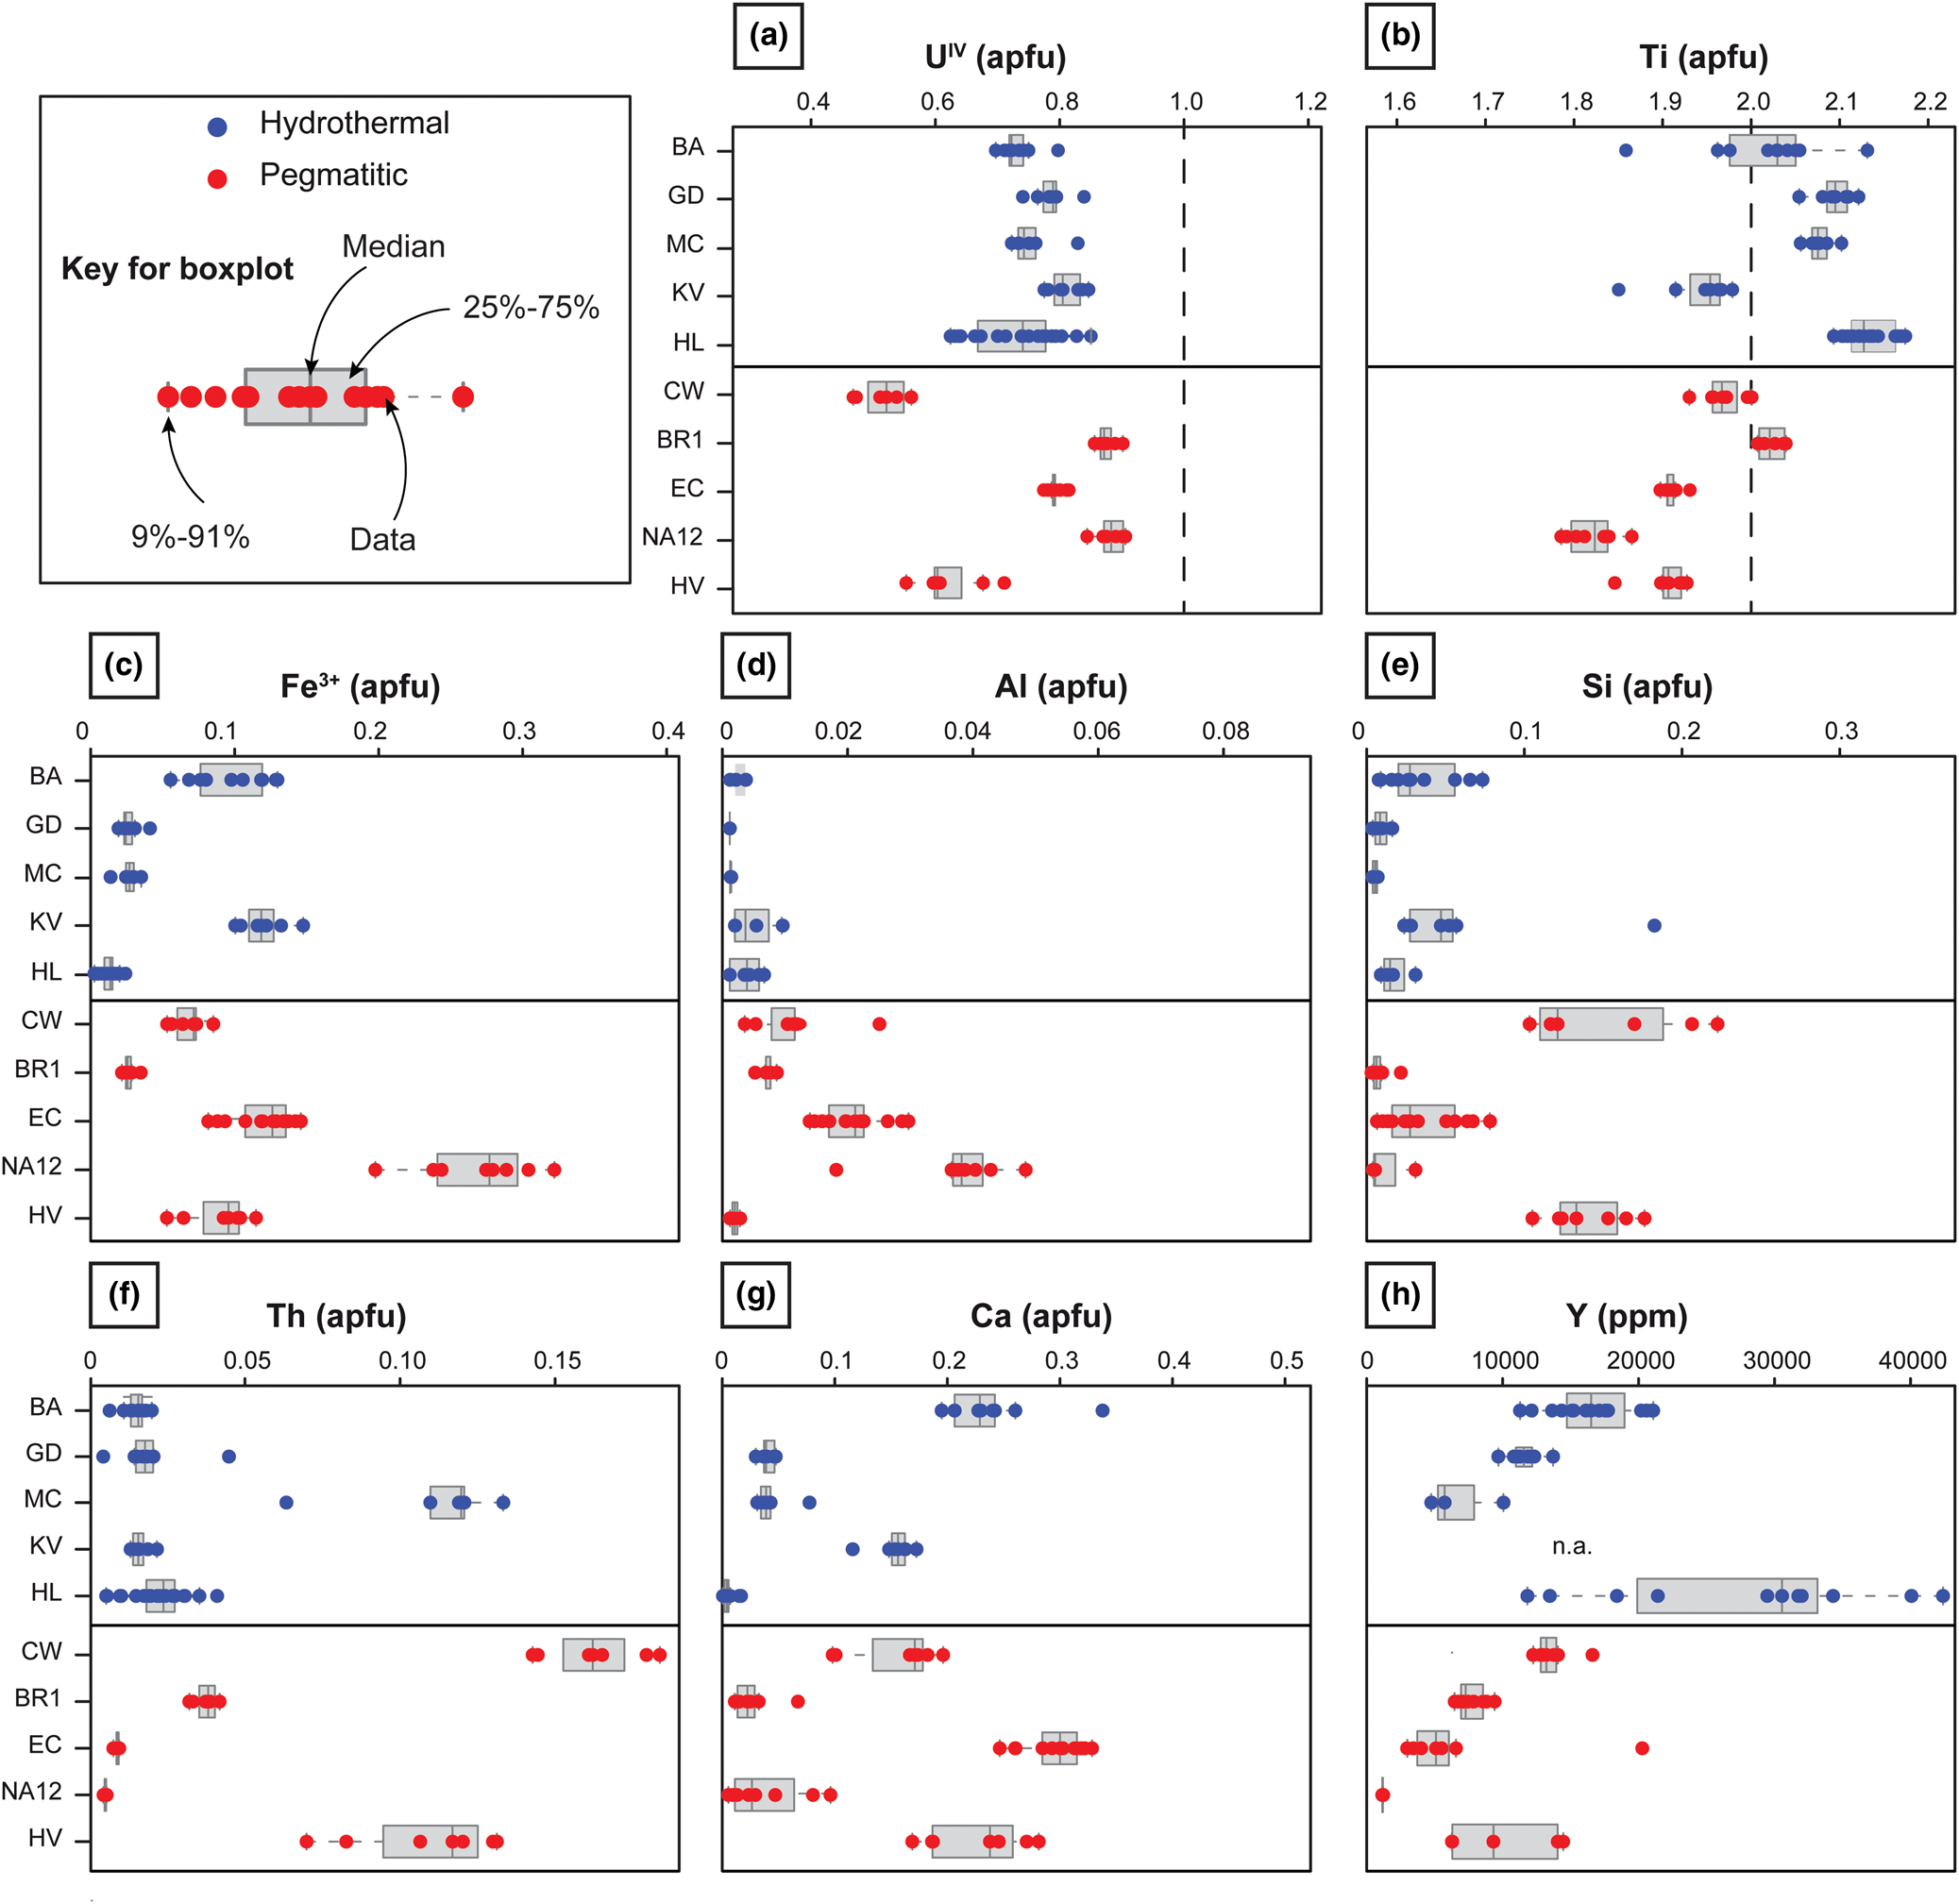
The composition of brannerite was obtained from domains that appear homogenous and middle grey under the SEM (Figs 3, 6), away from corroded grain boundaries (e.g. Figs 3a, 6c) and altered domains, e.g. along fractures (e.g. Fig. 6b,f). Tables 1 and 2 and boxplots of Fig. 9 summarise the distribution of major and minor element contents, expressed in atoms per formula unit (apfu), following Colella et al. (2005; see section ‘Material and methods’). The measured U content is always <1 apfu. While the Ti content of hydrothermal brannerite ranges from 1.9 to 2.1 apfu, this value is always <2 apfu for pegmatitic brannerite, except for BR1.
Boxplots of major and minor element contents for each brannerite sample from pegmatitic (red) and hydrothermal (blue) sources. Contents are given in apfu, calculated on the basis of 6 oxygen atoms from EPMA results (Tables 1, 2). For Y, abundances obtained by LA-ICP-MS measurement and available in Tables 3 and 4 are reported. The dashed line in (a) and (b) represents the theoretical U and Ti contents of ideal UTi2O6 brannerite, respectively.
Compositional data from EPMA of brannerite from hydrothermal genetic types.
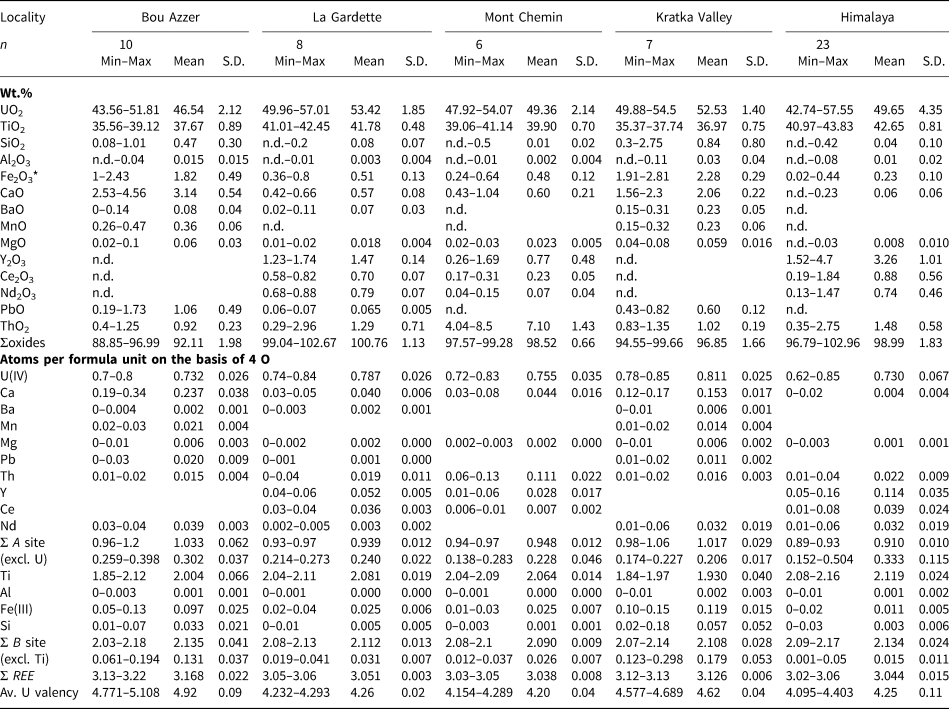
* Fe2O3 recalculated from FeO. S.D. = standard deviation. n.d. = not detected.
Compositional data from EPMA of brannerite from magmatic (pegmatitic) genetic types.
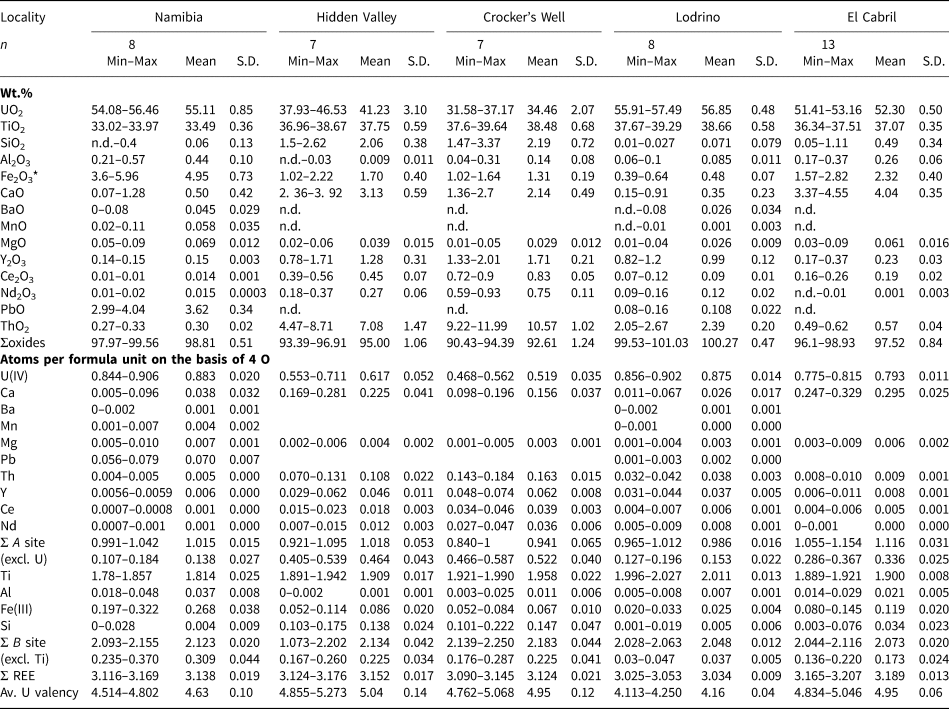
* Fe2O3 recalculated from FeO. S.D. = standard deviation. n.d. = not detected.
For major and minor elements, we observe variations in composition between geological settings. For instance, aluminium in hydrothermal brannerite is always <0.01 apfu, while brannerites from pegmatites have wider ranges in Al contents. Compositional variations are also observed within a single geological environment. Ti, Fe and Y for hydrothermal brannerite show significant variations, while U, Ca and Th are the most variable components in pegmatitic brannerite. Finally, significant variations in composition are also observed for a given occurrence: e.g. U, Y and Th for Himalaya and Ti, Fe and Si for Bou Azzer. Such variability within a single sample is also revealed by element maps, which display the compositional zoning within crystals (e.g. U, Th and Y in brannerite from Himalaya, Fig. 4e–h).
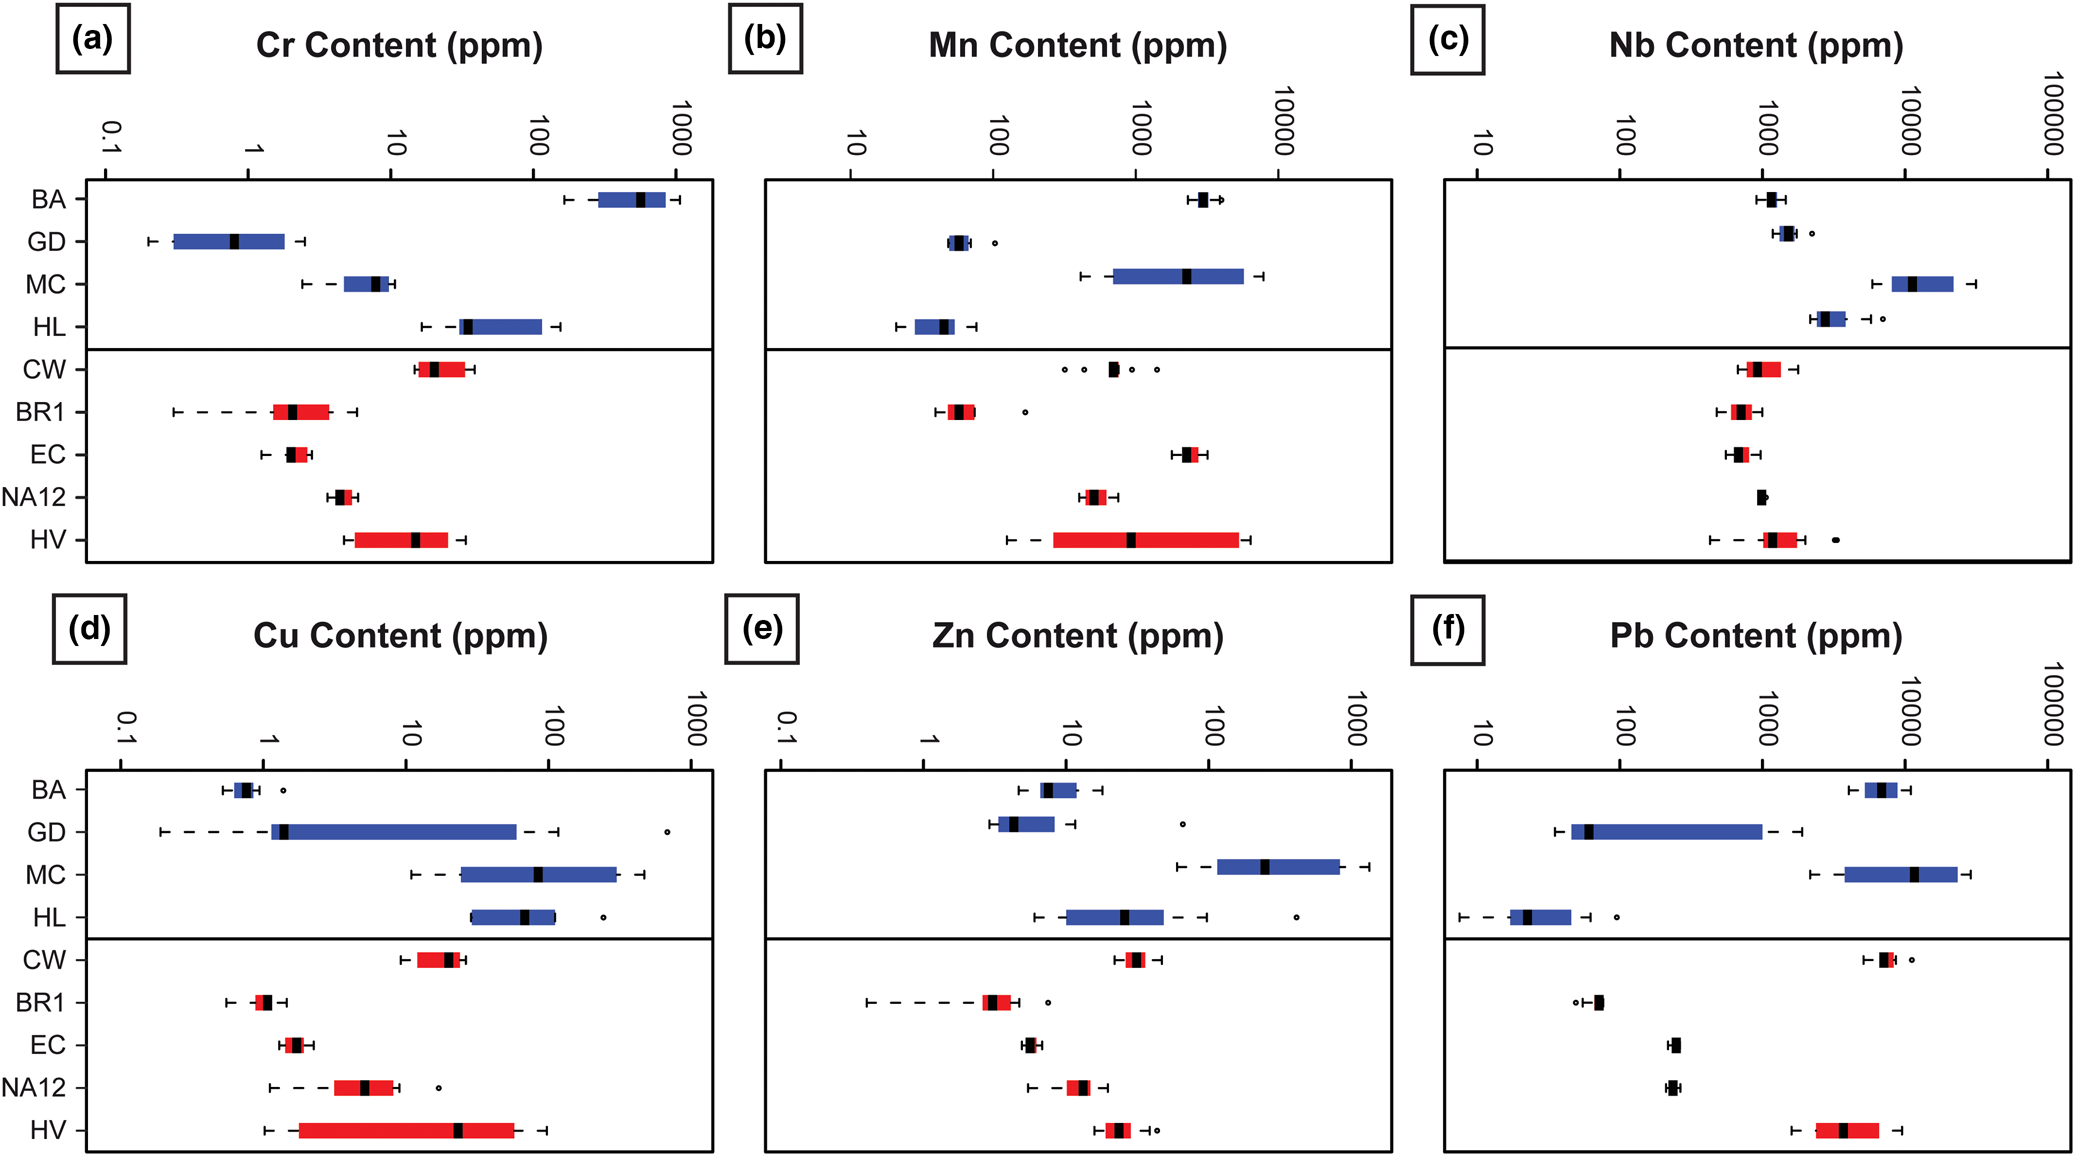
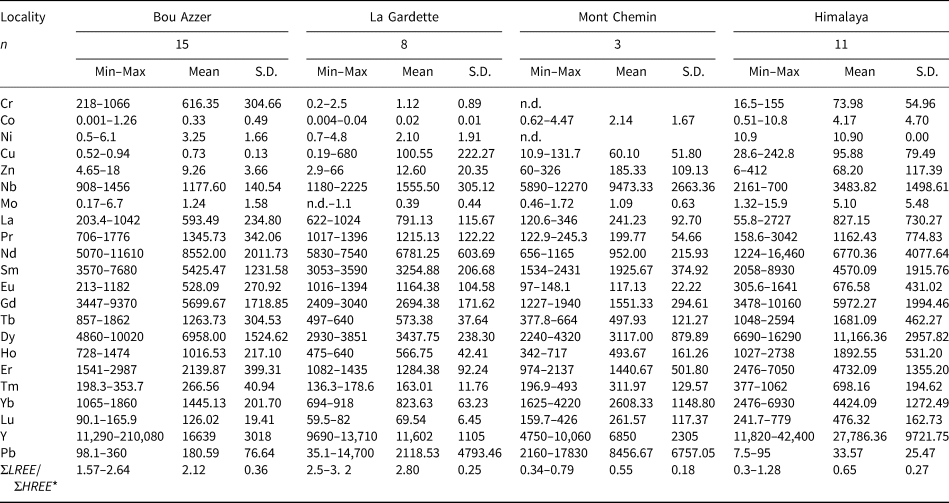
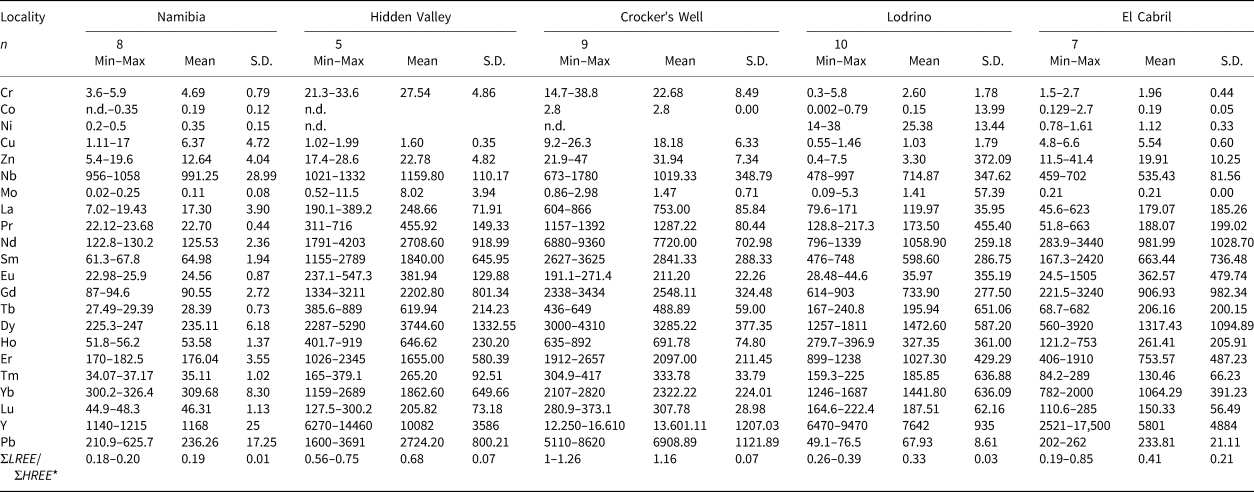
Trace-element content
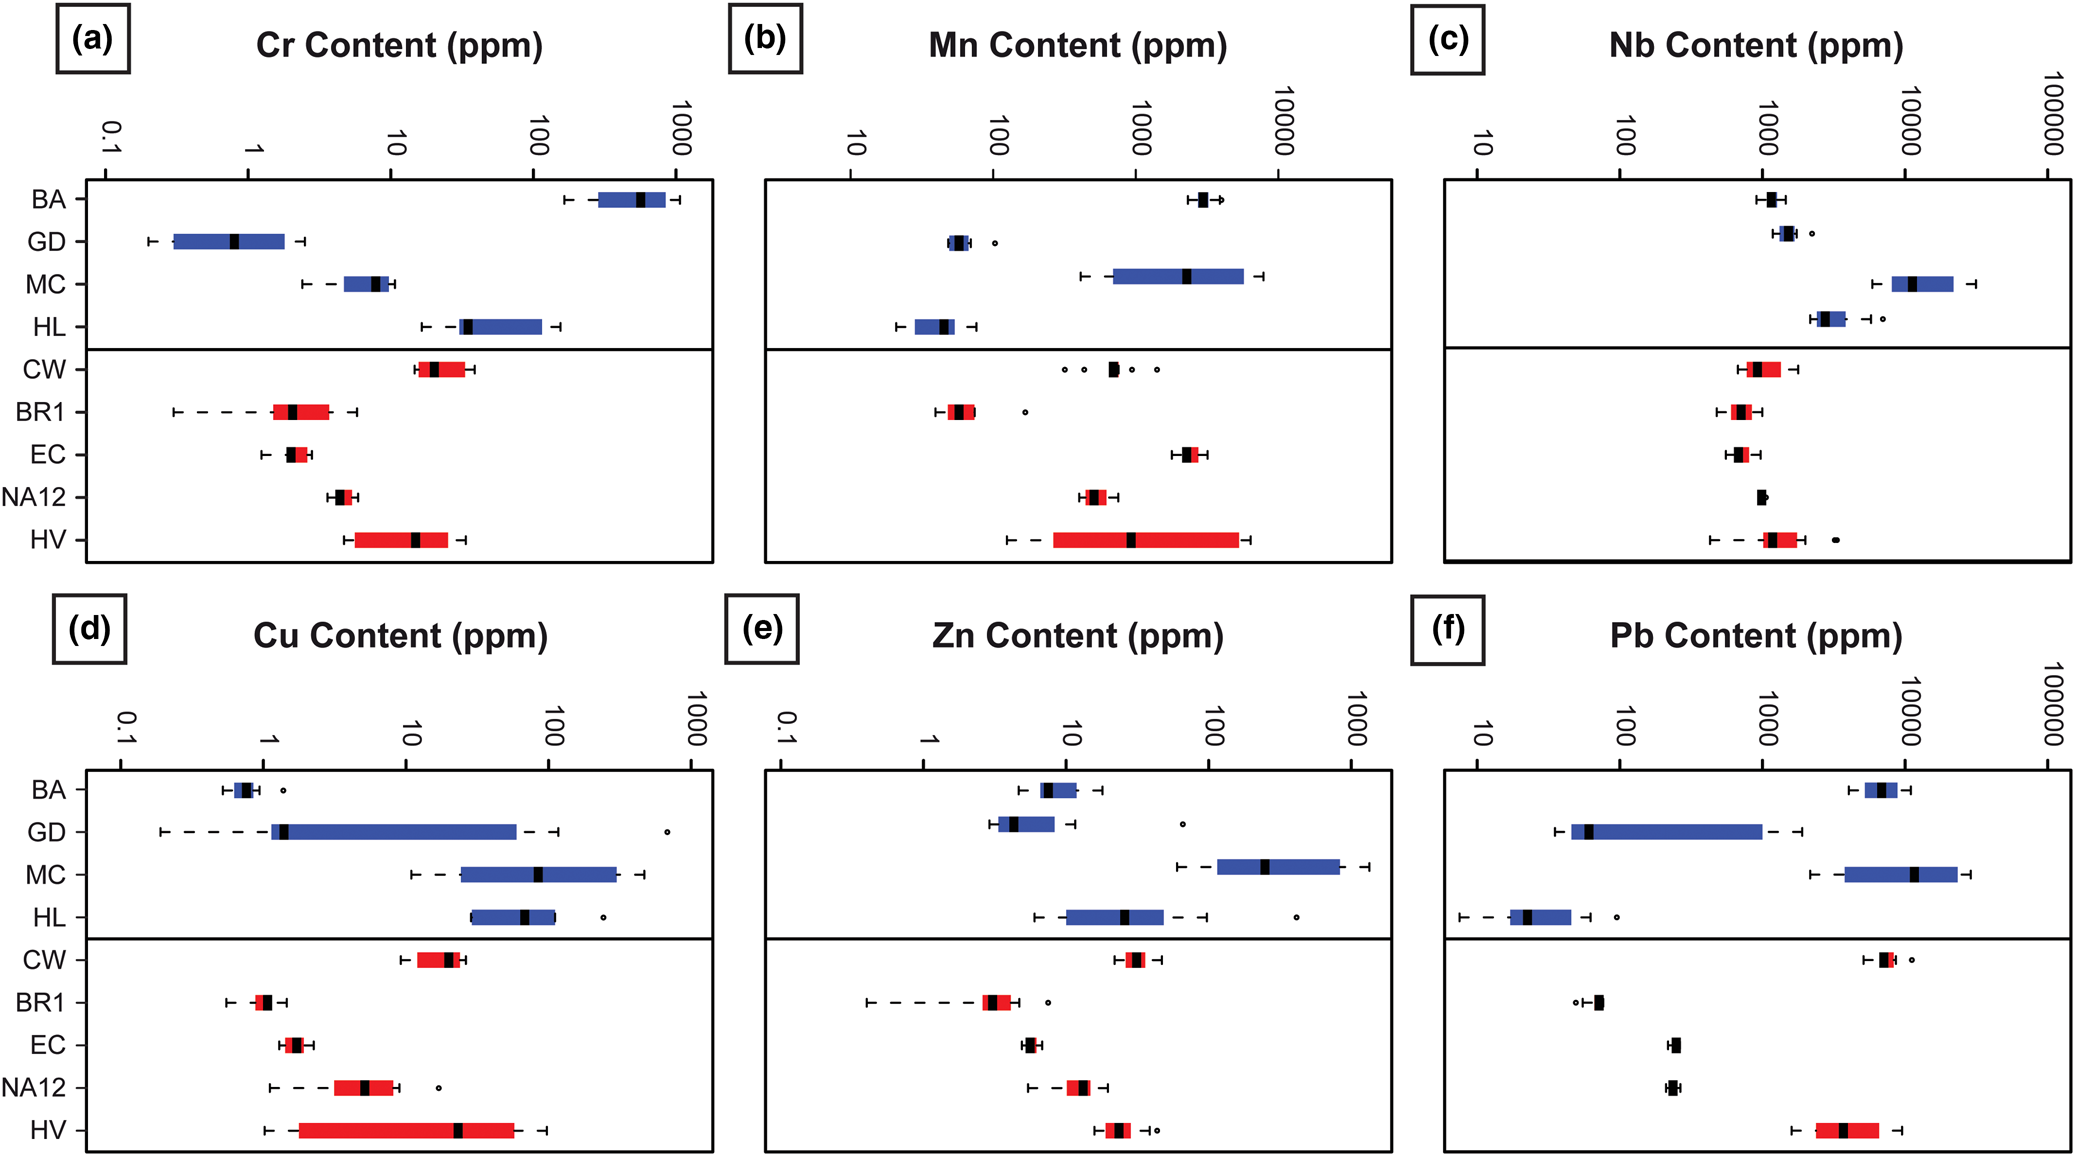
The trace-element content may vary by several orders of magnitude depending on samples, sample locality and sample type (Tables 3, 4, Fig. 10). Trace-element concentration may reflect the local geological environment, such as the high chromium content in Bou Azzer that is related to the occurrence of metasomatised ophiolites hosting the deposit (Fig. 10a). In the case of Mn and Nb, no clear signature can be recognised at the scale of deposit type (Fig. 10b–c), although the Mont Chemin sample shows high concentrations in these two elements. For metals like Cu and Zn (Fig. 10d–e), no clear trend can be observed, except local enrichment in Cu and Zn for brannerite from Mont Chemin. The Pb content distribution between samples is very heterogeneous (Fig. 10f): this may either reflect local Pb enrichment as it correlates with high Zn and Cu contents (e.g. Mont Chemin), and/or enrichment due to production of radiogenic lead (as a result of elapsed time since crystallisation). In this latter case, old and high U + Th brannerite like Crocker's Well and Hidden Valley have a Pb content that displays orders of magnitude higher than the youngest brannerite from Lodrino.
Boxplots of trace-element abundance measured by LA-ICP-MS for each brannerite sample for hydrothermal (blue) and pegmatitic (red) genetic types.
Trace-element data (in ppm) from LA–ICP–MS of brannerite from hydrothermal genetic types.
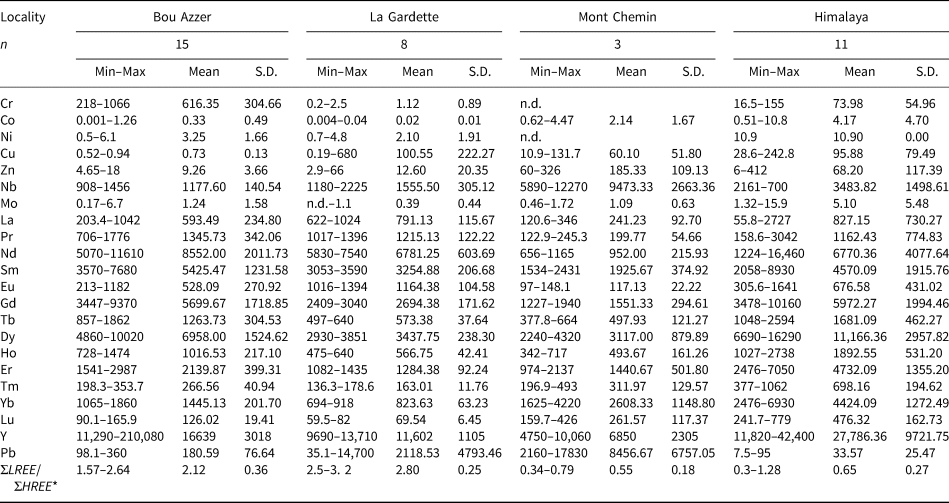
*ΣLREE CN = LaCN+CeCN+PrCN+NdCN+SmCN; ΣHREE CN = ErCN+TmCN+YbCN+LuCN. CN = chondrite-normalised. n.d. = not detected. S.D. = standard deviation.
Trace-element data (in ppm) from LA–ICP-MS of brannerite from magmatic (pegmatitic) genetic types.
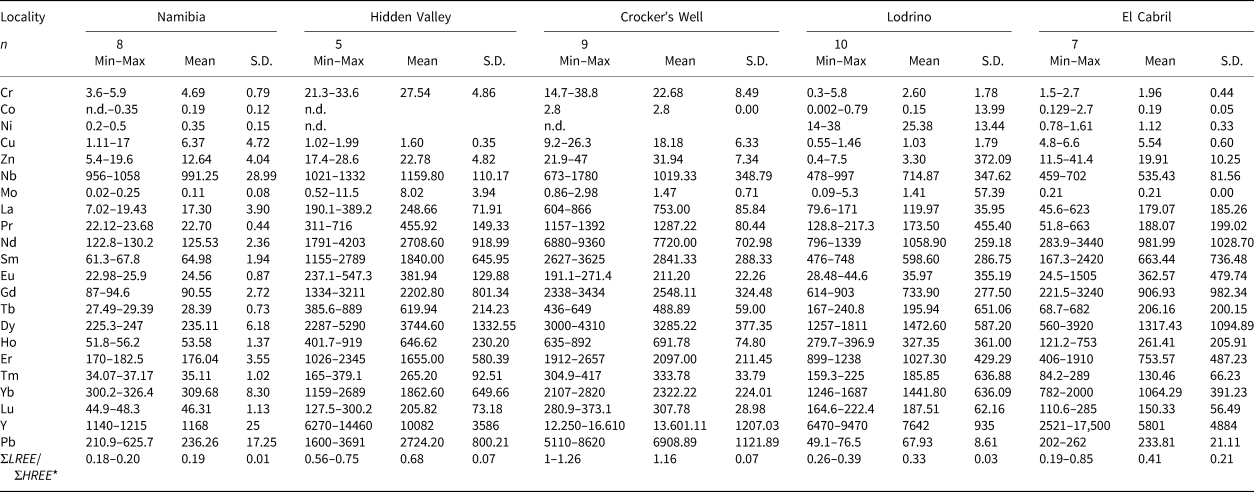
*ΣLREE CN = LaCN+CeCN+PrCN+NdCN+SmCN; ΣHREE CN = ErCN+TmCN+YbCN+LuCN. CN = chondrite-normalised. n.d. = not detected. S.D. = standard deviation.
Principal component analysis of major and minor elements
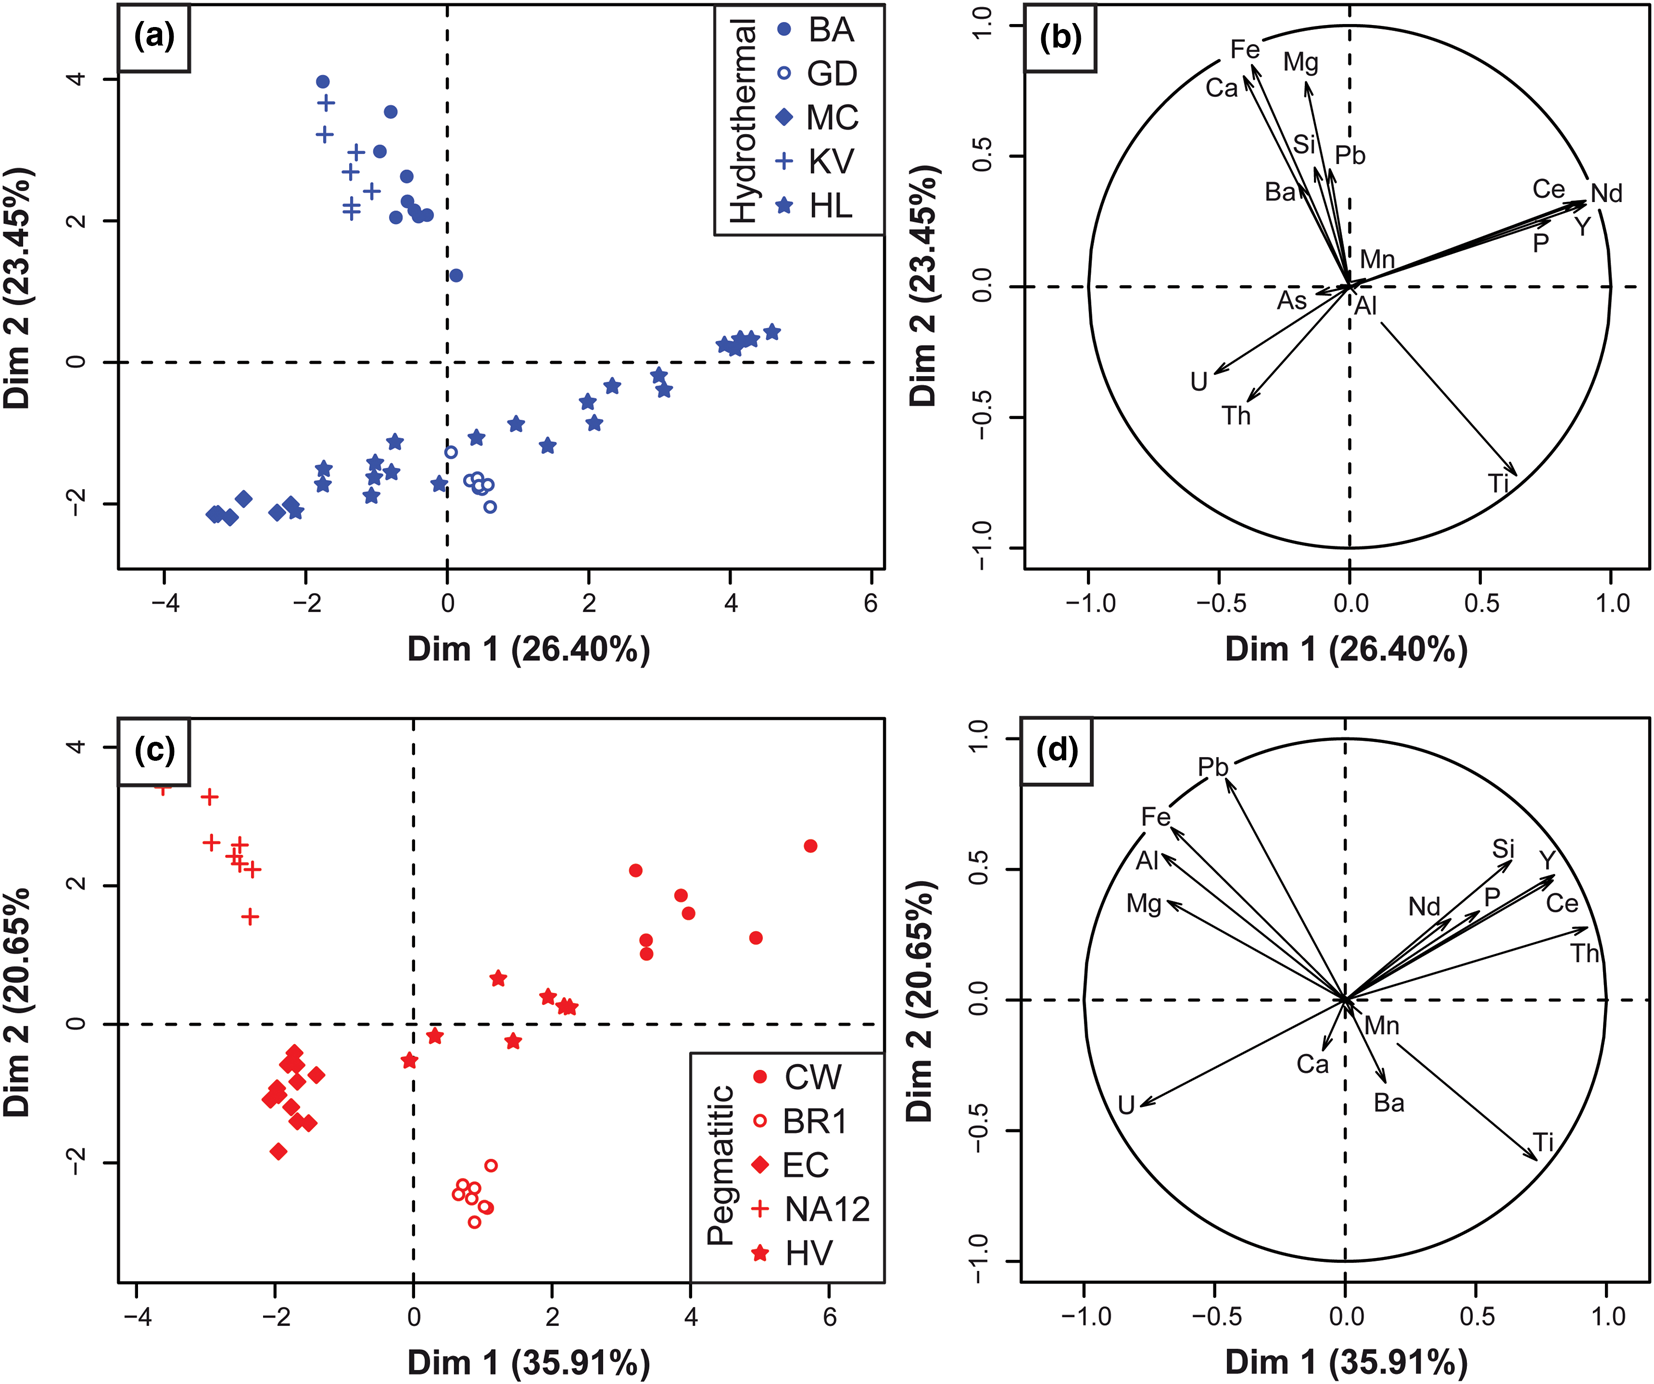
The results of the PCA applied to the EPMA dataset are displayed in Fig. 11, where spot analyses (left –a,c) and elements (right – b,d) are projected on the PC1 vs. PC2 plane. For the hydrothermal brannerite dataset, loading of PC1 and PC2 represent 49.85% of the element content variability (Fig. 11a–b). The PCA plot underlines two main opposed pairs of element clusters. For the first pair mostly loaded by PC1, one group is composed of Ce, P, Y and Nd, while the other group includes U and Th. For the second pair mostly loaded by PC2, a cluster composed of Fe, Mg, Ca and Si is opposed to Ti. Spot representation in the PC1 vs. PC2 plane refers to the sample location. PC1 (mostly loaded by U, Th and REE) is correlated with samples from Mont Chemin and Himalaya, whereas PC2 (loaded by Ti, Ca and Fe) is correlated with samples from Bou Azzer, Kratka Valley and La Gardette.
Principal component analysis of the EPMA dataset of major and minor element contents in brannerite from diverse genetic types (blue – hydrothermal and red – pegmatitic) genetic types. Left frames (a,c): spot analyses (i.e. individuals) plotted on the PC1 (Dim1) vs. PC2 (Dim2) plane, with respective percentage that explains the element content variability. Right frames (b,d): elements (i.e. variables) plotted in the same plane.
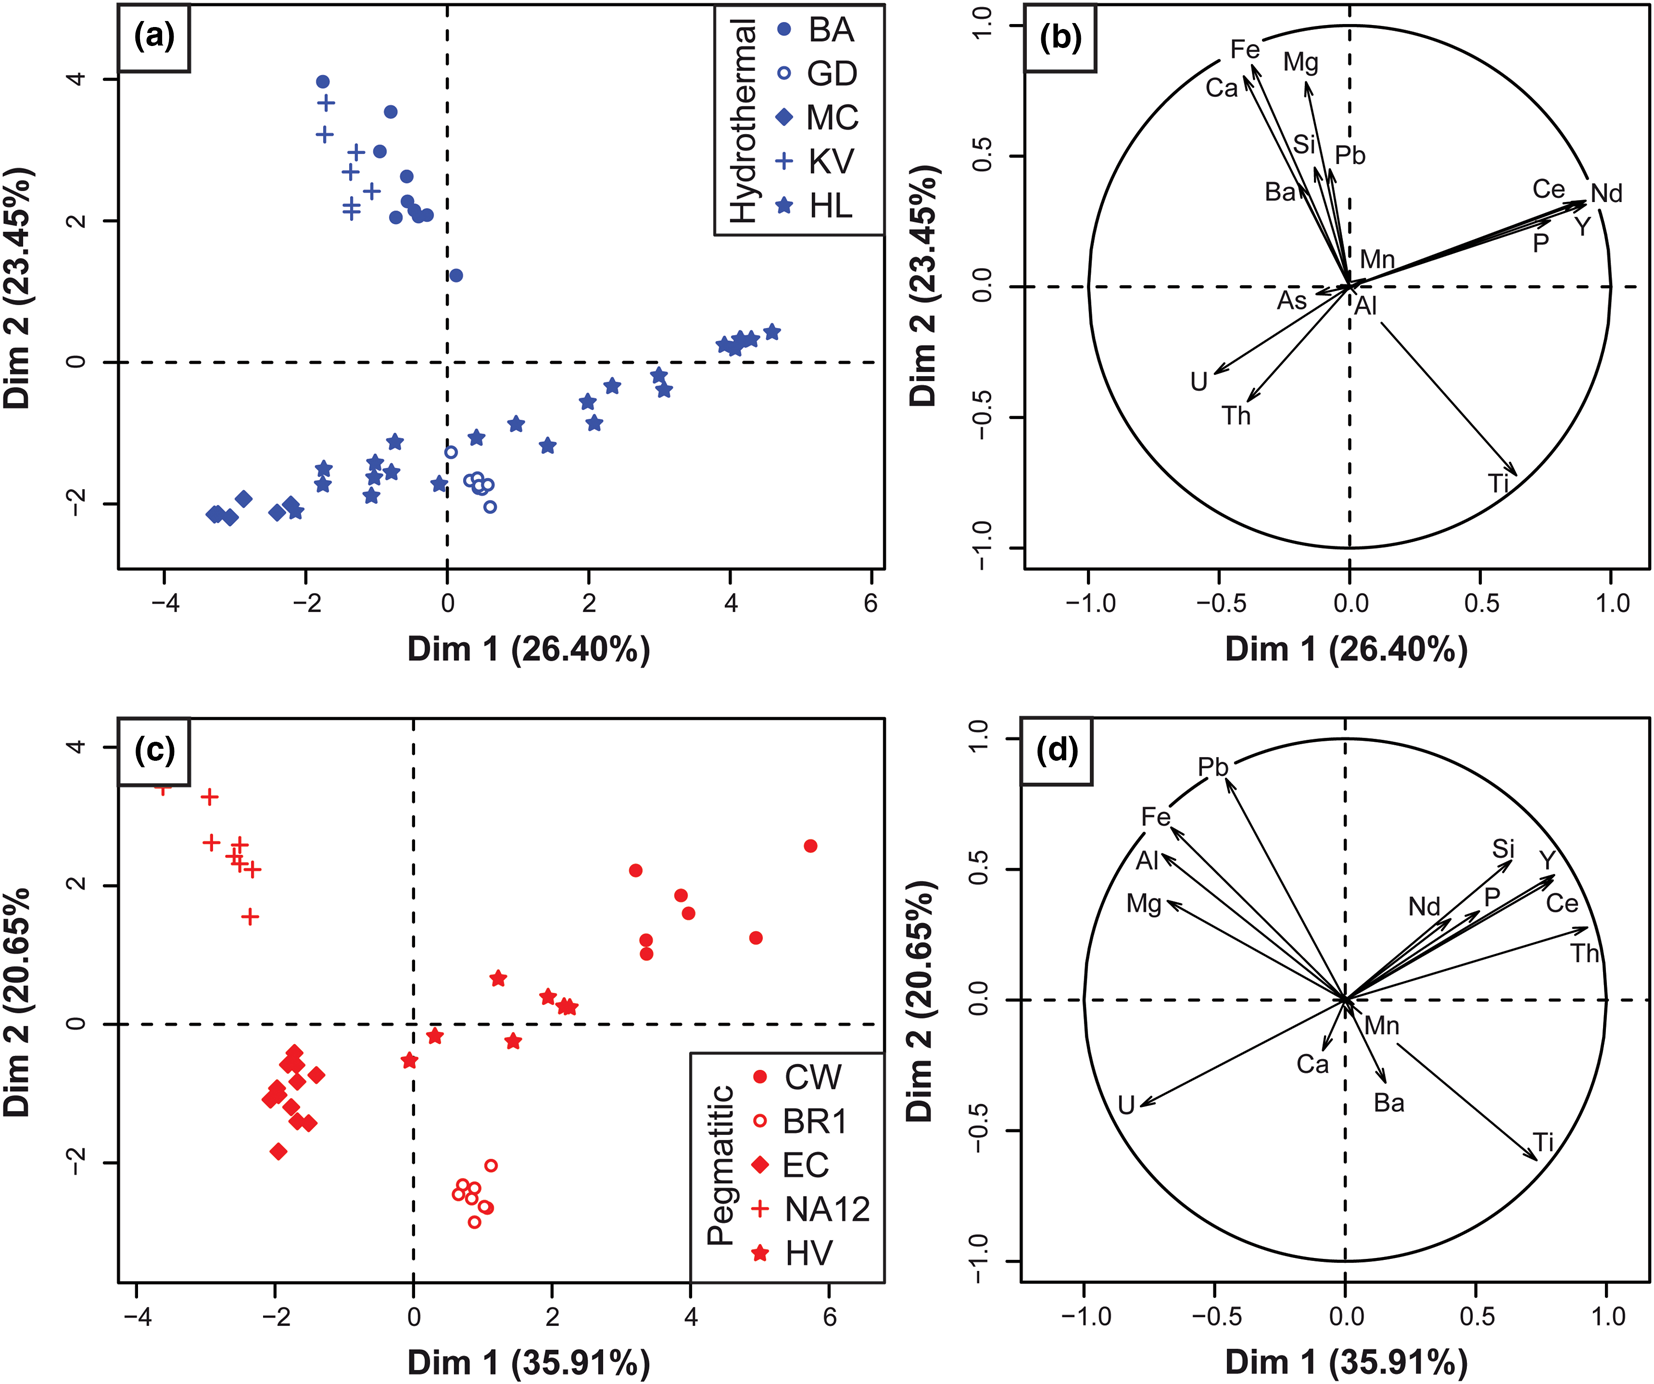
For pegmatite samples, PC1 and PC2 represent 56% of compositional variations (Fig. 11c–d). The PCA also reveals some differences such as Si and Th that are now observed as clusters in association with REE and P. The group of elements opposed to Ti includes Al, but not Ca, which occupies an intermediate position. All individuals are grouped, with no overlap of sample localities (Fig. 11c). As a result, two subgroups can be distinguished. While a first one (PC1 loading) including the Crocker's Well, Hidden Valley, and El Cabril samples correlates with U, Th and REE, a second one (PC2 loading) composed of Namibia and Lodrino samples, correlates with Ti, Al and Fe.
Inferred chemical substitutions in brannerite
The EPMA totals, expressed as wt.% of oxides for each analysis range between 95% and 100%, except for samples from Bou Azzer (mean 92.11 wt.%) and Crocker's Well (mean 92.61 wt.%) samples (Tables 1, 2). This range is consistent with values provided by Charalambous (Reference Charalambous2013) and Macmillan et al. (Reference Macmillan, Cook, Ehrig and Pring2017). Totals lower than 100% can be related to several factors: (1) among REEs, only Ce and Nd were measured by EPMA, and both elements account for only 15 to 50% of the total REE of the sample, depending on the LREE anomaly (see section ‘Trace-elements variation’ below); (2) we assumed that EPMA-measured oxygen only occurs as O2– anions within the brannerite structure. However, U (and Th) α-decays induce radiation damage leading to amorphisation of the brannerite crystals, as confirmed by TEM imaging (Figs 5, 8) and the complete loss of the Raman vibrational mode (Fig. A1). The self-radiation damage (metamictisation), which affects the crystal structure of brannerite can contribute to incorporation of either H2O or OH– (Lumpkin et al., Reference Lumpkin, Leung and Ferenczy2012). These authors reported H2O contents between 0 and 3.7 wt.%, and up to 7.4 wt.% in extensively damaged crystals from Crocker's Well. Other deviations from ideal stoichiometry (AB 2O6) can be achieved through vacancies or excess oxygen (Colella et al., Reference Colella, Lumpkin, Zhang, Buck and Smith2005); (3) calculations of weighted oxide content assumed a unique valence for U (U4+), Fe (Fe3+), Ce (Ce3+) and Pb (Pb2+). While this is probably correct for the three latter elements, direct measurements of uranium chemical states on brannerite samples have demonstrated that higher valence states (5+ and 6+) should be considered (Vance et al., Reference Vance, Watson, Carter, Day, Lumpkin, Hart, Zhang, McGlinn, Stewart and Cassidy2000, Reference Vance, Watson, Carter, Day and Begg2001; Finnie et al., Reference Finnie, Zhang, Vance and Carter2003).
Our dataset confirms the variability of brannerite compositions reported in the literature (Lumpkin et al., Reference Lumpkin, Leung and Ferenczy2012; Macmillan et al., Reference Macmillan, Cook, Ehrig and Pring2017), but in these studies, no distinctions were made on the basis of the geological environment where brannerite crystallised. As shown by the respective locations of variable (elements) and individual (samples) clusters in the PCA plots (Fig. 11), chemical heterogeneity is mostly due to replacement of Ti by Fe, Al and U by other cations, such as Th, Ca, REE and Y with similar ionic radius in 6-fold coordination sites (Shannon, Reference Shannon1976).
Uranium substitutions in the A site by Th, Ca, REE and Y account for up to 50% of A site occupancy (Tables 1, 2). Substitution between U and Th is straightforward:
 $${\rm U}^{{\rm 4+\ }}{\rm}={\rm T}{\rm h}^{{\rm 4+\ }}$$
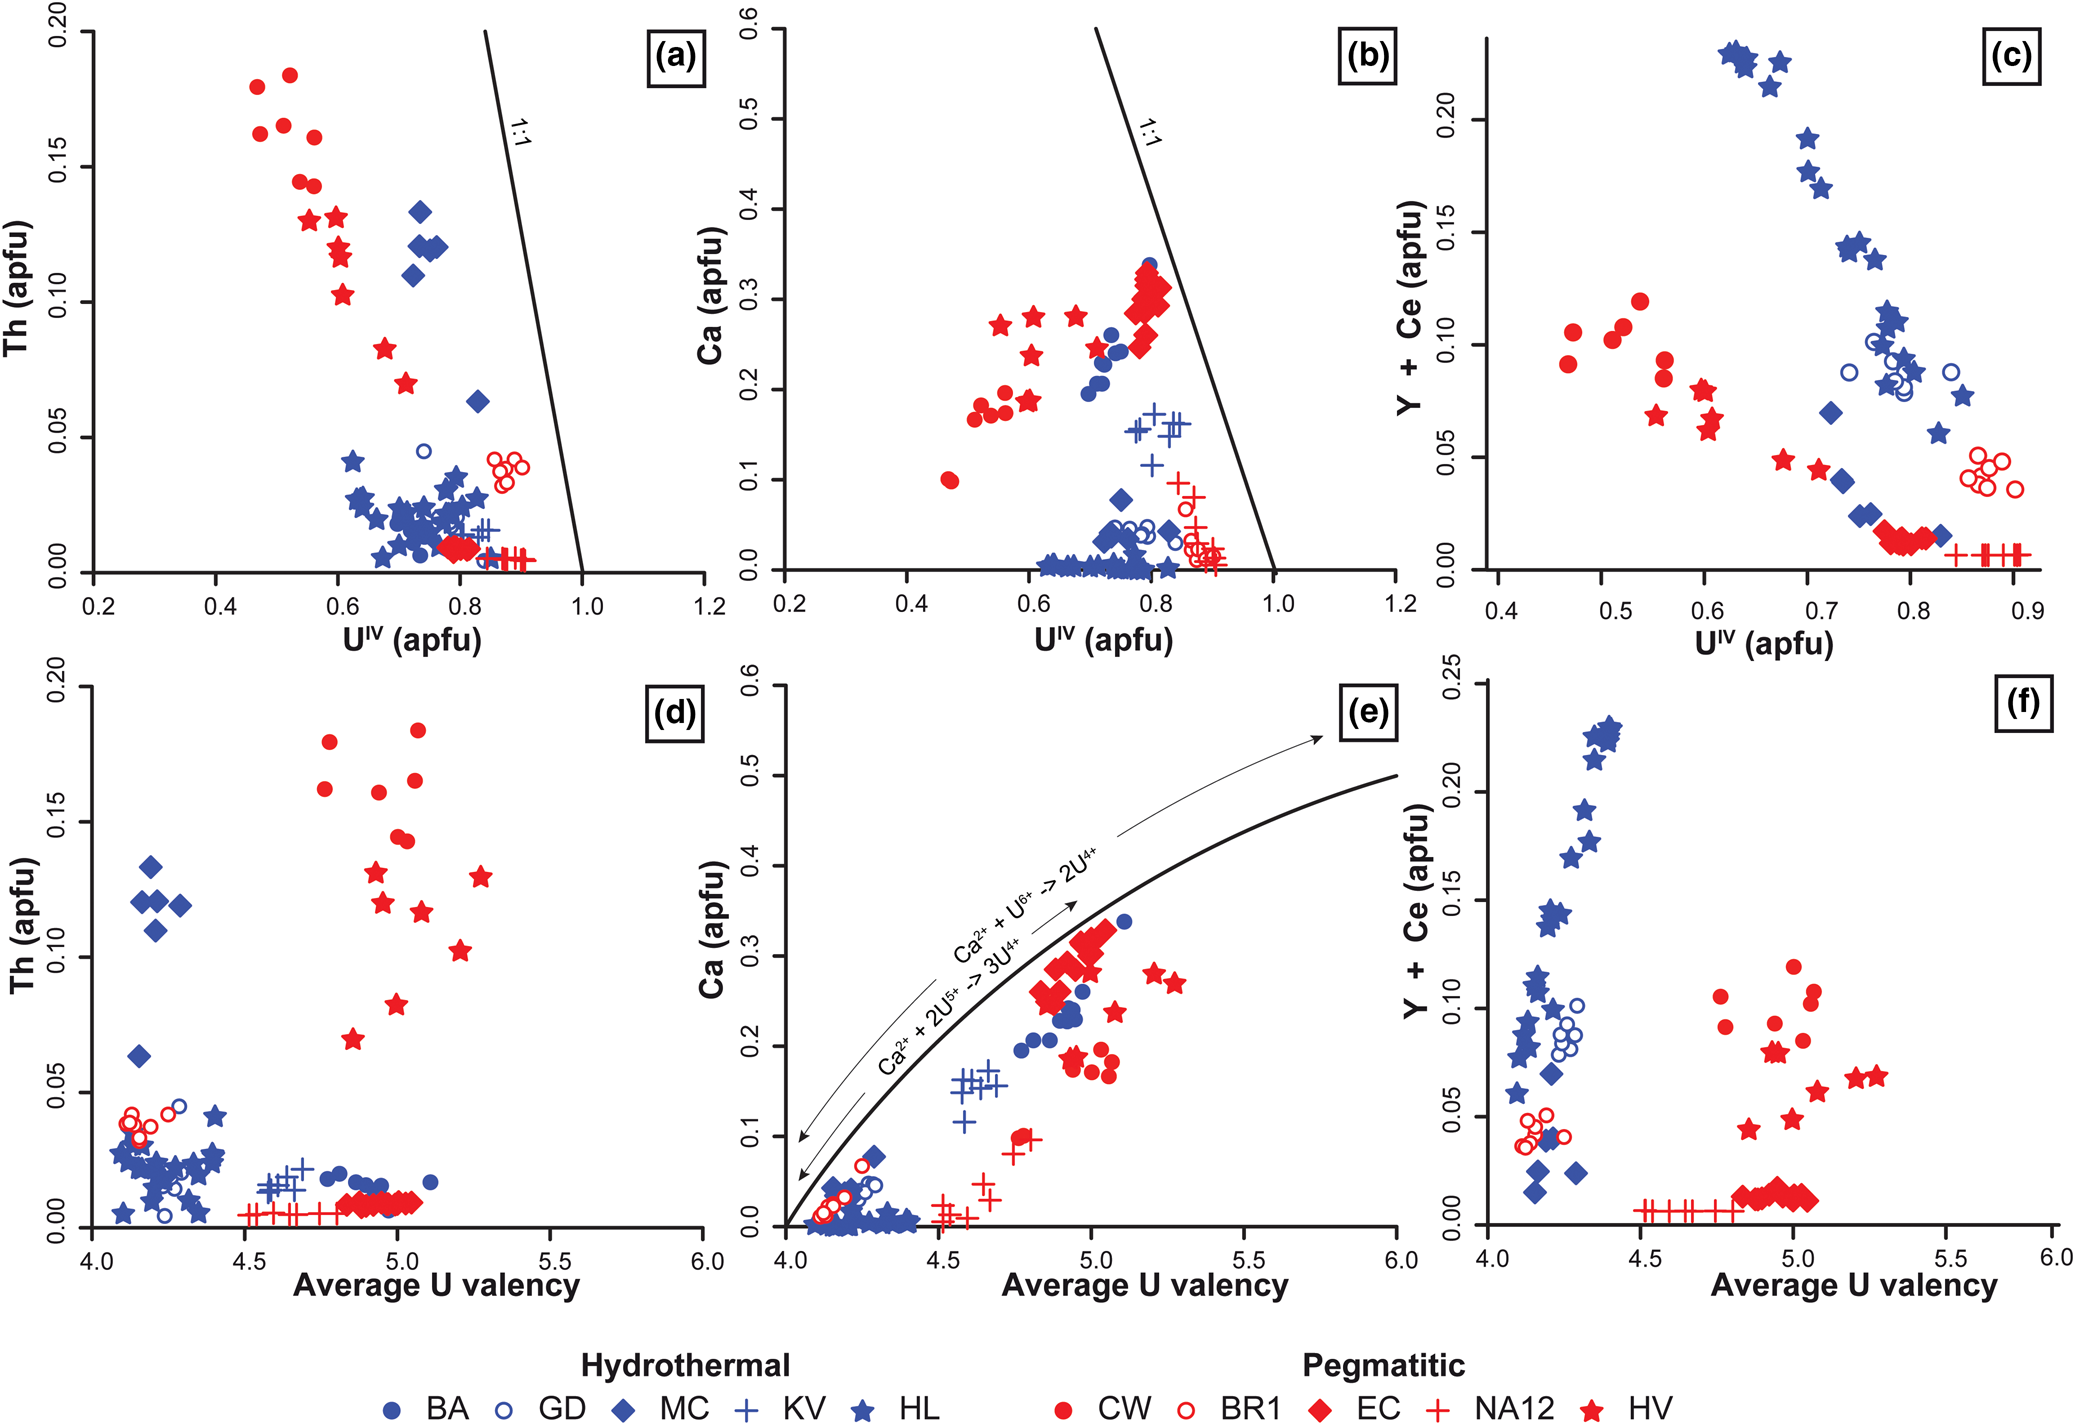
But this substitution is important only in brannerites from Mont Chemin, Hidden Valley and Crocker's Well (Fig. 12a–b). For other cations (Ca, REE and Y), coupled substitutions must be considered to account for their incorporation (Lumpkin et al., Reference Lumpkin, Leung and Ferenczy2012). The Ca content in the A site is always associated with higher calculated average U valences (Fig. 12c), which might reflect the following substitutions.
 $$ 2{\rm U}^{{\rm 4+\ }}{\rm}={\rm C}{\rm a}^{{\rm 2 +\ }}{\rm}+ {\rm U}^{{\rm 6 +\ }}$$
 $$ 3{\rm U}^{{\rm 4 +\ }}{\rm}={\rm C}{\rm a}^{{\rm 2 +\ }}{\rm}+ 2{\rm U}^{{\rm 5 +\ }}$$
Binary diagrams of selected A-site cations vs. calculated U4+ content (a–c) and average U valence (d–f) of brannerite in atoms per formula unit (apfu). Details for calculation of U4+ content and average U valence are provided in the ‘Material and methods’ section, following Colella et al. (Reference Colella, Lumpkin, Zhang, Buck and Smith2005). As only Y and Ce were measured by EPMA, it is not possible to draw a trend curve for substitution 4.
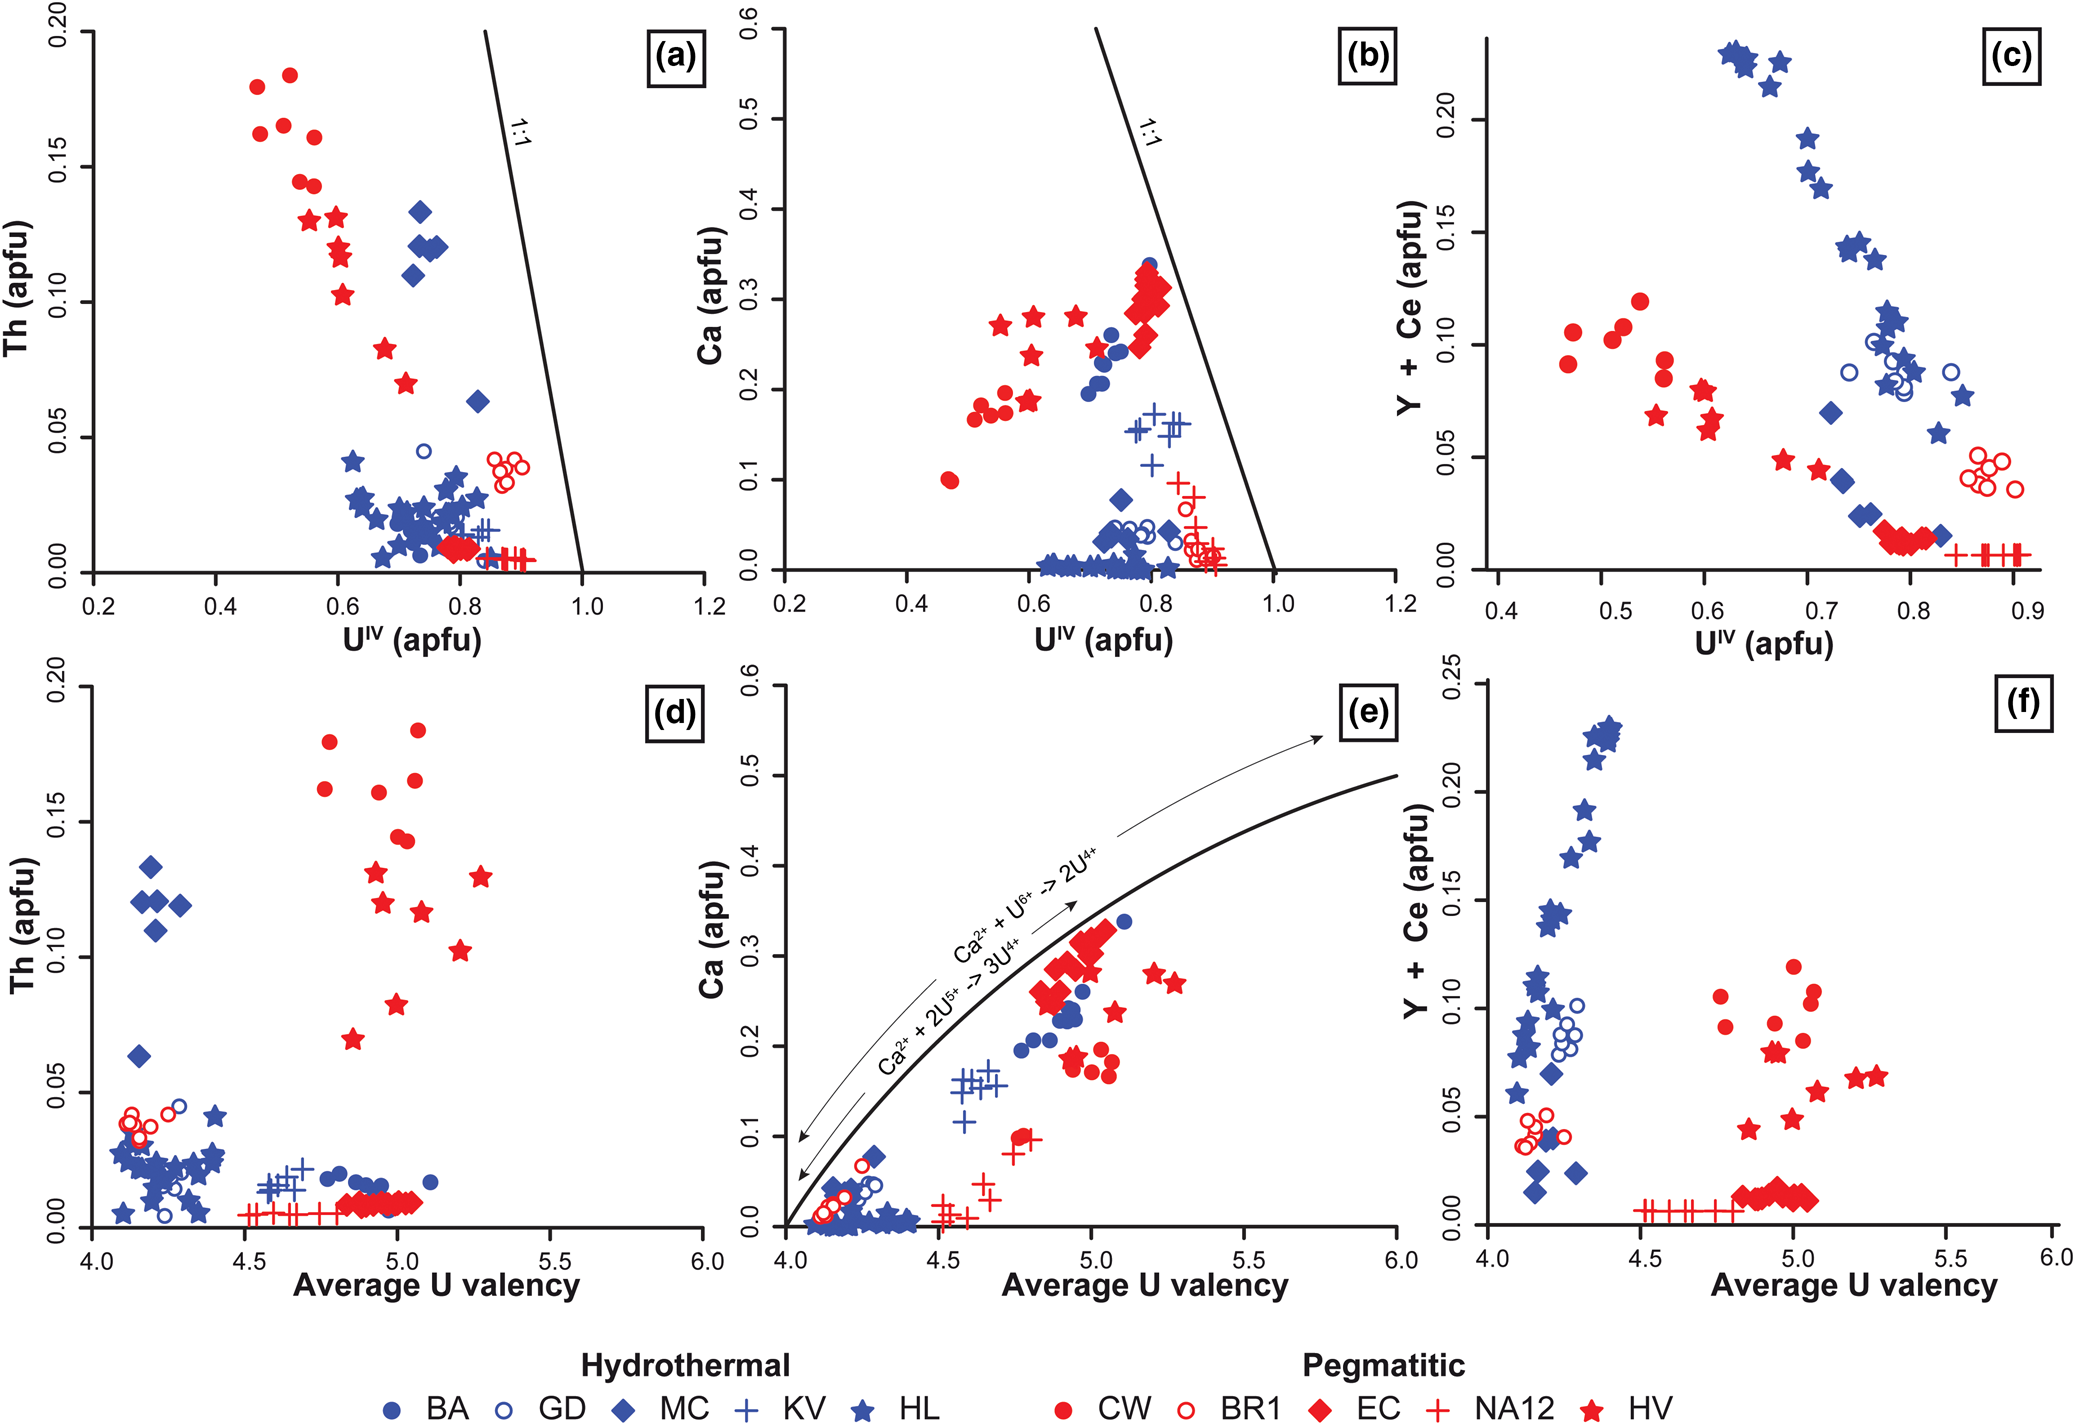
While the presence of U6+ is commonly observed in U minerals formed under oxidising conditions, the presence of U5+ was presumed in the Ca-rich brannerite from El Cabril (Vance et al., Reference Vance, Watson, Carter, Day and Begg2001). René and Dolníček (Reference René and Dolníček2017) also proposed these substitutions to explain the high Ca content of brannerite from the Bohemian Massif.
PCA analysis shows an excellent correlation between P and Y + REE (Fig. 11) suggesting that phosphorus could also be involved in the substitution of U4+ in the A site via the substitution:
 $$ 2{\rm U}^{{\rm 4+\ }}{\rm}= \lpar {{\rm Y\comma \;}\,REE} \rpar ^{{\rm 3+\ }}{\rm}+ {\rm P}^{{\rm 5 +\ }}$$
Although the ionic radius of P5+ (0.38 Å) is very different from that of U4+(0.89 Å), the partial destruction of the crystal structure of brannerite through metamictisation may have favoured the incorporation of P into the octahedral coordination A site (Shannon, Reference Shannon1976). In our case, the REE + Y contents (up to 5 × 10⁴ ppm) cannot be counterbalanced via substitution 4, because of low average P contents (102 ppm). The incorporation of REE and Y in the A site is also made possible by substituting and oxidising U4+ into U5+ through the substitution:
 $$ 2{\rm U}^{{\rm 4 +\ }} = \lpar {{\rm Y}\comma \;\,REE} \rpar ^{3 + } + {\rm U}^{{\rm 5 +\ }}$$
Figure 12c–f shows that hydrothermal brannerites from La Gardette and Himalaya are characterised by a clear relationship between Y + Ce and U4+ or average U valence consistent with the substitution vector of equation 5. Brannerites from pegmatites also show a correlation between U4+ and Y + Ce apfu, but with a different slope. This difference can be due to either unanalysed REE (and fractionation between the REE) or a different substitution mechanism. This relationship between Y + REE substitution in the A site and the genetic type has also been reported in Olympic Dam brannerite, which belongs to different generations (Macmillan et al., Reference Macmillan, Cook, Ehrig and Pring2017).
Composition variability of brannerite is also due to replacement of Ti by different cations up to a maximum of 25% of the B site occupancy. PCA analysis of Fig. 11 shows that Ti and Fe3+ +/– Al3+ are correlated in both hydrothermal and pegmatitic brannerite. In the pegmatitic brannerite, substitution of Ti by these tetravalent cations induces a charge deficit on the B site that could be compensated by higher valences of U on the A site, through coupled substitutions such as:
 $$\lpar {{\rm Fe\comma \;\ Al}} \rpar ^{{\rm 3+\ }}{\rm}+ {\rm U}^{{\rm 5 +\ }}{\rm}={\rm T}{\rm i}^{{\rm 4 +\ }}{\rm}+ {\rm U}^{{\rm 4 +\ }}$$
 $$ 2\lpar {{\rm Fe\comma \;\ Al}} \rpar ^{{\rm 3 +\ }}{\rm}+ {\rm U}^{{\rm 6+\ }}{\rm}={\rm T}{\rm i}^{{\rm 4 +\ }}{\rm}+ 2{\rm U}^{{\rm 4 +\ }}$$
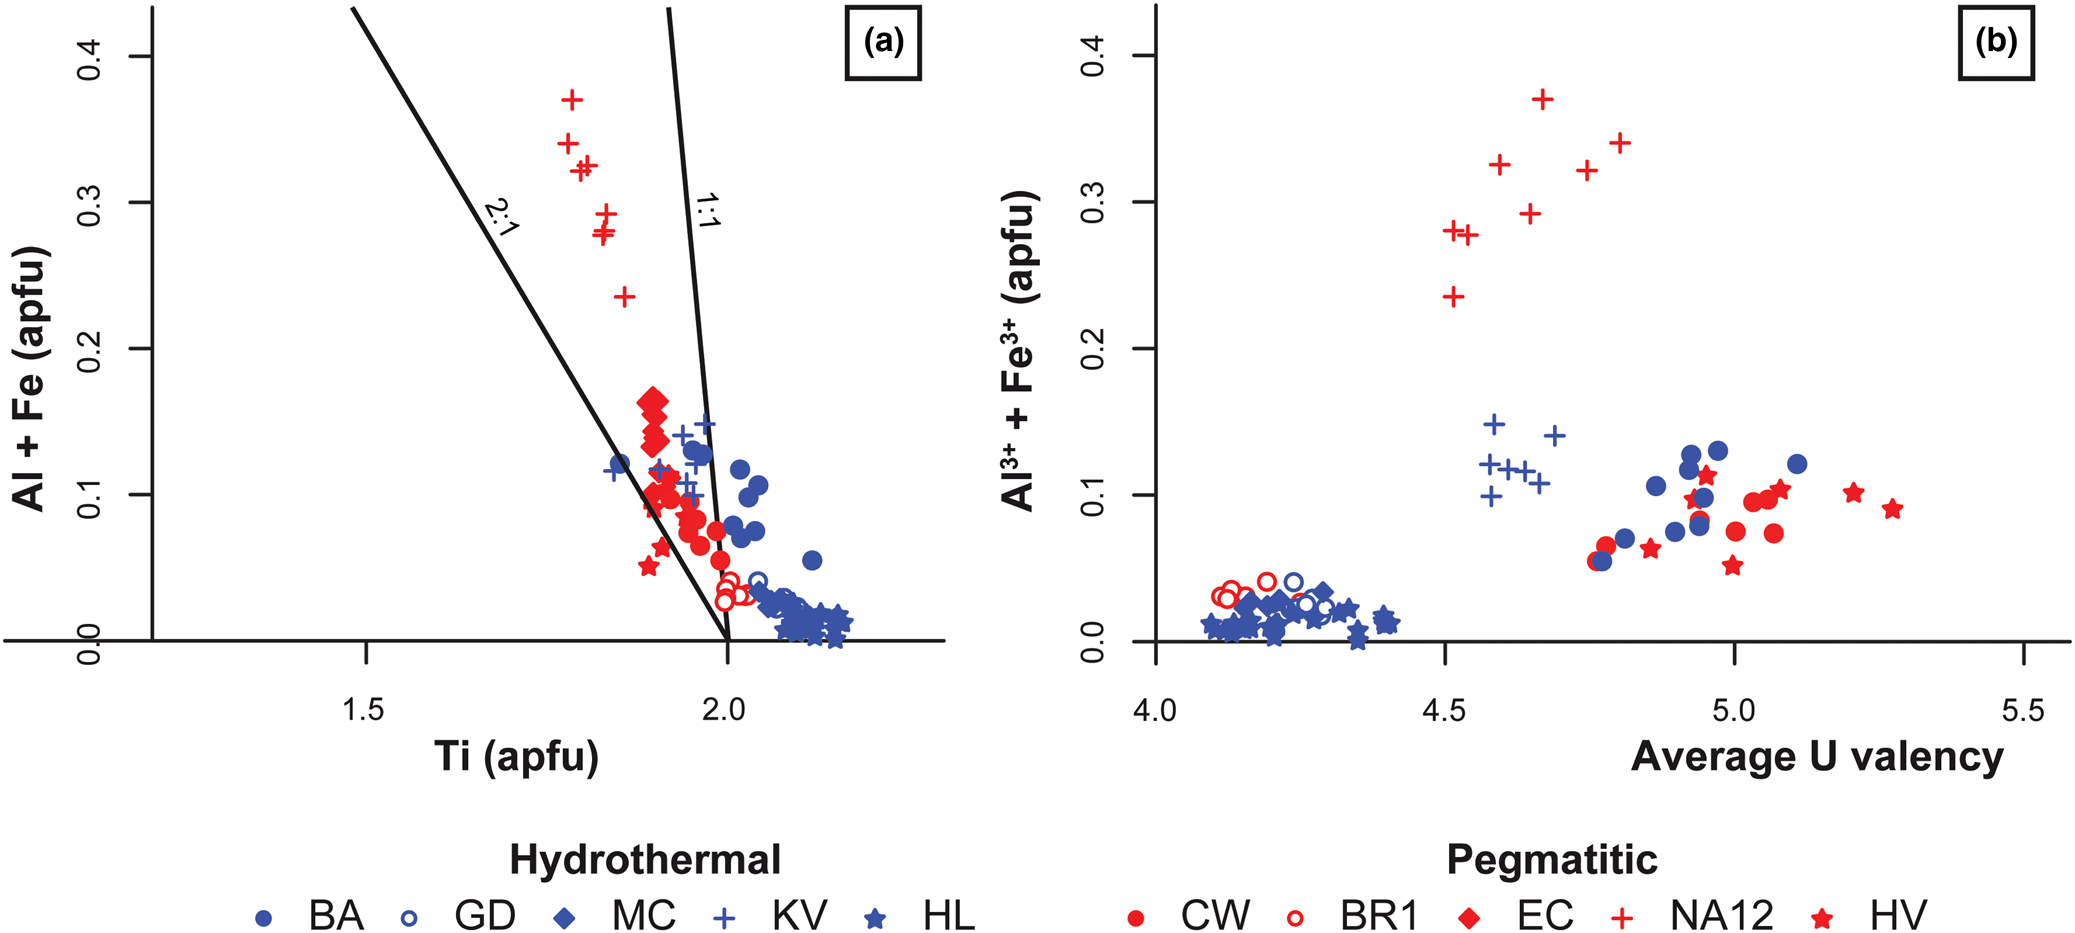
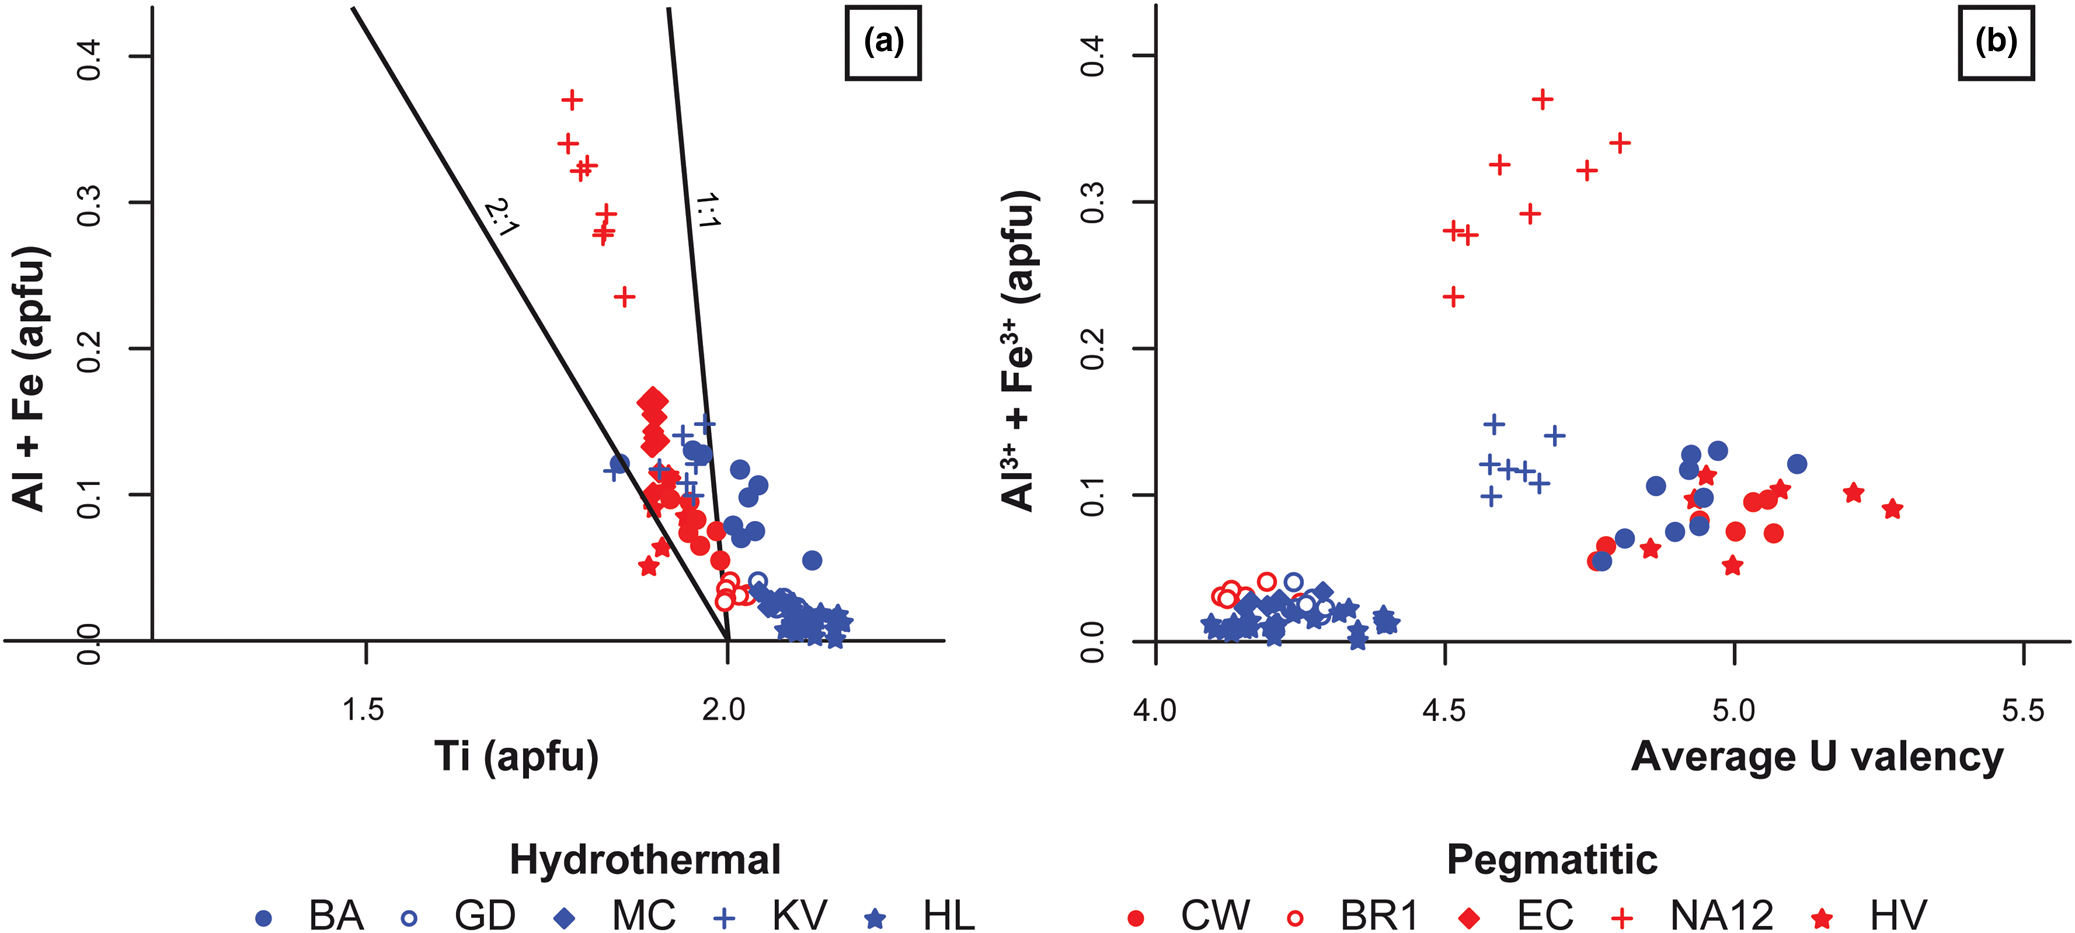
Figure 10 shows a correlation between Ti or U average valence with Fe3+ + Al3+, which is consistent with substitutions 6 and 7. The respective contribution of substitutions 2, 3, 5, 6 and 7 in the A and B sites to the average valence is difficult to ascertain, except for pegmatitic brannerite from Namibia (Fig. 13). In this case, the limited amount of Ca, REE and Y (<0.1 apfu) (Fig. 12) cannot account for the high average valence (4.63) of U that is better explained by high Fe and Al content (0.25 to 0.4 apfu; Fig. 13). Coupled substitutions involving Ti or other cations of the B site, as proposed in Lumpkin et al. (Reference Lumpkin, Leung and Ferenczy2012) and Macmillan et al. (Reference Macmillan, Cook, Ehrig and Pring2017) could also explain the absence of direct correlation between U and Ca in the PCA plots for hydrothermal and pegmatitic brannerite (Fig. 11).
Binary diagram of selected B-site cations vs. (a) Ti content and (b) average U valence of brannerite in apfu.
Lumpkin et al. (Reference Lumpkin, Leung and Ferenczy2012) proposed an alternative substitution to compensate the charge deficit induced by the replacement of Ti by Fe and Al:
 $$\lpar {{\rm Fe\comma \;\ Al}} \rpar ^{{\rm 3 +\ }}{\rm}+{\rm N}{\rm b}^{{\rm 5+\ }}{\rm \ndash \gt 2T}{\rm i}^{{\rm 4+\ }}$$
In our case, there is no positive correlation between Fe, Al and Nb. Hydrothermal brannerite that is Fe-Al poor is rich in Nb, whereas pegmatitic brannerite generally presents higher Al and Fe contents and is depleted in Nb (Figs 9c–d, 10c). MacMillan et al. (Reference Macmillan, Cook, Ehrig and Pring2017) also suggests that missing charges could be due to the removal of OH– anions through the substitution:
 $${\rm T}{\rm i}^{{\rm 4+\ }}{\rm}+{\rm O}{\rm H}^{\rm \ndash }{\rm}= \lpar {{\rm F}{\rm e}^{{\rm 3+}}{\rm \comma \;\ A}{\rm l}^{{\rm 3+ }}} \rpar {\rm \comma \;}$$
as appreciable water contents (up to 7.4 wt.%) have been measured in natural brannerite (Lumpkin et al., Reference Lumpkin, Leung and Ferenczy2012).
For hydrothermal brannerite, substitutions on the B site are limited and in many cases the calculated Ti amount exceeds 2 apfu (Fig. 13a). Such deviation was also reported in magmato-hydrothermal brannerites from Olympic Dam (Macmillan et al., Reference Macmillan, Cook, Ehrig and Pring2017). Hypotheses to explain these data are: (1) coupled substitutions across the two sites; (2) nanometric inclusions of Ti oxides intergrown with brannerite, similar to macroscopic structures in magmatic and metamorphic brannerite (Figs 2, 4); (3) vacancies or other substituents at the anion sites, causing overestimation of the cation content in the structural formula calculation; and (4) alteration processes leading to a partial removal of U, without changing the crystal texture at the microscale. The Raman spectra obtained from La Gardette and Namibia brannerites show a very small and broad band at ~640 cm–1 and the characteristic Eg mode at 151 cm–1 (Fig. A1). Such features are interpreted as a spectroscopic signature of nanocrystalline anatase, probably blue-shifted with regard to the corresponding mode of its core crystalline counterpart, displaying a significant broadening of its profile (Bonne et al., Reference Bonne, Pronier, Batonneau, Can, Courtois, Royer, Marécot and Duprez2010). This is the result of the metamictisation of brannerite crystals, even in the unaltered domains.
As noted by Lumpkin et al. (Reference Lumpkin, Leung and Ferenczy2012) and Macmillan et al. (Reference Macmillan, Cook, Ehrig and Pring2017), there is almost no correlation between Ti and Si abundances, as occupancy of octahedral sites by Si is impossible in low-pressure oxide compounds (Mysen and Richet, Reference Mysen and Richet2005). PCA plots display very heterogeneous trends for Si relative to other elements (Fig. 11). While for hydrothermal brannerite we could note a correlation between Si and Ti, for pegmatitic samples we instead observe Si opposed to U along the PC1 (Fig. 11). This suggests either an addition of Si within A sites, or the presence of nanoscale U-bearing silicates such as coffinite. TEM-EDS chemical mapping revealed that parts of brannerite altered domains are enriched in Si and depleted in U (Fig. 8a–e). From the SAED patterns taken in this altered domain (Fig. 8a), apart from diffuse rings corresponding to amorphous material, additional diffraction spots with equivalent d spacings of 3.45 Å and 1.87 Å could correspond to the (200) and (321) planes of coffinite (3.41 Å and 1.88 Å, respectively from Pointeau et al., Reference Pointeau, Deditius, Miserque, Renock, Becker, Zhang, Clavier, Dacheux, Poinssot and Ewing2009), although those of brannerite (3.50 Å and 1.85 Å) are very close. For comparison, in (Y,REE,U,Th)-(Nb–Ta–Ti) oxide minerals, altered domains were also characterised by Si gain and U loss. This alteration results from fluid–mineral interaction, favoured by fracturing due to radiation damage accumulated in U and Th-rich oxide minerals (Duran et al., Reference Duran, Seydoux-Guillaume, Bingen, Gouy, de Parseval, Ingrin and Guillaume2016). A very similar process probably occurs for brannerite as: (1) all crystals of natural brannerite are metamict (Figs 5, 8, A1); and (2) Si-rich brannerite (e.g. Crocker's Well and Hidden Valley) are characterised by radial fracturing and well-developed altered domains (Fig. 6a–b). Further careful nanometric observations and additional brannerite synthesis in Si-rich environments are necessary to better understand the mechanisms for Si incorporation within brannerite.
Brannerite fingerprints
Major element and substitution
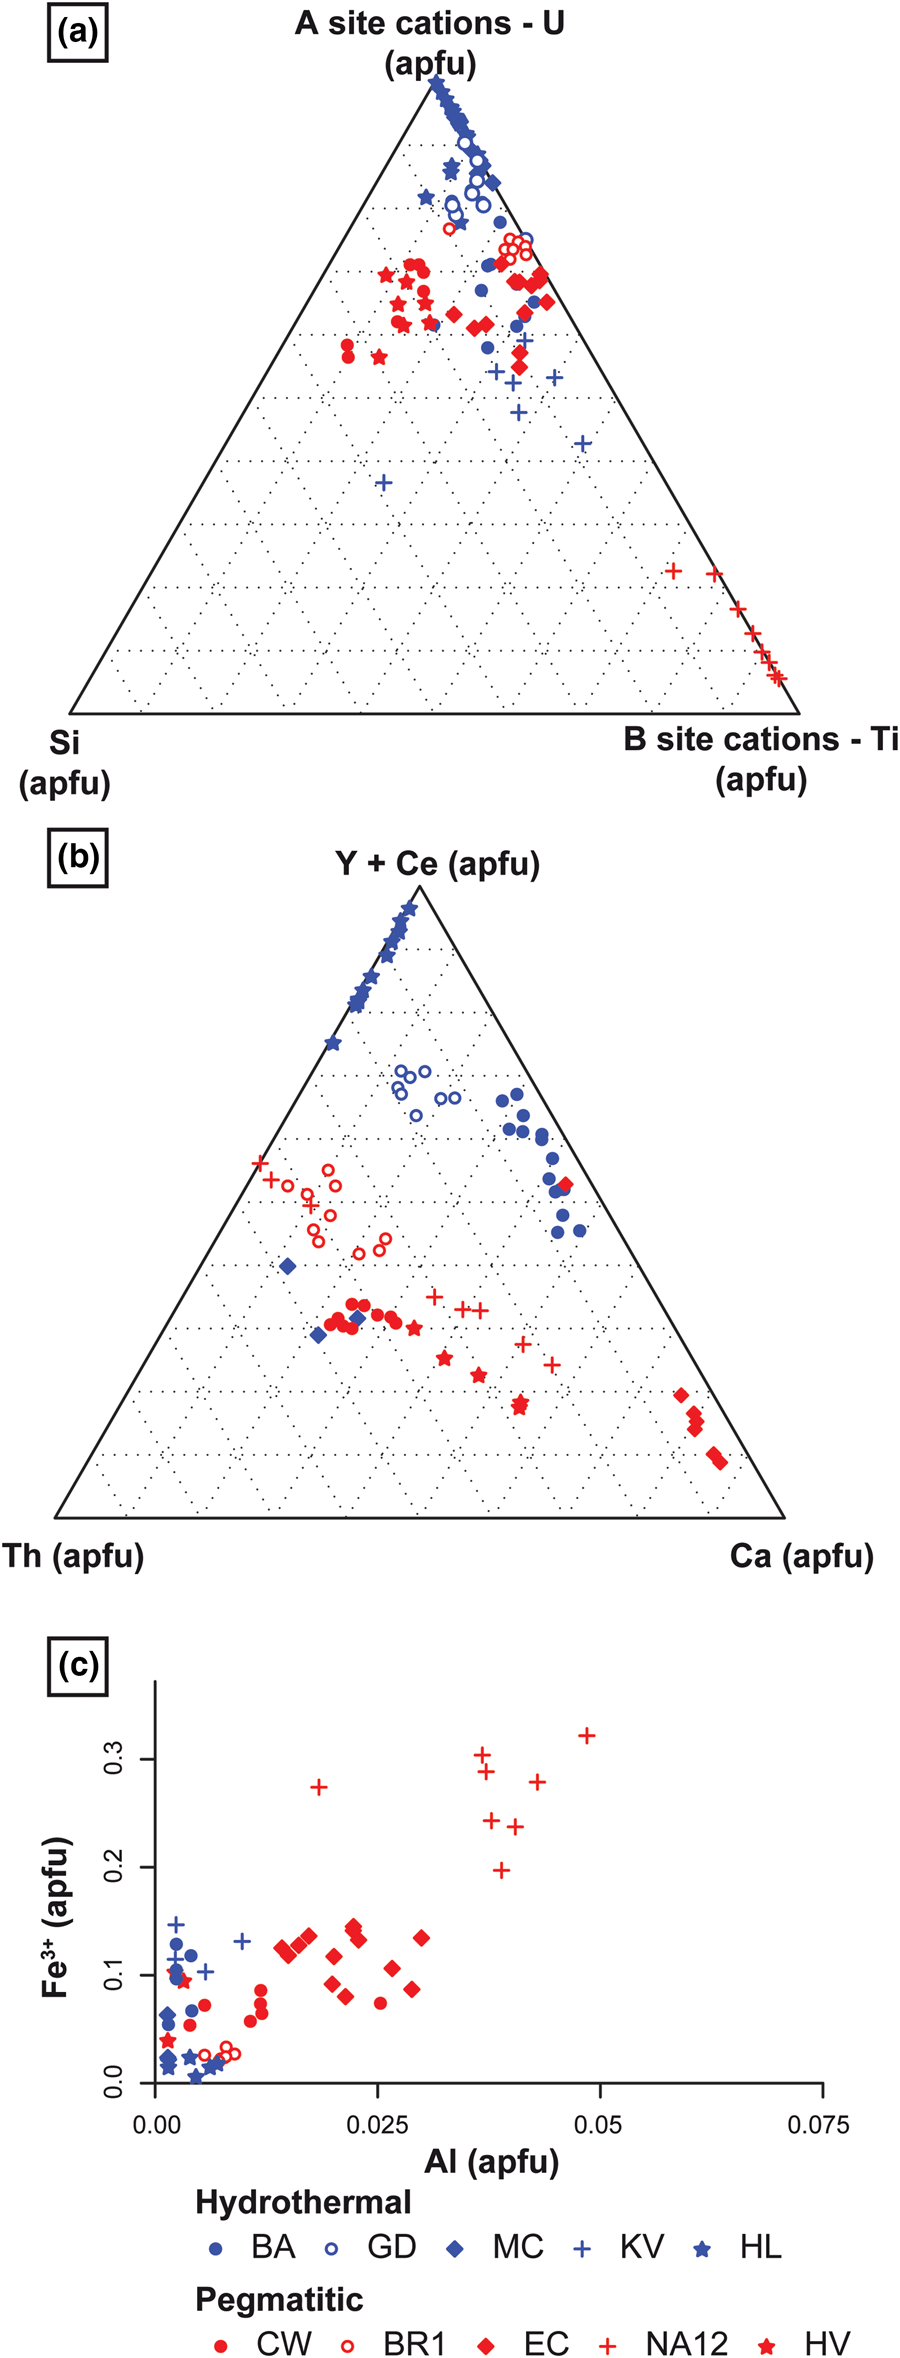
These new data show that each locality and each genetic type of brannerite are characterised by various types and degrees of substitution, either on the A or on the B sites (Fig. 14). Fig. 14a shows that hydrothermal brannerite is mostly characterised by a predominance of A site substitution (90%), while pegmatitic brannerite generally presents a higher proportion (20%) of B site substitution. Pegmatitic brannerite from Namibia represents an extreme case, with a predominance of B site substitution (70 to 90%). The incorporation of Si, whose mechanism is not well understood, seems to increase when both A and B site substitutions are present (Fig. 14a). However, this could also reflect the degree of alteration and mirrors the possible modification of the initial composition of brannerite.
Binary and ternary plots, illustrating the substitution rates at sites A and B and the relative proportions of substituents: (a) ternary plot, including Si abundance and showing discernible substitution type and rate depending on brannerite genetic types; (b) ternary plot showing the relative proportion of each major A-site substituents; and (c) Fe vs. Al content in brannerite, showing various occupancies of the B site (excluding Ti) depending on genetic type and redox conditions.
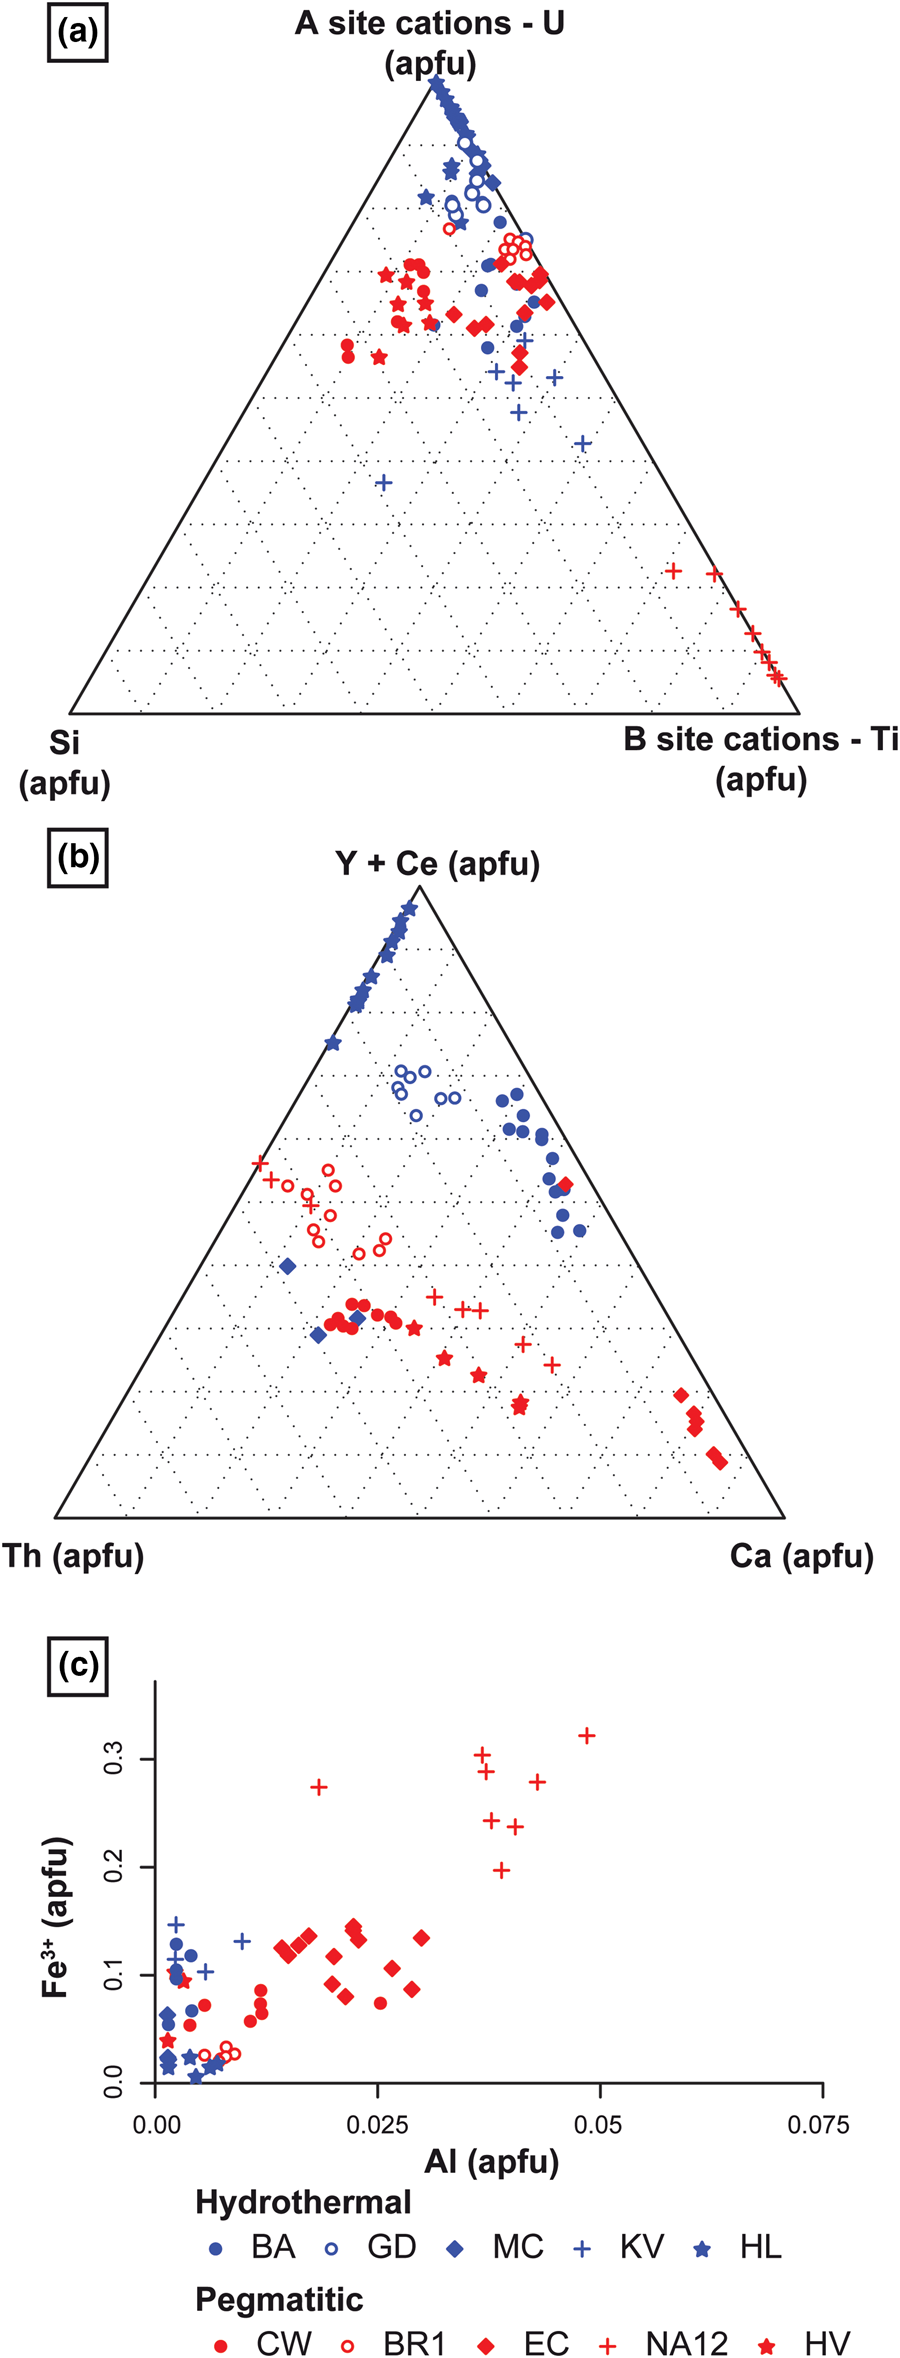
Brannerite populations can also be distinguished based on the cations incorporated in sites A and B via the substitutions described previously. In hydrothermal brannerite, except for Th-rich brannerite from Mont Chemin, A site substitution is mostly characterised by high REE + Y contents, with local enrichment in Ca such as in Bou Azzer (Fig. 14b). For pegmatitic brannerite, the A site is characterised by: (1) an equal distribution of Th and Y + Ce; and (2) various degrees of Ca substitution (Fig. 14b). In uraninite formed under hydrothermal conditions, the Th content is usually negligible as Th is less mobile and Th4+ displays very low solubility (Cuney and Friedrich, Reference Cuney and Friedrich1987). In magmatic environments, the Th content generally increases (e.g. Förster, Reference Förster1999; Frimmel et al., Reference Frimmel, Schedel and Brätz2014), except if the source of radiogenic elements (magma or protolith) is initially poor in Th. In the B site, while only Fe3+ replaces Ti in hydrothermal brannerite, pegmatite brannerites are characterised by the incorporation of both Fe3+ and Al, with an Al/Fe3+ ratio of ~1:6 (Fig. 14c).
Strong variations in composition are also observed at the scale of a given sample or locality, as exemplified by the case of Himalaya. Although morphological differences support the presence of three brannerite generations (Fig. 4e–h), their composition follows the same substitution trends 1 and 5. This suggests a dissolution–reprecipitation process of brannerite without an external chemical contribution. This observation differs from the results reported at Olympic Dam, in which four generations of brannerite are related to distinct substitution mechanisms (Macmillan et al., Reference Macmillan, Cook, Ehrig and Pring2017).
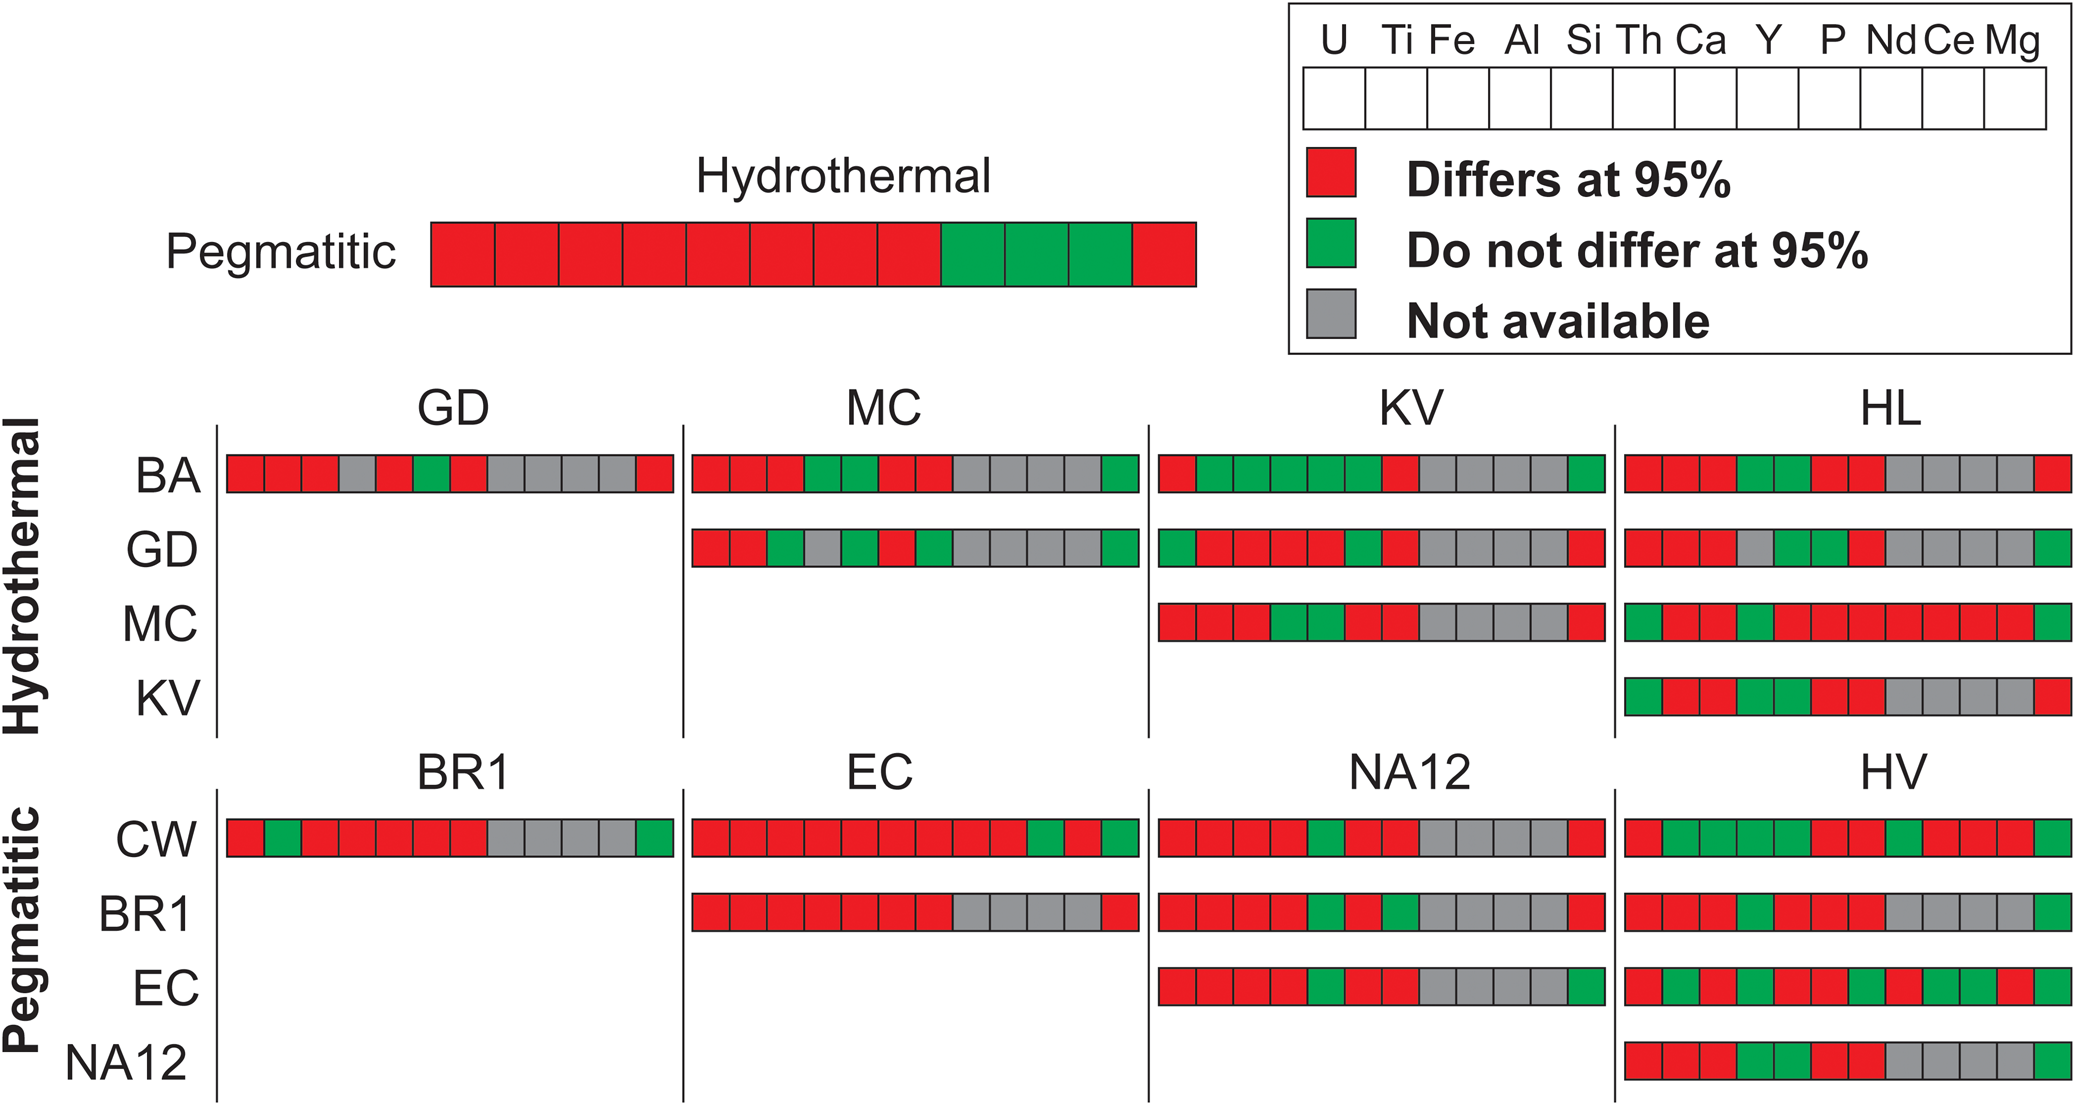
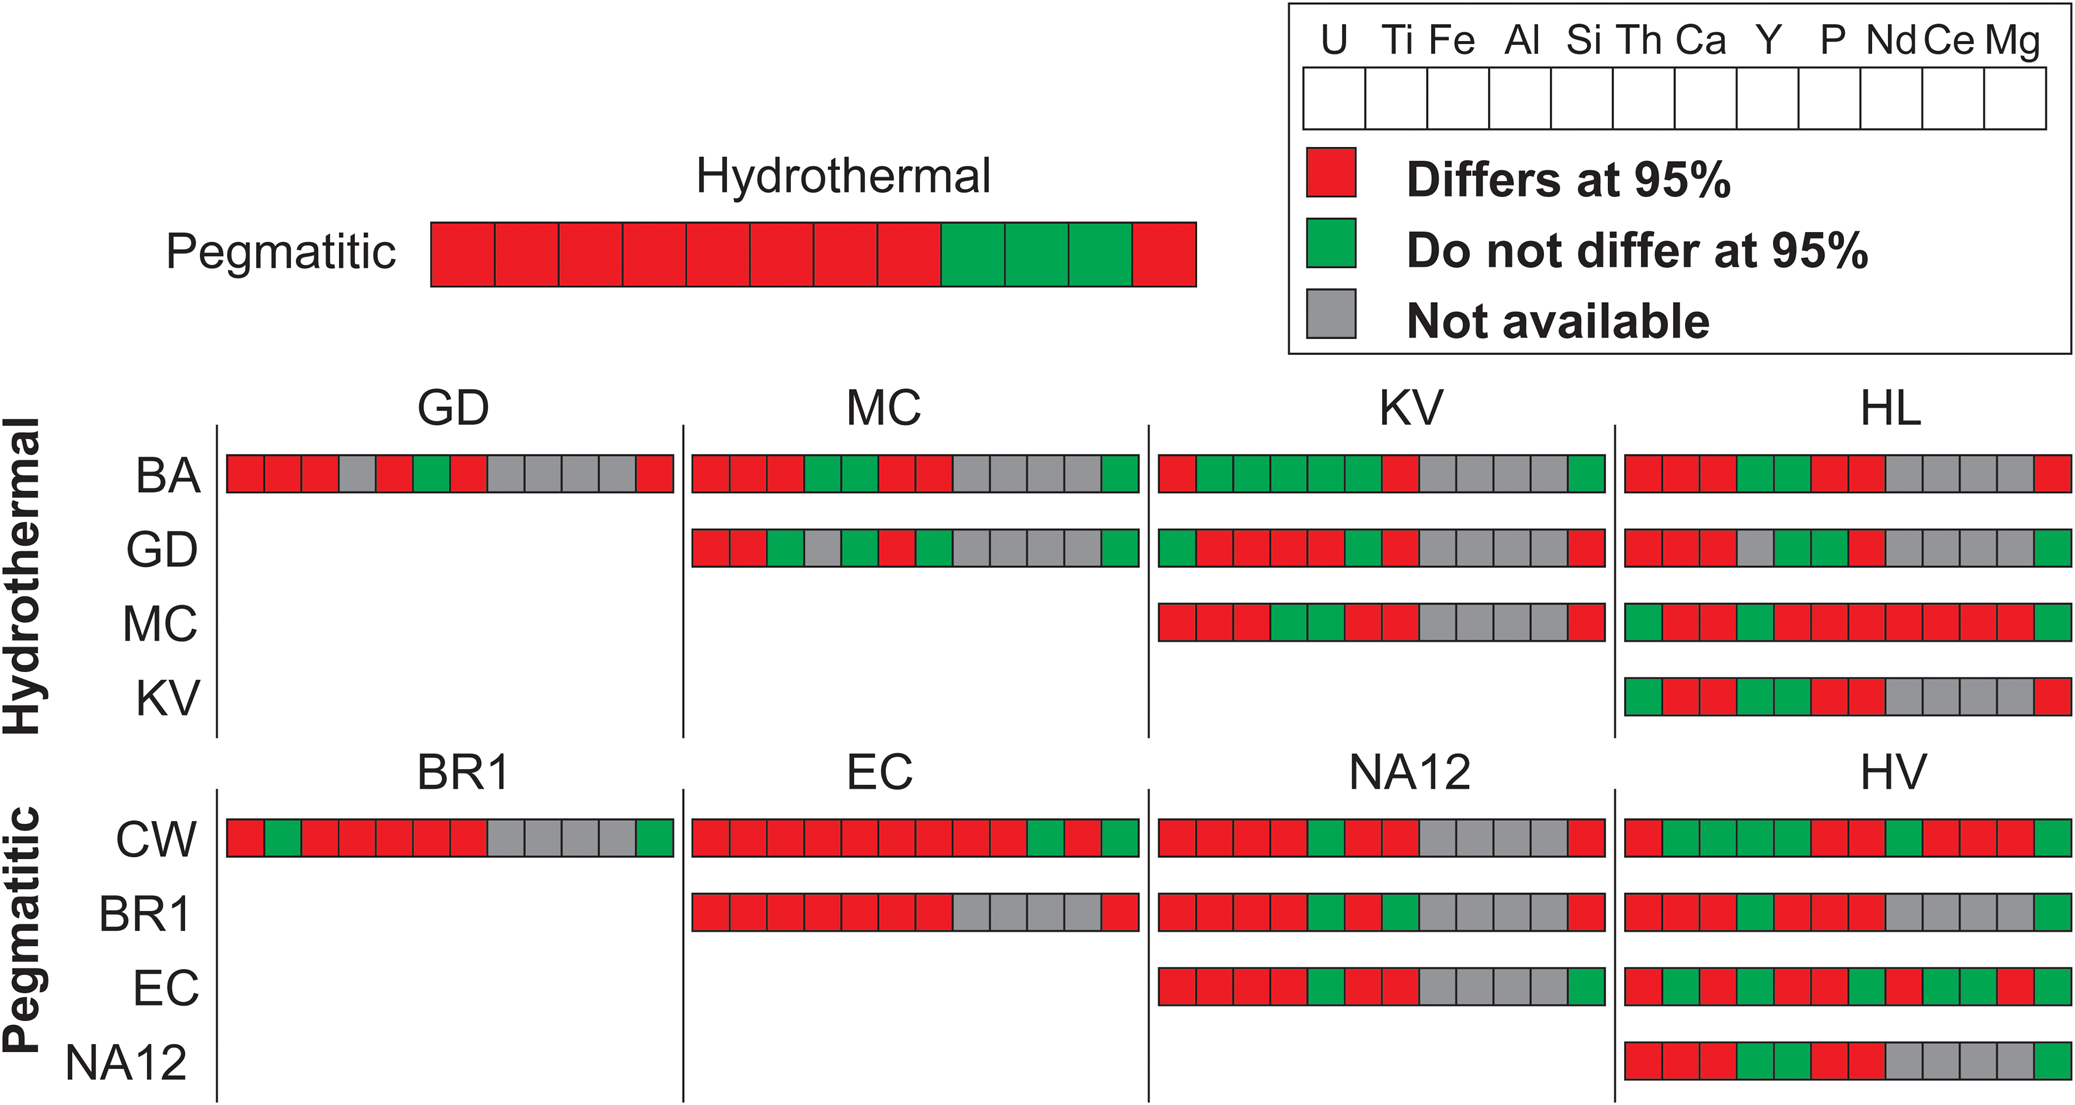
In addition to substitution-related fingerprints (Fig. 14), it is possible to obtain individual signatures for either the brannerite genetic type or the brannerite locality using statistical methods. The non-parametric Kolmogorov–Smirnov test was used to compare the distribution of two populations and therefore evaluate the homogeneity between two samples for a given element. The statistical analysis shows that element content distributions differ significantly (at 95%) between samples, suggesting that each locality has its own mineral chemistry (Fig. 15). However several samples show a weaker range of differing elements, supporting the case that these localities are close in terms of mineral chemistry (e.g. BA and KV or CW and HV). This is in agreement with the distribution observed in PCA (Fig. 11) and classification plots (Fig. 14).
Synoptic chart illustrating the results of a two-sample Kolmogorov–Smironoff test. For each element, its distribution was compared between two samples (locality or genetic type). The more red coloured cases there are indicates significant differences exist in mineral compositions between samples.
Trace-elements variation
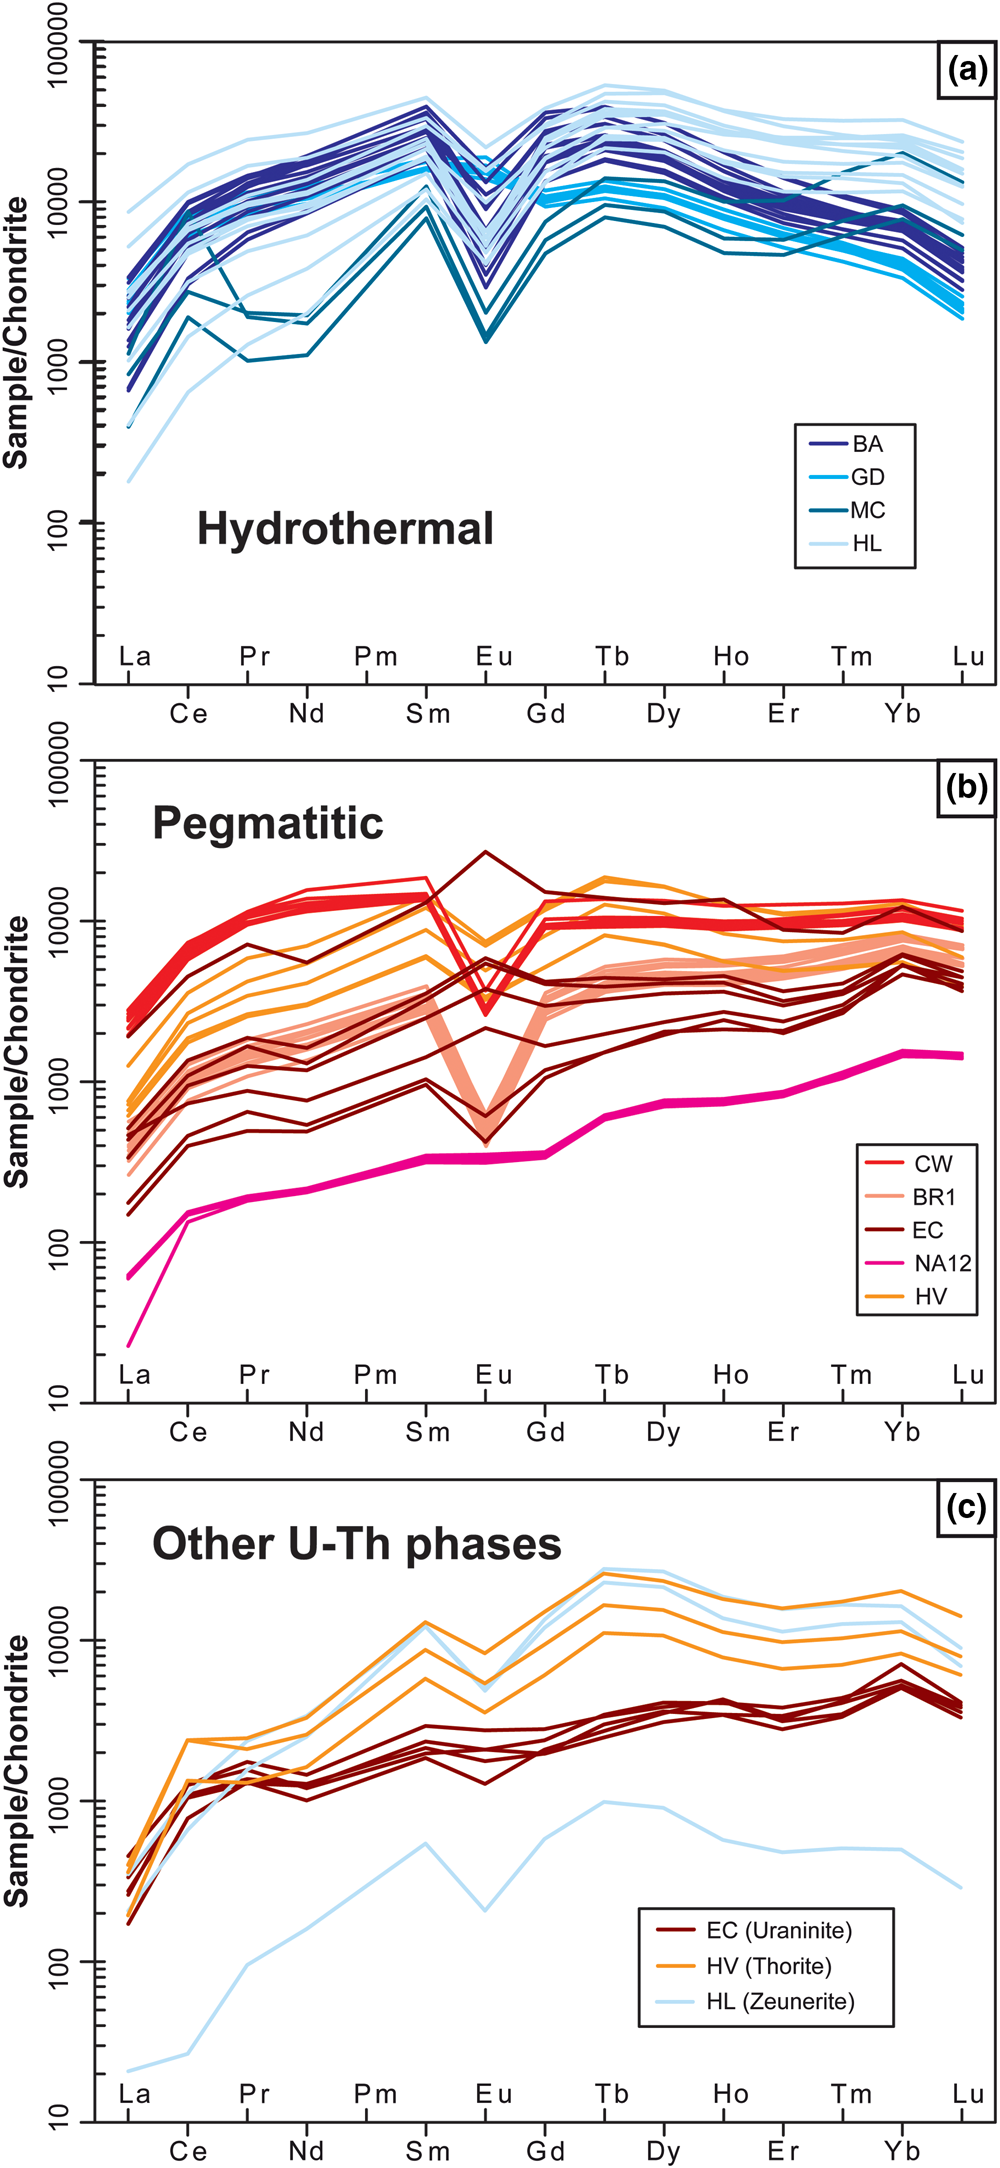
Fingerprints can also be deduced from trace-elements measured in brannerite. As noted above, interpreting the trace-element content (Fig. 10) is difficult as some elements may either: (1) be or not be associated with coupled substitution (e.g. Nb); (2) reflect the local geological environment (Cr at Bou Azzer); or (3) derive from different sources (e.g. common versus radiogenic Pb). In the case of REE, their incorporation is associated with stoichiometric rules, as ionic radii of REE are close to U, regardless of a relative lack of knowledge of charge-balance mechanisms. The shapes of REE patterns differ between the two genetic types.
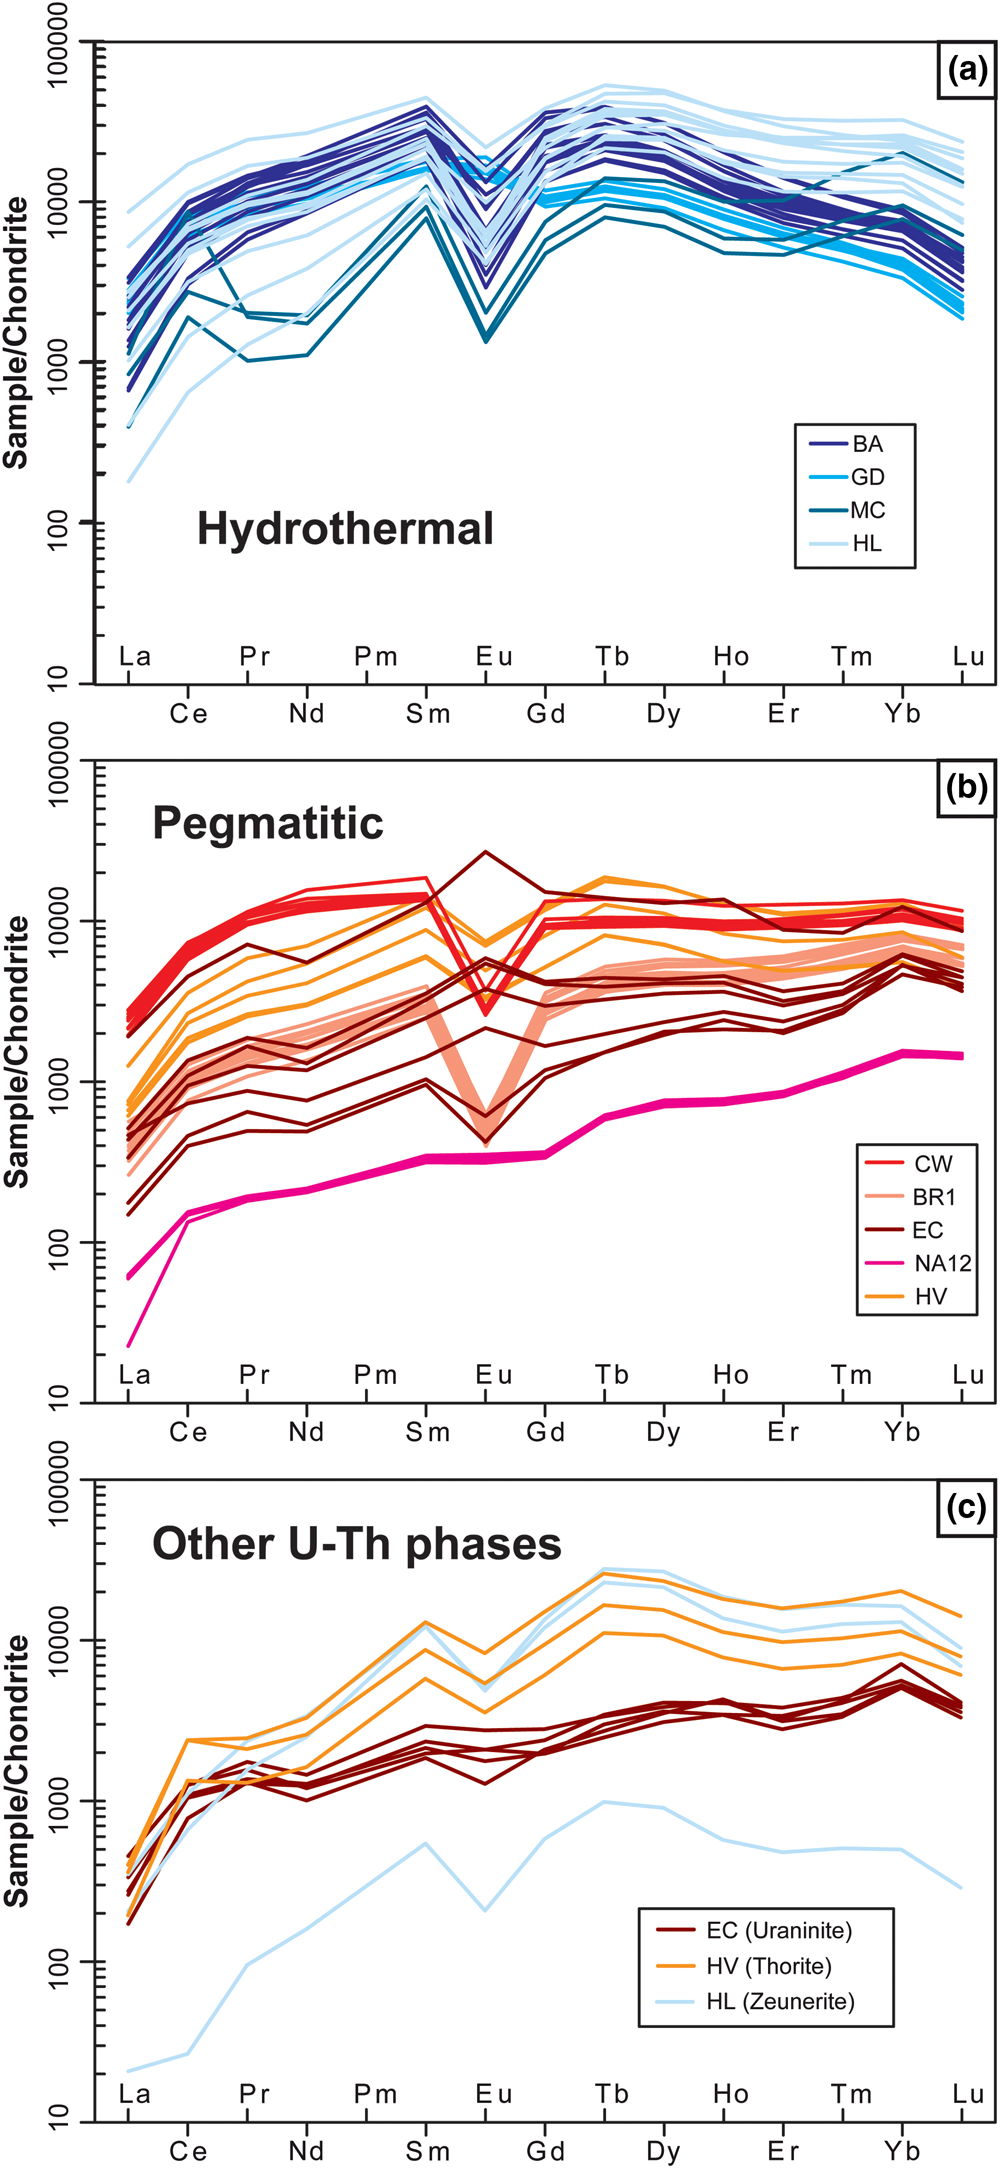
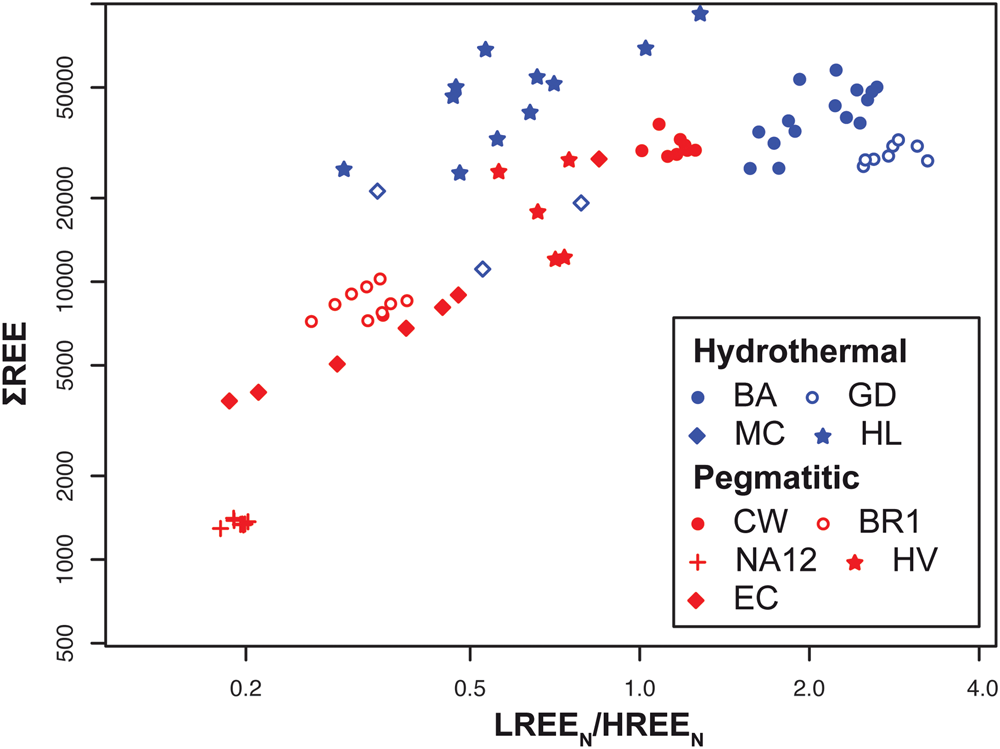
Type 1: Hydrothermal brannerites are marked by a bell-shape (Fig. 16a). ‘Middle’ REE such as Tb (0.92 Å), Dy (0.91 Å), Ho (0.90 Å) and Er (0.89 Å) have ionic radii very close to that of U4+ (0.89 Å) in 6-fold coordination (Shannon, Reference Shannon1976) and, therefore, are most easily incorporated in the brannerite structure. Similar patterns were observed for uraninites formed in unconformity deposits (Pagel et al., Reference Pagel, Pinte and Rotach-Toulhoat1987; Mercadier et al., Reference Mercadier, Cuney, Lach, Boiron, Bonhoure, Richard, Leisen and Kister2011; Frimmel et al., Reference Frimmel, Schedel and Brätz2014). The total amount of REE is usually high (more than 10,000 ppm) and the LREE/HREE ratio oscillates between 0.3 and 3.8 (Fig. 17).
Chondrite-normalised REE patterns from (a, b) brannerite and (c) associated uranium phases from hydrothermal and pegmatitic types. Normalisation values are from McDonough and Sun (Reference Mcdonough and Sun1995).
Total REE vs. chondrite normalised [LREE/HREE] for hydrothermal and pegmatitic type brannerite. Normalisation values are from McDonough and Sun (Reference Mcdonough and Sun1995).
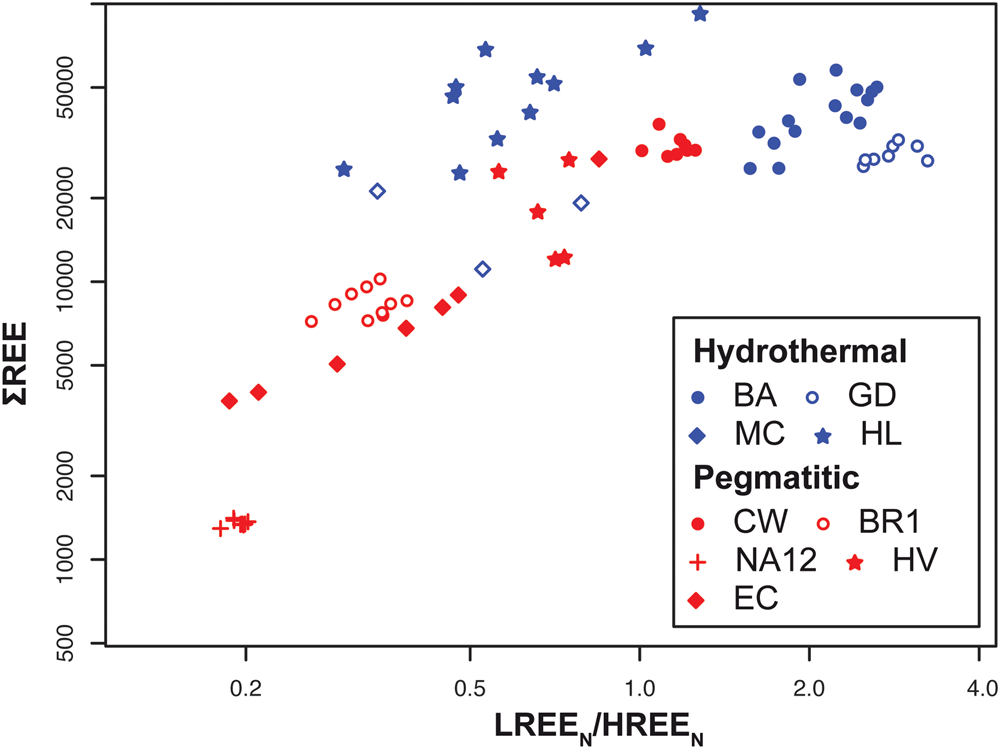
Type 2: At high temperature (>500°C), the brannerite structure dilates (Zhang et al., Reference Zhang, Lumpkin, Li, Blackford, Colella, Carter and Vance2006) allowing the incorporation of REE, with no fractionation, due to differences in ionic radii. Pegmatitic brannerites are marked by LREE depletion, or a regular decrease from HREE towards LREE (Fig. 16b). The total amount of REE shows strong variations (Fig. 17), probably due to competitive substitutions at site A (Fig. 14c). In addition to a general fractionation between LREE and HREE, it is worth noting that the fractionation rate (LREE/HREE) increases with the total amount of REE (Fig. 17).
For the same sample type or locality, the REE patterns are very consistent (Fig. 16). Minor differences may be mostly due to variations of total REE and/or a change in the europium anomaly. In most cases, the Eu anomaly is absent or slightly negative, attesting to an early fractionation of Eu by feldspars, which are described in almost all mineral associations. Eu positive anomalies are reported in La Gardette and El Cabril and could be associated with a local change of redox conditions. It is noteworthy that positive anomalies in El Cabril samples tend to be associated with the high total REE analysis (Fig. 16b). Cerium also shows a frequent positive anomaly, which is also related to redox conditions (e.g. Mont Chemin). Under oxidising conditions, Ce3+ changes to Ce4+, which is preferentially incorporated in site A of brannerite, as its ionic radius (0.87 Å for Ce4+ in 6-fold coordination; Shannon, Reference Shannon1976) is close to that of U4+ (0.89 Å) and its addition does not require charge balance.
These data suggest, that beyond crystal-scale controls, addition of REE also depends on external parameters such as temperature, but also of the presence of other mineral phases that may trigger REE fractionation (Fig. 16c). Among them, monazite, which was reported in several brannerite-bearing samples, preferentially partitions LREE and could be at the origin of the LREE-depleted patterns of most of brannerite.
Implication of brannerite systematic compositional variations
Fingerprints for tracking origin of ore
Defining brannerite fingerprints offers a potential useful application in determining the source of possibly illegally mined uranium ores. Such an approach has been applied to a variety of conflict or strategic minerals, such as colombite–tantalite (Melcher et al., Reference Melcher, Sitnikova, Graupner, Martin, Oberthür, Henjes-Kunst, Gäbler, Gerdes, Brätz, Davis and Dewaele2008, Reference Melcher, Graupner, Gäbler, Sitnikova, Henjes-Kunst, Oberthür, Gerdes and Dewaele2015), gems (Giuliani et al., Reference Giuliani, France-Lanord, Coget, Schwarz, Cheilletz, Branquet, Giard, Pavel, Martin-Izard and Piat1998, Reference Giuliani, Fallick, Garnier, France-Lanord, Ohnenstetter and Schwarz2005) and uraninite (Mercadier et al., Reference Mercadier, Cuney, Lach, Boiron, Bonhoure, Richard, Leisen and Kister2011; Frimmel et al., Reference Frimmel, Schedel and Brätz2014; Spano et al., Reference Spano, Simonetti, Balboni, Dorais and Burns2017). Chemical fingerprints of brannerite consist of a combined characterisation of the major substitution trends (A and B sites), the nature of elements incorporated, and the shape of REE patterns. Other trace elements can be used as they may represent a locality-specific feature, which may be useful in forensic studies. However, as shown by this study and reported in previous literature (e.g. Charalambous et al., Reference Charalambous, Ram, Pownceby, Tardio and Bhargava2012; Lumpkin et al., Reference Lumpkin, Leung and Ferenczy2012; Macmillan et al., Reference Macmillan, Cook, Ehrig and Pring2017), brannerite ores are generally complex and include other uranium minerals (e.g. uraninite, coffinite) and/or successive generations of brannerite with variable composition (Fig. 4e–h). Hence, traceability studies cannot be done at ore scale, but require careful consideration of U-bearing mineral phases. A complementary signature using isotope systematics (O, U, Th or Pb) as proposed for uraninite (e.g. Pajo et al., Reference Pajo, Mayer and Koch2001) could also be a useful tool to provide an unequivocal source for brannerite.
Using brannerite as a tool for the radiometric age determination of mineralising events
The high U (and Th) abundance makes brannerite a good candidate tool for age determination of mineralising events. Previous geochronology was carried out using a variety of techniques including isotope dilution-thermal ionization mass spectrometry (ID-TIMS) (Ludwig and Cooper, Reference Ludwig and Cooper1984; Copeland et al., Reference Copeland, Harrison, Hodges, Maruéjol, Lefort and Pecher1991) and laser ablation inductively coupled plasma mass spectrometry (LA-ICP-MS) (Oberthür et al., Reference Oberthür, Melcher, Henjes-Kunst, Gerdes, Stein, Zimmerman and Ghorfi2009) over a large range of ages (4.8 Ma to 670 Ma). These published geochronological data lack, in most cases, detailed petrography to support unequivocal evidence for: (1) unique brannerite chemistry close to ideal composition to limit matrix effects; and (2) a single crystallisation stage to avoid mixing between populations of different ages. The nature of Pb is another crucial issue that needs to be considered for geochronological applications. In 6-fold coordination, the respective ionic radii of Pb4+ and Pb2+ are 0.77 Å and 1.19 Å, respectively (Shannon, Reference Shannon1976), suggesting that Pb substitutes poorly for U at the A site. The dilatation of the crystal structure at high temperatures probably enables a larger addition of Pb2+ in brannerite, but this cannot explain the local Pb enrichment (e.g. more than 10,000 ppm at Montchemin; Fig. 10f). Radiogenic Pb produced by decay of U and Th, can be present in significant concentrations in old brannerite, like Hidden Valley and Crocker's Well (Fig. 10f). Significant Pb loss has also been reported, which makes geochronological data interpretation even more challenging (Lumpkin et al., Reference Lumpkin, Leung and Ferenczy2012). Furthermore, the common association of brannerite with galena at various scales (Figs 3, 5, 6) also questions the origin of the measured Pb. Lead is a network modifier and thus, as brannerite becomes metamict with time, lead is typically trapped in nanometric galena (Fig. 5; Lumpkin et al., Reference Lumpkin, Leung and Ferenczy2012). Furthermore, Macmillan et al. (Reference Macmillan, Cook, Ehrig and Pring2017) suggest that galena can also be: (1) cogenetic with brannerite; (2) a product of the recrystallisation of early Pb-rich brannerite; and (3) a product of uraninite dissolution. The occurrence of U loss in altered domains (Fig. 8) and the presence of exsolution of U-rich nanodomains (Fig. 5a–c) in brannerite, are also of primary importance for geochronological purposes. Accurate interpretation of ages, obtained either by bulk (ID-TIMS) or high resolution in situ techniques (SIMS, LA-ICP-MS) requires the petrogenesis and composition of both brannerite and associated phases, from the microscale to the nanoscale to be determined.
Recovery of U and other elements from natural brannerite
Whereas brannerite has been explored as a matrix storage for nuclear wastes (e.g. Lumpkin, Reference Lumpkin2001), its refractory nature to leaching has been recently challenged in order to evaluate potential uranium recovery (e.g. Lottering et al., Reference Lottering, Lorenzen, Phala, Smit and Schalkwyk2008, Charalambous et al., Reference Charalambous, Ram, McMaster, Pownceby, Tardio and Bhargava2014; Gilligan and Nikoloski, Reference Gilligan and Nikoloski2015a,Reference Gilligan and Nikoloskib). On the basis of tests made on natural and synthetic crystals, these authors have shown that several parameters can influence the recovery rates such as temperature, pH, and Fe3+ concentrations in the solvents. This last parameter is very important, as the amount of extracted U from brannerite is proportional to the Fe3+ concentration (Gogoleva et al., Reference Gogoleva2012; Charalambous et al., Reference Charalambous, Ram, McMaster, Tardio and Bhargava2013, Reference Charalambous, Ram, McMaster, Pownceby, Tardio and Bhargava2014). Iron substitutes for titanium in the B site and its abundance, which varies between samples, depends on the genetic types of brannerite (Figs 11b, 12c). The high Fe content of some pegmatitic occurrences (Namibia) makes them good candidates for naturally magnifying U recovery. However, these ores are generally complex and brannerite also contains other elements such as Ca, REE and Si (Fig. 12a). While leaching mechanisms remain unknown, it appears that when uranium is partially replaced in the brannerite structure by other elements (Ce, Ca…), the extraction of uranium is reduced (Charalambous et al., Reference Charalambous, Ram, Tardio and Bhargava2010). Hence, several elements that could represent economically interesting co-products (e.g. REE) may also represent a limit for acceptable recovery rates of uranium from brannerite
Conclusion
On the basis of original analytical data from a variety of brannerite occurrences, this study demonstrates that the major- and trace-element composition and REE abundances of brannerite reflect the geological conditions of their formation. In combination it is possible to obtain a reliable geochemical classification at the scale of ore locality and genetic types. Such fingerprints are useful for forensic science, the exploration industry, understanding metallogenic processes and optimising the extraction of uranium. Our dataset is not exhaustive, and it is necessary to complement it with other occurrences from other genetic environments, such as uraniferous conglomerates (e.g. Elliot lake, Witwatersrand) or metamorphic domains (Domes Region in Zambia). Applying our approach also requires not only blind spot analyses, but a careful preliminary study or ore petrography, as brannerite ores can be polyphase and chemically complex.
This study also points out the partial misunderstanding of various geochemical processes at the atomic scale. One of the major points is the valence state of U, its origin (e.g. the role of redox conditions for brannerite formation) and the major consequences for the present complex mineral chemistry of brannerite. The presence of uranium itself has severe effects on the brannerite crystal structure and the metamict aspect of natural brannerite of various ages has been demonstrated (e.g. Lumpkin et al., Reference Lumpkin, Leung and Ferenczy2012). This could be responsible for the origin of various crystal defects, which might represent possible non-stoichiometric traps for a variety of elements (e.g. Si). How to reconcile such crystallographic self-alteration with the apparent pristine mineral geochemistry is not therefore straightforward. Further study on natural brannerite is required to follow this holistic approach and to combine various scale observation and techniques, in order to meet such a challenge.
Acknowledgements
This article was part of the UTILE multi-disciplinary project and was sponsored by the NEEDS (CNRS-AREVA-CEA) program. We are grateful to Olivier Rouer (GeoRessources, Nancy), Martin Robyr (Univ Lausanne), Philippe de Parseval (centre de microcaratérisation Raimond Castaing, Toulouse) for EPMA and mapping, and Nadia Guignard (IC2MP, Poitiers) for Raman spectrometry. We express our gratitude to Lubos Vrtiska (Narodni Museum, Prag), Michel Cuney (GeoRessources), Jean-Claude Leydet and Marc Brouand (Orano) for providing a part of the samples. We thank Roger Mitchell and Jason Harvey for handling the manuscript and three anonymous reviewers for their constructive comments, which helped to improve the manuscript significantly.
Supplementary material
To view supplementary material for this article, please visit https://doi.org/10.1180/mgm.2020.7