INTRODUCTION
Globally, durum wheat comprises 0·1 of the total area given over to wheat cultivation and occupies 11 million ha in the Mediterranean basin. Fluctuations in rainfall and temperatures in the Mediterranean dryland areas are large and unpredictable over different cropping seasons (Nachit et al. Reference Nachit, Baum, Poreciddu, Monneveux and Picard1998). The durum breeding programme in Iran is run in collaboration with the International Centre for Agricultural Research in the Dry Areas (ICARDA) and is aimed at developing varieties adapted to the different environments prevailing in Iran, including the extension of durum wheat cultivation to cold and mildly cold winter areas. The improved durum genotypes are evaluated in multi-environment trials (METs) to test their performance across environments and to select the best genotypes in specific environments. In the case of durum wheat in the highlands of Iran, where the landrace Zardak is widely grown by farmers under rain-fed conditions, there is a need to develop better adapted and higher yielding varieties. This will assist with increasing the area devoted to durum wheat and in competing with bread wheat (particularly the cultivar Sardari), whose cultivation is still more profitable despite the 0·06 price premium for durum wheat grain (Mohammadi & Amri Reference Mohammadi and Amri2008).
In most cases, genotype-by-environment (G×E) interaction is observed, complicating selection for improved yield. G×E interaction can be an outcome of genotype rank changes from one environment to another, a difference in scale among environments, or a combination of these phenomena (Baker Reference Baker1988). It is well documented that grain yield is influenced by genotype, environment and G×E interaction (Brennan & Sheppard Reference Brennan and Sheppard1985; Cooper et al. Reference Cooper, Byth and Woodruff1994), although the relative magnitude of these sources differ. Knowledge on the effect of G×E interaction is required for the design of an efficient and economic selection strategy involved in a breeding programme (Gauch & Zobel Reference Gauch and Zobel1997; Kang Reference Kang1998). Crop breeding programmes should take G×E interaction into consideration and have an estimate of its magnitude, relative to the magnitude of G and E effects, which affect grain yield. Furthermore, the identification of the genotype that yields best in a specific growing environment would be useful to breeders. This is essential for understanding the responses of durum genotypes in targeted environments and the performance of genotypes in various testing environments in Iran.
Many statistical approaches exist for analysing G×E interaction (Finlay & Wilkinson Reference Finlay and Wilkinson1963; Eberhart & Russell Reference Eberhart and Russell1966; Perkins & Jinks Reference Perkins and Jinks1968). These methods require an a priori assumption of linearity and normality of yield response across environments. These assumptions severely limit the application and utility of linear-regression methods to deal with practical situations in most of which, a priori, the data are rarely known to fulfil these underlying assumptions. The linear-regression-based methods, and also the additive main effects and multiplicative interaction (AMMI) method (Gauch Reference Gauch1992), do not have an in-built mechanism like pattern analysis to classify the environments and/or the genotypes required to help identify the underlying patterns of G×E structure in the environmental and/or the genetic population. Pattern analysis is based on the joint and complementary use of classification and ordination. This is absent in AMMI, which is basically an ordination technique (Alagarswamy & Chandra Reference Alagarswamy and Chandra1998).
Pattern analysis (Williams Reference Williams1976; DeLacy et al. Reference DeLacy, Basford, Cooper, Bull, McLaren, Cooper and Hammer1996a) allows the joint use of clustering and ordination analyses to investigate the information in data. All of the G×E information from plant improvement METs grown over diverse environments can be investigated with clustering and ordination procedures (DeLacy et al. Reference DeLacy, Basford, Cooper, Bull, McLaren, Cooper and Hammer1996a, Reference DeLacy, Cooper, Basford, Kang and Gauchb). Pattern analysis has been applied to many METs and shown to be very effective (Abdalla et al. Reference Abdalla, Crossa, Autrique and DeLacy1996; Redden et al. Reference Redden, DeLacy, Butler and Usher2000; Trethowan et al. Reference Trethowan, Crossa, van Ginkel and Rajaram2001, Reference Trethowan, van Ginkel and Rajaram2002, Reference Trethowan, van Ginkel, Ammar, Crossa, Cukadar, Rajaram and Hernandez2003; Lillemo et al. Reference Lillemo, van Ginkel, Trethowan, Hernandez and Rajaram2004; Zhang et al. Reference Zhang, He, Zhang, van Ginkel and Ye2006).
Clustering summarizes data by grouping genotypes with similar performance across environments and grouping those environments that produce similar discrimination among the performance of genotypes. Thus, clustering summarizes complexity in the data with retention of the majority of the information by describing performance with relatively few genotype groups or relatively few environmental groups or both (Mungomery et al. Reference Mungomery, Shorter and Byth1974; Cooper & DeLacy Reference Cooper and DeLacy1994; DeLacy et al. Reference DeLacy, Basford, Cooper, Bull, McLaren, Cooper and Hammer1996a). With ordination, relationships among genotype performance and environment discrimination are represented in a low-dimensional representation of the original data in fewer axes (Gabriel Reference Gabriel1971; Gauch & Zobel Reference Gauch and Zobel1997). In these representations, genotypes with similar performances and environments that produce similar discrimination among genotypes will be placed close together on the biplot.
Knowledge of environment classification is an important prerequisite for effective targeting of the METs to representative environment-groups. This helps to bring down the cost of conducting them; an important consideration due to the limited funds available to most breeding programmes. Another practical necessity for environmental classification is to characterize the pattern of adaptation (specific/broad) among genotypes. The main objectives of the present work were to: (i) study the patterns of genotypes, environments and G×E interaction for durum METs in Iran; (ii) identify similar or redundant environments to help streamline performance trials; and (iii) identify high-yielding adapted durum genotypes in environmental groups.
MATERIALS AND METHODS
Experimental data
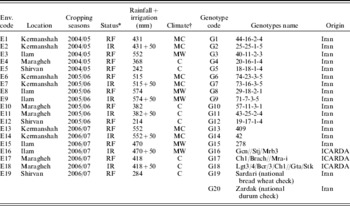
Twenty genotypes (G1–G20) representing breeding lines, landraces from genebanks and cultivars were selected over years within the Iran–ICARDA collaborative programme and were evaluated in 19 environments (E1–E19) representing different ecosystems (west, north west and north east of Iran), different water regimes in each location (rain-fed and supplemental irrigation, 50 mm irrigation after flowering stage) and different climates (warm, moderately cold and cold winters) during three cropping seasons (2005–07). The details of the genotypes, their origin, the environments and climatic data are presented in Table 1. In each environment, a randomized complete block design (RCBD) with three replications was used to test the 20 genotypes. Each plot consisted of six rows 6 m long with an interrow spacing of 200 mm. Fertilizer application was 50 kg N/ha and 50 kg P2O5/ha at planting in each environment. The grain yields (with 135 g water/kg fresh weight moisture content) from plots were converted into kg/ha.
Information on environments and genotypes used in the study

* RF and IR, rain-fed and supplemental irrigations, respectively.
† MC, moderately cold; MW, moderately warm; and C, cold.
Analysis of variance (ANOVA) and pattern analysis
ANOVA of grain yield data for the 20 genotypes and 19 environments was used to examine the partitioning of sum of squares (SS) to G, E and G×E interaction with the mean squares of the error. Before the application of pattern analysis, the yield matrix was standardized within environments, whereby the environment main effects and the grand mean are removed, with the remainder divided by the within environment standard deviation (Fox & Rosielle Reference Fox and Rosielle1982; Cooper & DeLacy Reference Cooper and DeLacy1994). From the standardized yield matrix, a squared Euclidean distance matrix (i.e. a dissimilarity matrix) was computed for genotypes and environments. Hierarchical agglomerative clustering (Williams Reference Williams1976) with incremental SS (Ward Reference Ward1963) as the fusion criterion was applied to the matrices, i.e. in any part of the dendrogram, members or groups were joined to minimize the new within group SS. Dendrograms were constructed on the basis of fusion level to examine similarities in pattern of performance among genotypes (in reaction to environments) and environments (in discriminating among genotypes).
The biplot derived from ordination (using environment standardized data) assessed the relationships among genotypes, among environments, and between genotypes and environments (Kempton Reference Kempton1984). Biplot scores were computed using singular value decomposition. In a biplot obtained from environment-standardized data, the origin (0, 0) represents the average productivity for environments, and the biplot models the sum of genotypic and G×E interaction (G+G×E) effects (DeLacy et al. Reference DeLacy, Basford, Cooper, Bull, McLaren, Cooper and Hammer1996a). Genotypes close to the origin are average in their performance across all environments. Genotypes that are close to each other tend to be similar. Small angles between two environment vectors indicate strong positive associations, i.e. high similarity between these two environments; 90° angles indicate no association and angles greater than 90° indicate negative associations (Alagarswamy & Chandra Reference Alagarswamy and Chandra1998). The genotypes distributed in the increasing direction of an environment vector give above-average yields in that environment, whereas those distributed in the opposite direction have lower than average yields. To characterize genotypes, a line must be drawn perpendicularly from a particular genotype to an environment vector. The point of intersection indicates the genotype's relative performance in that environment, i.e. for the same environment vector, a better genotype would project an intersection point that is further along in the positive direction of the environment vector (Haussmann et al. Reference Haussmann, Hess, Reddy, Mukuru, Kayentao, Welz and Geiger2001). The statistical software IRRISTAT (IRRI 2005) was used to perform the ANOVA and pattern analysis.
RESULTS
ANOVA and mean yield performance
The ANOVA indicated that environmental main effect was the dominant source of variation, followed by G×E interaction and G main effect. The partitioning of total SS of the original G×E data matrix indicated that 0·01, 0·86 and 0·13 of the total variation was accounted for by differences among genotypes, environments and G×E interactions, respectively (ANOVA table is not shown). This ranking agrees with similar findings in other G×E studies (DeLacy et al. Reference DeLacy, Eisemann, Cooper and Kang1990; Cooper et al. Reference Cooper, Brennan, Sheppard, Cooper and Hammer1996b).
The mean grain yield of genotypes across environments varied from 2271 kg/ha (for G3) to 2607 kg/ha (for G9), and the environment mean grain yield across genotypes varied from 592 kg/ha in E12 to 4167 kg/ha in E7. The mean grain yield in the G×E data matrix ranged from 237 kg/ha at E12 (due to a severe drought) to 6975 kg/ha in E2 (under supplemental irrigation). Grain yield data also indicated that genotypes fail to retain their relative yield ranking across the 19 environments (data not shown). The G×E SS was 12·2 times that of genotypes indicating the presence of sizable G×E interactions.
Classification analysis
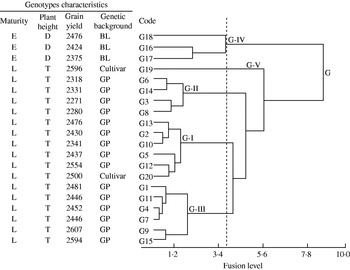
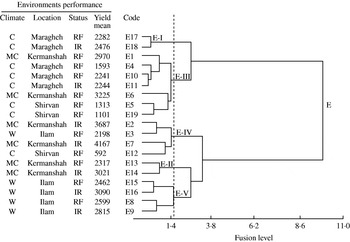
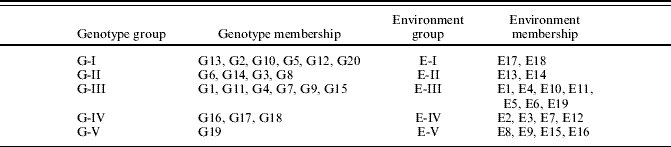
The results of classification analysis are shown in dendrograms for genotypes (Fig. 1) and environments (Fig. 2). The genotype and environment group numbers and their memberships are also given in Table 2. The numbers of genotype and environment groups were decided on the basis of the SS retained in the reduced G×E matrix. Following this criterion, genotypes were classified into five groups and environments also into five groups, which retained 0·76 of the SS of G×E.
Genotype dendrogram showing hierarchical classification of 20 durum genotypes using environment standardized grain yield data across 19 environments. The fusion criterion was incremental sum of squares (SS). The vertical line represents the critical level of separation (P<0·05). Labels are: BL, breeding lines; GP, germplasm; D, semi-dwarf genotypes; T, tall genotypes; E, early maturity genotypes; and L, late maturity genotypes.

Environment dendrogram showing hierarchical classification of 19 different environments using standardized grain yield data of 20 durum genotypes. The fusion criterion was incremental SS. The vertical line represents the critical level of separation (P<0·05). Labels are: RF, rain-fed environments; IR, irrigated environments; C, cold winter environments; MC, moderately cold winter environments; and W, warm winter environments.

Genotype/environment group number and membership for grain yield for 20 genotypes/19 environments
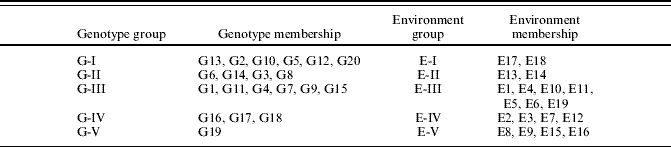
Genotype group G-I (which included the landrace Zardak) contained genotypes, which were relatively high yielding (mean 2456 kg/ha), tall and late maturing. Genotype group G-II contained types with the lowest yield (mean 2300 kg/ha) and were late maturing and tall. High-yielding genotypes (mean 2594 kg/ha) that were tall and late maturing comprised genotype group G-III. The genotype group G-IV included the early maturing and semi-dwarf breeding lines with low- to medium-yielding performance. The high-yielding bread wheat cultivar, Sardari, which is tall and late maturing, formed a single-member group (G-V), which was separated at a much higher level of hierarchy in the genotype dendrogram (Fig. 1). The genotype dendrogram clearly indicated the existence of two major groups at point G of maximum dissimilarity in the dendrogram (Fig. 1). The presence of two major genotype groups confirmed the selection origin of genotypes in these groups (i.e. breeding lines of ICARDA v. germplasm of Iran).
The environment classification first separated two medium-yielding environments in Maragheh as environment group E-I (Fig. 2). Average- to high-yielding environments were included in group E-II. The third group (E-III) consisted of cold and moderately cold environments with average to high yields, and also cold rain-fed environments with low yields. Irrigated environments and rain-fed environments with a range of low to high yields are included in environment group (E-IV). Group E-V comprised environments with average to high yields. The major split in environment classification point E, indicated that the warm environments (Ilam) were different from the cold environments (Maragheh and Shirvan) and confirmed the existence of two mega-environment groups in durum regional yield trials in Iran. However, it was not possible to separate the environments with moderately cold winters into an individual group.
Ordination analysis
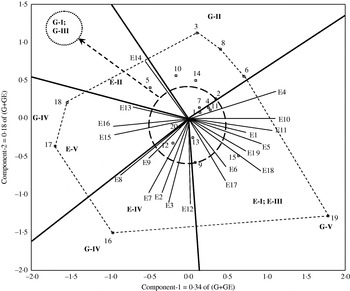
The results of ordination analysis are presented in a biplot (Fig. 3). The first two components of the biplot jointly explained 0·52 of total SS of the G×E (ANOVA table is not shown). The environment vectors covered a wide range of Euclidean space, indicating that the 19 environments represent a super-population of widely different environments. This reflects the wide range of climates within Iran (Fig. 3). The biplot was drawn to show the responses of genotypes and environments. In the biplot, some corner or vertex genotypes, which are the most responsive ones, can be visually identified by drawing a polygon. These are either the best or the poorest genotypes at some or all environments; they can be used to identify possible mega-environments (Yan et al. Reference Yan, Kang, Ma, Woods and Cornelius2007).
Biplot for principal components 1 and 2 obtained from the ordination of environment standardized data for grain yield. Environments are characterized by vectors drawn from the biplot origin and entries are the genotypes.

The genotypes G19, G16, G17, G18, G3, G8 and G6 were more responsive. The environments are divided into five sectors, where only four out of five sectors included environments identified as the subregions. The first one contains the environment groups E-I and E-III with the best performing genotype group G-V; the second sector consists of environment group E-IV with the genotype group G-IV (genotype No. 16) as the best performing; the next sector contains the environment group E-V with genotype group G-IV (genotypes No. 17 and 18) as the best recommended genotype group; the last ones included the environment group E-II with any recommended genotypes (Fig. 3).
Vertex genotypes (i.e. genotype group G-II) without any environment in their sectors were not the highest yielding genotypes at any environment; moreover, they were the poorest genotypes at some environments.
Genotypes G3 and G18 (grouped into G-II and G-IV) were equally good in environment E14 (location Kermanshah under irrigation). Genotypes in G-I and G-III were not the best in any groups of environments and appear largely near the biplot origin, suggesting they are more stable (Yan et al. Reference Yan, Kang, Ma, Woods and Cornelius2007). Genotypes within the polygon, particularly those located near the plot origin, were less responsive than the vertex genotypes (Fig. 3).
The maximum angle among the vectors of environment groups E-I and E-III is well below 90°, corresponding to rain-fed cold environments in Maragheh and Shirvan (Fig. 3). This suggests that these environments tend to discriminate between genotypes in a similar fashion. The genotype G19 was highly adapted to these environment groups. These two environment groups (E-I and E-III) made an angle of close to 180°, with environment group E-V (which included the warm environments) suggesting that these environments tend to be distinctly independent among genotypes. These results confirmed those obtained from the classification, where the warm environments are strongly separated from the cold environments (environment groups E-I and E-III). The genotypes from ICARDA were highly adapted to the environments included in group E-V. The angle among the vectors of the environments E2, E3, E7 and E12 in group E-IV tended to be closer. The genotype G16 expressed top yield in this environment group. The genotype group G-V (which contained only the bread wheat cultivar Sardari) had the best adaptation to environment group E-I indicating that this cultivar is adapted to cold environments.
Environments with longer vectors were more useful for genotype discrimination (Yan et al. Reference Yan, Kang, Ma, Woods and Cornelius2007), whereas the environments E1, E13, E9 and E6 with short vectors provided little information about the genotype differences.
DISCUSSION
METs are important for testing general and specific genotype adaptation. A cultivar grown in different environments will frequently show significant fluctuation in yield performance relative to other genotypes. These changes are influenced by the different environmental conditions and are referred to as G×E interaction (Dias et al. Reference dos, Dias and Krzanowski2003).
In the present study, most of the total SS was explained by the environment (0·85 of total SS), reflecting a much wider range of environment main effects than genotype main effects. For the majority of METs, environment accounts for the maximum variation (DeLacy et al. Reference DeLacy, Eisemann, Cooper and Kang1990; Cooper et al. Reference Cooper, Brennan, Sheppard, Cooper and Hammer1996b; Haussmann et al. Reference Haussmann, Hess, Reddy, Mukuru, Kayentao, Welz and Geiger2001; Zhang et al. Reference Zhang, He, Zhang, van Ginkel and Ye2006). The observed pattern of G×E interaction for grain yield in durum wheat METs supports the hypothesis of the presence of differentially adapted durum genotypes in durum regional yield trials of Iran. However, a more extensive G×E interaction would be required to clearly separate genotypes with high adaptation to diversified environments.
These results suggest that it is necessary to partition the region into subregions based on the temperature to make genotype recommendations. Specific genotypes appeared to be adapted to cold environments, suggesting that selection for specific adaptation to this part of Iran will result in faster genetic progress compared with the focus on selection for wide adaptation to all environments. Such well-targeted breeding efforts could help in expanding the cultivation of durum wheat into mildly cold and cold winter areas, currently used mainly for bread wheat and, to a lesser extent, barley.
The warm environments discriminated different genotypes as appropriate. The ranking of many genotypes was the reverse of that in colder environments. The breeding lines (G16, G17 and G18) are well adapted to warm environments but poorly adapted to cold environments, whereas the genotypes G19, G15, G6, G8 and G3 were highly adapted to certain cold environments. The genotype groups G-I and G-III that are closer to the origin of the biplot have average performances across environments and showed wide adaptation across environments (Yan et al. Reference Yan, Kang, Ma, Woods and Cornelius2007).
Comparison between rain-fed and irrigated environments at each location revealed similar responses of genotypes, i.e. supplemental irrigation did not result in major variation. The aim of supplemental irrigation in durum breeding programmes is to identify breeding lines which can cope with the increasing scarcity of water.
Iran is currently one of the world's largest net importers of agricultural products, importing about 0·3 of its requirements. Rapid population growth is expected to increase the demand for food. Extension of the area grown and the improvement of durum wheat yields could contribute to food security in Iran. However, the major challenges of durum wheat breeding are the need for identification of genotypes with good cold tolerance and the need to find useful information within the available quantities of data. In the present study, pattern analysis, which has been shown to be very effective for analysing G×E interactions (Byth et al. Reference Byth, Eisemann and DeLacy1976; Abdalla et al. Reference Abdalla, Crossa, Autrique and DeLacy1996; Cooper et al. Reference Cooper, DeLacy, Basford, Cooper and Hammer1996a; Zhang et al. Reference Zhang, He, Zhang, van Ginkel and Ye2006), allowed a sensible and useful summary of a G×E data set and assisted in examining the natural relationships and variations in genotype performance among various environmental groups. It has also assisted with refining the breeding strategy for durum wheat in Iran with the identification of two contrasting warm and cold mega-environments. This suggests that it may be possible to reduce the number of warm environments for durum testing and thereby conduct durum METs more economically. In contrast, the environments within the cold mega-environment were widely separated, suggesting the need to maintain more testing environments to evaluate genotype adaptation. The environments belonging to the moderately cold location (Kermanshah) tended to group with both mega-environments, suggesting that these environments will lead to the selection of genotypes, which can be grown in cold and warm environments. Further, careful definition of target environments along with the participation of farmers will ensure that the cultivars developed are adapted to the target conditions and will satisfy end-user preferences (Rattunde et al. Reference Rattunde, Obilana, Haussmann, Reddy, Hess, Haussmann, Hess, Koyama, Grivet, Rattunde and Geiger2000).
Support and funding provided by the Agricultural Research and Education Organization (AREO) of Iran is acknowledged. We thank two anonymous reviewers, associate and technical editors of the Journal of Agricultural Science for their helpful discussions and suggestions on the manuscript.