

One of most negative campaigns in history may have taken place during the 2014 Senate election cycle. Nearly 75% of senate ads aired during a two-week period in early fall of 2014 showed a candidate in a negative light, according to the Wesleyan Media Project.Footnote 1 A postelection analysis by the Center for Public Integrity showed that 46% of the more than one million ads aired during the 2014 senate campaigns were negative. And, in the most competitive states, the proportion of negative ads was even higher (e.g., 67% in North Carolina, 58% in Kansas).Footnote 2 Negative advertisements sponsored by candidates, interest groups, and political parties are being launched on the airways, in newspapers, on radio, and via the Internet at an unprecedented pace. These advertisements, however, are now routinely subjected to fact checking. The Washington Post, along with many other fact-checking organizations, such as PolitiFact, The AP Factcheck, and Factcheck.org, examine thousands of statements and political advertisements during campaigns to determine the accuracy of the claims. For instance, during the 2012 election cycle, PolitiFact had 36 reporters and editors working in 11 states producing more than 800 fact checks on the presidential campaign and hundreds more for candidates running for the U.S. House and U.S. Senate.Footnote 3
The concept of fact checking exploded in 2012. As David Carr, the media writer at The New York Times, explained, “[T]his was indeed the most fact checked election in history.”Footnote 4 The first fact checking web site, Factcheck.org, was launched in 2003 by the Annenberg Public Policy Center. PolitiFact, created by The St. Petersburg Times, and The Washington Post's Fact Checker, followed four years later.
A recent examination of fact checking from 2003 to 2012 documents the rapid rise of fact checking in newspapers and on fact-checking web sites (Wintersieck and Fridkin Reference Wintersieck, Fridkin and Benoit2016). Fact checking, in addition to increasing exponentially in the last decade, accelerates as Election Day approaches and increases in response to political events, such as debates. Finally, fact checking is no longer limited to political advertisements. Fact checking of speeches, interview statements, and debates has become much more common in recent elections.
David Broder, veteran Washington Post political writer, originally promoted fact checking after the 1988 presidential election. Broder urged reporters to monitor the truthfulness of political advertisements (O'Sullivan and Geiger Reference O'Sullivan and Geiger1995). The first iteration of modern fact checking was the “ad watch” introduced in the 1990 presidential election; the news media began to critique the candidates' advertisements as way of “… inform[ing] the public about claims made that are either exaggerated or false” (Pfau and Louden Reference Pfau and Louden1994, 326).
While the presence of fact checking has ballooned over the last few election cycles, we are just beginning to learn whether fact checking of negative commercials is effective. The effectiveness of “ad watches,” a precursor to the fact check, has been explored experimentally. For example, O'Sullivan and Geiger (Reference O'Sullivan and Geiger1995) expose subjects to an advertisement and an “ad watch” describing the advertisement as accurate or inaccurate. The researchers find that the candidate targeted in the attack advertisement is less likely to be harmed by the advertisement when the advertisement is considered inaccurate, compared to when the advertisement is rated as accurate by the “ad watch” story. Min (Reference Min2002) conducted a similar experiment where subjects are exposed to a newspaper “ad watch” article. All subjects are exposed to either a positive advertisement or a negative advertisement. After reading the text of the advertisement, the subjects read an analysis of the advertisement describing the advertisement as accurate or inaccurate. Min found that when an advertisement is classified as accurate, the advertisement is more effective than when the advertisement is described as inaccurate.Footnote 5
Ansolabehere and Iyengar (Reference Ansolabehere and Iyengar1997) relied on an experiment to examine the impact of a CNN “ad watch” in a series of experiments conducted in 1992. Ansolabehere and Iyengar, utilizing a nonstudent subject pool, expose subjects to (1) an ad watch criticizing a positive advertisement by Bill Clinton, (2) an ad watch criticizing a negative advertisement attacking George Bush sponsored by Bill Clinton, or (3) an ad watch criticizing a negative advertisement attacking Bill Clinton sponsored by George Bush. The ad watch is inserted into a local news broadcast, and subjects are never exposed to the advertisement, only the ad watch. Ansolabehere and Iyengar found increased electoral support for the candidate sponsoring the advertisement criticized by the CNN ad watch. These experimental results suggest ad watches could have an unintended consequence, transmitting the message of the political advertisement being scrutinized. However, the researchers did not compare the impact of the ad watch with the impact of the advertisement. Such a comparison would be far more useful to assess the effectiveness of ad watches since commercials and ad watches are often linked together when presented to citizens.
In a more recent experimental study examining the impact of fact checking on people's perception of negative commercials, Fridkin, Kenney, and Wintersieck (Reference Fridkin, Kenney and Wintersieck2015) found that fact checks significantly affect people's assessments of the quality of negative advertisements. In addition, the content of fact checks influences the likelihood that people accept the claims made in the political advertisements. For instance, people are more likely to believe the claims made in a negative advertisement if these claims are validated by the fact check.
In this article, we look at the impact of fact checking on how men and women react to negative commercials. We know that men and women differ in their views about politics as well as in their views about political strategy (e.g., Herrnson, Lay, and Stokes Reference Herrnson, Lay and Stokes2003; Herrnson and Lucas Reference Herrnson and Lucas2006; Inglehart and Norris Reference Inglehart and Norris2000). Men and women may differ in their willingness to accept fact checking of negative messages. It may be the case, for example, that women are less likely to accept the claims presented in a negative advertisement if fact checking of the advertisement details false claims made in the advertisement. Perhaps men, in contrast, pay less attention to fact checks challenging the claims in negative commercials. If we find that men and women respond differently to fact checking of negative commercials, we may find that the impact of negative advertisement differs for men and women in the electorate.
THEORETICAL EXPECTATIONS
In developing our theoretical expectations, we begin by highlighting a growing body of research showing that women have a stronger avoidance response to negative stimuli than men (e.g., Ahmed and Bigelow Reference Ahmed and Bigelow1993; Kamhawi and Grabe Reference Kamhawi and Grabe2008; Zald Reference Zald2003). According to evolutionary psychologists, human beings are biologically programmed to respond to potential threats to their survival. In responding to these threats, humans can either approach or avoid the situation. According to research in neuroscience and psychology, women exhibit a stronger avoidance response to threat than men do. In evolutionary terms, this is attributed to the fact that the mother's survival is essential to the survival of her offspring, while men's approach response is linked to their need to protect their offspring physically (Kamhawi and Grabe Reference Kamhawi and Grabe2008; Soroka et al. Reference Soroka, Gidengil, Fournier and Nir2014). These gender differences in avoidance of threat may also be reinforced by gender differences in social learning and social roles (e.g., Bandura Reference Bandura1977; Eagly Reference Eagly2013; Wood and Eagly Reference Wood and Eagly2002).
More related to negativity in the political realm, research examining gender differences in attention to negative news shows that women report greater anxiety than men in response to negative news and that women prefer positively framed news stories, while men prefer negatively framed stories (Galician Reference Galician1986; Kamhawi and Grabe Reference Kamhawi and Grabe2008; Pew 2004). For example, Kamhawi and Grabe (Reference Kamhawi and Grabe2008) expose subjects to different combinations of positive and negative news stories and find that male viewers report the highest arousal levels and better memory for negative stories. Women, in contrast, show signs of an avoidance response to negative news, rating positive stories as more arousing and demonstrating greater recall for positive stories.
Moving to negative campaigning, researchers have shown that women in the electorate are less receptive to negative messages. For instance, Kern and Just (Reference Kern, Just and Norris1997) find that women are more likely than men to develop negative views of candidates who are sponsoring negative advertisements. King and McConnell (Reference King and McConnell2003), in a more recent experimental investigation, find that negative campaigning is more likely to produce unfavorable views of the sponsoring candidate for women viewers, but not for men. In their experiment, King and McConnell exposed subjects to either one, two, or three negative advertisements embedded in a popular network television show and examined subjects' evaluations of the sponsor and target of the negative advertisements. King and McConnell find that as the number of negative advertisements increased, evaluations of the sponsoring candidate decreased among women subjects, but the evaluations by male respondents did not suffer the same decline.
Fridkin and Kenney (Reference Kahn and Kenney2004), utilizing survey data and content analysis of television advertising and news coverage, find that mudslinging during Senate campaigns demobilizes women citizens but does not influence turnout levels among men. A more recent study by Fridkin and Kenney (Reference Fridkin and Kenney2011), based on a national representative survey sample, find that women are significantly less tolerant of negative campaign messages when compared to men respondents.
These findings from disparate fields of evolutionary psychology, communication, and political science show that women are more likely than men to dislike or avoid negative stimuli.Footnote 6 Since women are more likely than men to avoid negative information, more generally, and women are less tolerant of negative news and negative campaigning, more specifically, we theorize that men and women will differ in their responsiveness to fact-check messages assessing negative advertisements. In particular, since women like negative commercials less than men, we expect women will be more open to fact-check messages that are critical of negative advertisements. Since people's preexisting attitudes influence how they process incoming information (e.g., Kunda Reference Kunda1990), we expect that women will be more likely to pay attention to information confirming problems with negative advertisements.Footnote 7 That is, women will be responsive to fact-check messages describing the inaccuracies in negative commercials. Therefore, we expect fact-check messages confirming the inaccuracy of a negative advertisement will be more influential for women than for men.
In contrast, when a negative advertisement is described as accurate by a fact check, we expect women to be less likely than men to be influenced by the content of the fact check. Since women are less tolerant of negative advertisements, they will be less accepting of a fact check supporting the claims described in a negative commercial. In other words, women will be less likely to process information conflicting with their preexisting attitude (e.g., women's dislike of negativity). Therefore, we expect that fact checks authenticating the accuracy of a negative message are less likely to persuade women to accept the message of the advertisement, compared to men who are less hostile toward attack advertising.
To summarize, we expect that fact checks detailing the inaccuracies in a negative commercial will be more likely to influence women's assessments of the negative commercial, compared to men. On the other hand, we expect that fact checks confirming the claims in a negative commercial will be more influential for men. In the present study, we rely on a survey experiment to investigate the impact of fact checks on men and women's assessments of negative commercials. We turn next to a discussion of our research design.
METHOD
In our experiment, we examined whether fact checks of actual advertisements running during the 2012 U.S. Senate race in Ohio influence people's impressions of the candidates. We chose the Ohio race between Senator Sherrod Brown (D), a one-term incumbent, and State Treasurer Josh Mandel (R), a rising star in Ohio politics. The contest was competitive; spending by candidates and outside groups reached nearly $80 million (opensecrets.org 2012). Additionally, there was a great deal of negative advertising by both sides. Broadcast stations aired more than 64,000 ads, with the majority of the advertising coming from outside groups: conservative groups like Crossroads GPS to liberal groups such as the Priorities USA.Footnote 8 The Ohio Senate race, like approximately 40% of Senate campaigns, was hard-fought (Kahn and Kenney Reference Kahn and Kenney1999).
In developing the experiment, we relied on two attack advertisements aired during the Ohio campaign: a negative advertisement attacking Sherrod Brown sponsored by the 60 Plus Association and a negative advertisement attacking Josh Mandel developed by Majority Pac. We focused on negative advertisements because journalists are more likely to pay attention to negative advertisements (Geer Reference Geer2012), and fact checks of negative advertisements are much more common than fact checks of positive advertisements (Min Reference Min2002).Footnote 9 We examined negative advertisements from outside groups, compared to the candidates' advertisements, because outside groups spent more money than the candidates in key races, including Ohio's Senate race, during the 2012 election (Keith 2012). Indeed, negative advertisements are much more common from outside groups than from the candidates themselves (Fowler and Ridout Reference Fowler and Ridout2010).
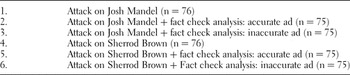
We relied on an Internet survey experiment with a two (i.e., advertisement attacking Brown or advertisement attacking Mandel) by three (i.e., no fact check, accurate fact check, inaccurate fact check) design, producing six experimental conditions. At the start of the survey, respondents were given a brief description of the Ohio Senate race, and then they were directed to click on an Internet link.Footnote 10 Depending on their experimental condition (see Table 1), the respondent saw the advertisement attacking Josh Mandel or the advertisement attacking Sherrod Brown. For respondents in Conditions 2–3 and 5–6, the respondent also read either a fact check claiming the advertisement was accurate or inaccurate. After exposure to the experimental stimuli, respondents were directed to fill out a short questionnaire.Footnote 11
Experimental conditions in Survey Internet Experiment

Total number of subjects = 452.
We took a number of steps to increase the realism of the stimulus. To begin, subjects in the experiment were exposed to actual advertisements from an ongoing senatorial campaign. In addition, we relied on actual fact checks disseminated during the Ohio campaign to create the four simulated fact check articles utilized during the experiment.Footnote 12 Finally, we obtained a large and diverse national sample of respondents instead of using a convenience sample of students.Footnote 13 A total of 452 subjects completed the experiment.Footnote 14 While our sample is more educated than the population, it is representative of the nation in terms of age and gender.
Randomization
All respondents were randomly assigned to one of the six experimental conditions at the start of the Internet survey. There were no statistically significant differences among the six groups in terms of political attitudes (i.e., party, ideology, political interest, and political sophistication) or demographic characteristics (i.e., education, age, and gender).
Survey Questions
Following the introduction of the experimental stimulus, respondents were asked a series of questions assessing their impression of the negative advertisement (e.g., Did you find the advertisement useful?) We also asked questions measuring respondents' evaluations of Brown and Mandel. We gauged respondents' acceptance of the claims made about the candidate during the negative commercials. For example, respondents were asked to indicate their level of agreement with the following statement: “Josh Mandel broke his promise to serve out his four-year term for Treasurer of Ohio when he declared his candidacy for the U.S. Senate.” We relied on standard measures used routinely to assess people's political attitudes (e.g., we relied on the standard American National Election Studies questions to assess people's partisanship, ideology, political interest, and political knowledge).
We also asked respondents a number of questions to ascertain their tolerance of negativity since prior research indicates people with less tolerance toward negativity will be more influenced by negative advertising (Fridkin and Kenney Reference Fridkin and Kenney2011). We rely on a four-item index to assess people's tolerance of negative messages; the intolerance to negativity index has a mean of 11.4 and a standard deviation of 2.7. We turn now to an examination of the results of our experiment by examining people's reactions to negative messages.
RESULTS
Assessment of Accuracy and Usefulness of Negative Messages
We begin our exploration by looking at people's assessment of the accuracy of the negative advertisement. Overall, 18% of the respondents view the advertisements as “not accurate at all,” while 39% of the respondents rate the advertisements as “somewhat accurate,” and 21% classify the advertisements as “very accurate.” People's assessments of the ads' accuracy does not vary depending on whether they watch the advertisement attacking Josh Mandel or the advertisement attacking Sherrod Brown (F = .123, ns). However, people who are exposed to a fact check detailing the inaccuracies of an advertisement are significantly more likely to view the advertisement as inaccurate, compared to people who are exposed to a fact check authenticating the advertisement (2.36 v. 1.67).Footnote 15
To examine how fact checks influence men and women's assessments of negative advertisements, we estimate two OLS regression equations: one for male respondents and one for female respondents.Footnote 16 We include two variables measuring the respondents' experimental condition: (1) people exposed to a fact check authenticating the content of the negative advertisement (i.e., the “accurate” fact check) and (2) people exposed to a fact check challenging the content of the negative messages (i.e., the “inaccurate” fact check).Footnote 17 We control for a number of factors that may affect people's views of the advertisements, such as political ideology, strength of partisan attachment, political knowledge, political interest, and tolerance to negative campaigning.Footnote 18
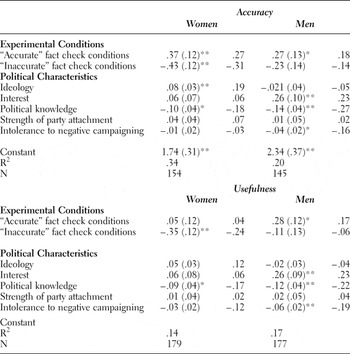
We present the results of the regression equations in Table 2. The fact check documenting inaccuracies in the negative advertisement powerfully influences women's ratings of the negative advertisement's accuracy. Women who are exposed to the “inaccurate” fact check rate the negative advertisement as significantly less accurate than women who are not exposed to a fact check message. In fact, according to the standardized regression coefficients, the variable capturing the “inaccurate” fact check condition is the most powerful variable in the model, more powerful than women's level of political knowledge or women's intolerance toward negativity.
OLS regression predicting accuracy and usefulness of advertisement

Note: The dependent variable, accuracy, is the respondent's assessment of the advertisement's accuracy, ranging from (1) not accurate to (3) very accurate. The dependent variable, usefulness, is the respondent's assessment of the advertisement's usefulness, ranging from (1) not useful at all to (3) very useful. “Accurate” fact check condition is coded 1 for respondents who read the “accurate” fact check (Conditions 2 and 5), 0 for respondents in other conditions. “Inaccurate” fact check condition is coded 1 for respondents who read the “inaccurate” fact check (Conditions 3 and 6), 0 for respondents in other conditions. Ideology is coded from 1 (extremely liberal) to 7 (extremely conservative). Interest is coded from 1 (not much interested) to 3 (very much interested). Political knowledge ranges from 0 to 4. Strength of party attachment ranges from 1 (independent) to 4 (strong partisans). Intolerance to negative campaigning ranges from 4 (high tolerance) to 16 (low tolerance). See Appendix A for exact question wording.
Unstandardized OLS coefficients (standard errors in parentheses), followed by standardized regression coefficients. **p < .01; *p < .05.
Looking at the same model for male respondents, we see that the “inaccurate” fact check fails to significantly influence men's assessments of the accuracy of the negative advertisement. That is, men do not rate the advertisement as less accurate when they are in the “inaccurate” fact check condition, compared to men who received no fact check at all.
While we expect women to be responsive to a fact check questioning the veracity of the claims in a negative advertisement, we reasoned that men may be open to fact checks that authenticate the claims of an attack commercial. According to the results in Table 2, both men and women are influenced by “accurate” fact checks. Fact checks validating the claims made in negative commercials lead both men and women to view the negative advertisements as more accurate than advertisements not subjected to a fact check.
People's views of the usefulness of the advertisement may also be affected by the content of fact checking. In particular, if a fact check questions the truthfulness of an advertisement, we expect people will consider the advertisement less useful. Conversely, if a fact check documents the accuracy of an advertisement, people may view the advertisement as more useful than the advertisement that has not been fact checked. We find that a fact check detailing the inaccuracies in a negative advertisement produces much more negative assessments of the advertisement's usefulness than a fact check authenticating the information in the negative commercial (F = 17.1, p < .01).
As we did earlier, we run regression models for men and women respondents to examine the impact of fact checking on people's assessments of the usefulness of negative commercials (see bottom of Table 2). When assessing the usefulness of a negative commercial, we find that the fact check questioning the truthfulness of the negative advertisement powerfully influences women's assessments. For women, the “inaccurate” fact check produces a negative and significant decrease in people's views of the usefulness of the advertisement. For men, seeing the fact check that illustrates inaccuracies in the negative advertisement does not alter assessments of the advertisement's usefulness. In other words, the “inaccurate” fact check does not significantly influence men's views of the negative commercial's utility.
When we look at the impact of the “accurate” fact check on assessments of the negative advertisement's usefulness, we find support for our original hypothesis. For women, the fact check substantiating claims in the advertisement does not lead women to view the negative commercial as significantly more useful, compared to women who are not exposed to a fact check. However, for men, the “accurate” fact check leads to more positive views of the negative commercial's usefulness. Men who are exposed to a commercial and a fact check authenticating the commercial's claims rate the advertisement as significantly more useful than men who are exposed to only the commercial.
Overall, the results presented in Table 2 show that fact checks challenging the claims of negative advertisements powerfully affect women's views of the accuracy and usefulness of negative advertisements. We find a different pattern for men. Men's views regarding the usefulness and accuracy of negative advertisements are not influenced by fact checks describing the inaccuracies in the advertisement. Instead, fact checks supporting the claims made in negative advertisements consistently enhance men's ratings of the negative messages. Finally, we find women are not impervious to the messages in “accurate” fact checks. When rating an advertisement's accuracy, fact checks substantiating the claims made in negative commercial are influential.
Accepting Claims in Negative Advertisements
Candidates, interest groups, and campaign consultants rely on negative advertising to promote negative views of their rivals. Negative commercials contain unfavorable information about the target, such as questions about the candidate's competence or information linking the candidate with an unpopular policy outcome. If citizens accept the negative information disseminated in the advertisements, the architects of negative advertisements hope citizens will develop more negative impressions of the targeted candidate.
We are interested in examining how the content of fact checks influences the likelihood of accepting the claims disseminated in negative advertisements. Since women are more suspicious about the utility of negative advertisements, we expect that women will be significantly less likely to accept the claims made in a negative advertisement if they are exposed to a fact check questioning the veracity of the advertisement's claims.
In contrast, men are expected to be responsive to negative advertisements when a fact check authenticates the claims in the advertisement. We expect that men will be likely to adopt the arguments made in a negative advertisement when the advertisement is viewed as accurate by a fact check. Women, on the other hand, are skeptical about negative advertisements—in general—and may be less persuaded by negative advertisements, even if the advertisement is accompanied by an accurate fact check.
We examine the link between fact checking and accepting the advertisements' information by examining whether people accept some or all of the claims offered in the commercials. For example, in the advertisement attacking Sherrod Brown, the announcer claims Brown has helped increase the national debt by voting for every bailout proposed by President Bush and President Obama. We ask respondents to indicate their degree of agreement with the statement, “Sherrod Brown is responsible for increases in the national debt.” For each candidate, we asked respondents to indicate their level of agreement with three “factual statements.”Footnote 19
We expect people who are exposed to a fact check confirming the allegations will be most likely to agree with the advertisement's assertions, while people reading a fact check challenging the advertisements assertions will be less likely to agree with the advertisement's assertions. Overall, we find that people's likelihood of accepting the advertisements' claims is powerfully affected by their exposure to the fact checks. Looking at people exposed to the attack on Josh Mandel, people's scores on the nine-point index vary by more than two points, on average, depending on whether people are exposed to the fact check asserting the accuracy of the advertisement versus people reading a fact check challenging the veracity of the statements made in the commercial (i.e., 10.00 versus 7.97).Footnote 20 Similarly, people who are exposed to the advertisement aimed at Sherrod Brown are significantly less likely to agree with the “factual” statements when they are given the fact check disputing the claims in the advertisement, compared to people reading the “accurate” fact check (i.e., 7.15 versus 8.45).
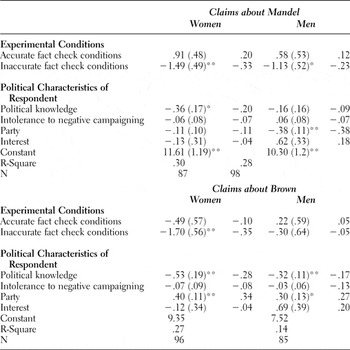
While the presence and content of the fact check clearly influences people's likelihood of accepting the claims in the negative commercials, we expect men to be affected by the “accurate” fact check, while women are expected to be influenced by the “inaccurate” fact check. In Table 3, we look at people exposed to the negative advertisement about Josh Mandel or Sherrod Brown and examine whether the type of fact check affects their willingness to accept the claims made in the advertisement.Footnote 21 In the models presented in Table 3, we continue to control for political knowledge, intolerance to negative campaigning, and political interest. In addition, we control for partisanship since people's attachment to a political party is likely to affect their willingness to accept claims about Republican Josh Mandel and Democrat Sherrod Brown.Footnote 22
OLS regression examining relationship between experimental condition and acceptance of claims made in commercial for men and women respondents

Note: The dependent variable is an index measuring people's acceptance of the claims made about Josh Mandel (or Sherrod Brown). The index for Mandel has a mean of 8.65 with a standard deviation of 8.65. The index for Brown has a mean of 7.83 with a standard deviation of 2.13. Accurate fact check conditions is coded 1 for respondents who read the accurate fact check (Condition 2 or Condition 5), 0 for respondents in other conditions. Inaccurate fact check conditions is coded 1 for respondents who read the inaccurate fact check (Condition 3 or Condition 6), 0 for respondents in other conditions. Interest is coded from 1 (not much interested) to 3 (very much interested). Party is coded as 1 for Democrats and 0 for Republicans. Political knowledge ranges from 0 to 4. Intolerance to negative campaigning ranges from 4 (high tolerance) to 16 (low tolerance). See Appendix A for exact question wording.
Unstandardized OLS coefficients (standard errors in parentheses), followed by standardized regression coefficients. **p < .01; *p < .05.
When we look at the analysis for women respondents, we see that fact checks disconfirming the details presented in the negative commercials significantly depress women's likelihood of accepting the advertisements' claims. Looking at claims about Sherrod Brown, women respondents who are exposed to the “inaccurate” fact check accept almost two fewer claims than women who do not read a fact checking article. Since the dependent variable ranges from 3 to 12, almost a two-point move on this nine-point scale is substantial.
We find the same pattern for women assessing claims about Josh Mandel: women who read the fact check pointing out inaccuracies in the advertisement are significantly less likely to accept the advertisement's claims, compared to women who only viewed the negative advertisement. In both models for women respondents, the “inaccurate” fact check condition is the most powerful variable in the model, according to the standardized regression coefficients.
When we look at men's likelihood of accepting the claims made in the negative commercials, we find the impact of the fact check describing inaccuracies in the advertisements is not always effective. In particular, the likelihood of accepting claims made in the advertisement criticizing Brown is not affected by whether men are exposed to the fact check detailing inaccuracies in the advertisement. Men exposed to the negative advertisement attacking Brown followed by the “inaccurate” fact check are no different than men exposed to only the negative advertisement.
For people exposed to the advertisement attacking Josh Mandel, we find that the “inaccurate” fact check does depress the number of claims that men are willing to believe about Josh Mandel. On average, we find that men who view the advertisement and then read the fact check refuting details in the advertisement accept about one fewer claim, compared to men who are simply exposed to the negative advertisement.
Contrary to our expectations, we do not find that fact checks documenting the accuracy of an advertisement significantly alter men's likelihood of accepting the claims made in the advertisements. In fact, we find fact checks substantiating the assertions made in the negative advertisements do not affect people's likelihood of accepting the assertions made in negative advertisements. In each of the four models in Table 3, people receiving the accurate fact check are no more likely to accept the claims in the negative commercial, compared to people who do not read a fact check.
Overall, the results suggest that fact checking can affect people's willingness to believe the claims in negative commercials. We find women are significantly and consistently receptive to the evidence presented in fact checks challenging the veracity of the claims made in negative commercials. Fact checks disconfirming the assertions made in negative advertisements are not always influential for men.
CONCLUSION
Gender differences in political attitudes have been documented for well over a quarter of a century. Men and women differ in their partisan affiliation, their preference for candidates, their views on issues, and their likelihood of participating in politics. In this paper, we demonstrate that men and women in the electorate differ in their receptivity to fact checking of negative commercials. Women, who are significantly less tolerant of negative campaigning, when compared to men, are responsive to fact check messages questioning the validity of the charges made in negative commercials. Women are likely to view negative commercials as less useful and less accurate when they are exposed to a fact check challenging the facts presented in an attack advertisement. Perhaps more importantly, women are also less likely to believe the claims in negative commercials when they view a fact check challenging the advertisement's claims. Men, in contrast, are less likely to be influenced by fact checks refuting the assertions made in a negative commercial.
The findings in this article are based on a single-shot survey experiment focusing on two negative advertisements aired during a competitive senate race in Ohio. Our study represents a first look at the impact of fact checking on men and women's reaction to negative advertising. We urge researchers to begin to look more extensively at how men and women react to fact checking in different types of contests, with different candidates, in different locales, and different levels of office.
For example, scholars can look at how the gender of the candidate may affect men and women's reactions to fact checking of attack advertising. While women citizens are less tolerant of negativity in general, are women more tolerant of negativity when the attack is launched by a woman candidate? If this is the case, perhaps women in the electorate would be more responsive to fact checks authenticating the claims in negative advertisements when these advertisements are sponsored by women candidates. On the other hand, women's intolerance to negativity may be impervious to the gender of the candidate. Women may respond more strongly to fact checks describing falsehoods in negative advertisements, even when women candidates sponsor these negative advertisements.
Furthermore, looking at the impact of fact checking on men and women's views of candidates can be examined outside of the laboratory. For example, a large representative sample of voters can be contacted during a campaign with voters being exposed to commercials currently being aired in their states, along with varying fact check messages. With such a study, scholars can see if men and women respond differently to negative commercials—and fact checks of these commercials—in actual campaigns in real time.
In addition, the impact of fact check messages for men and women in the electorate may vary with the level of the election. We expect that fact checks are likely to be more powerful in races for the U.S. House of Representatives than in presidential elections. In lower-level races where people have less information about the competing candidates, people will be more open to information, and attitudes will be more malleable. In races for president, on the other hand, voters are likely to have more developed attitudes about the presidential rivals, and, therefore, voters may be more likely to engage in motivated reasoning (Kunda Reference Kunda1990) and may be less likely to be affected by fact checks that disconfirm their preexisting attitudes. By looking at the impact of fact checking in different types of races, we can see if women's greater susceptibility to fact checks disconfirming the details of negative advertisement persists in all types of elections.
Overall, our findings suggest that fact checking can diminish the impact of negative advertising. If campaigns decide to air negative messages, fact checks challenging the veracity of the advertisements' claims can severely undermine the message—especially for women. Given the growing pervasiveness of fact checking, as well as the disproportionate amount of fact checking of negative messages (Wintersieck and Fridkin Reference Wintersieck, Fridkin and Benoit2016), campaign architects need to think carefully about their use of negative campaigning. At the very least, given the consistent and significant impact of fact checks highlighting the inaccuracies in negative advertisements for women, candidates and their campaigns may want to refrain from airing attack advertisements that are targeted at women in the electorate. Or, if campaign strategists insist on aiming negative commercials at potential women voters, they should make sure the facts in these messages are beyond reproach.
SUPPLEMENTARY MATERIAL
To view supplementary material for this article, please visit http://dx.doi.org/10.1017/S1743923X16000076.