




Policy significance statement
The findings from this article highlight that, contrary to tangible assets, capabilities cannot be outsourced and need to be built “like a muscle.” Practitioners and officials who wish to improve data usage in their teams and organizations should therefore dedicate attention and energy to building this muscle internally. The article provides key insights for practitioners seeking to invest in data capabilities by providing a concrete data-related vocabulary that they can use in their day-to-day work, and by highlighting key resources and leadership traits and actions that are needed to support teams in their journey to becoming more data-informed.
1. Introduction
So it’s a hot night in July, it’s 10 o’clock at night and your child cannot sleep. You cannot open the window, cuz it was shot and got sealed. So you take your child outside and he’s shot and killed. And two weeks ago you called the city cuz there was gang activity on your street. And four weeks ago you called the city cuz the street light in front of your house wasn’t working. And five weeks ago you called the city cuz the window would not open.
That actually happened in our city. We have disparate data sets across the city that do not come together and do not paint the picture that do help us target what we need to target. (Interview C3)
The ability to collect, process, integrate, and act upon data can save lives. This may sound dramatic, but it is exactly what we heard from public officials that we interviewed for this research.
The impact of public data use on citizens’ lives has made data-informed governance a subject of academic (Ranchod, Reference Ranchod2020; Puttick et al., Reference Puttick, Fiedler and Park2022; de Jong et al., Reference de Jong, Fernandez-Monge, Mayne and Vachon2025) and practitioner (OECD, 2019; World Bank, 2021) interest. Both scholarship and practice recognize the importance of data for achieving critical public value outcomes: more effective services, more efficient use of resources, more equitably distributed benefits, and increased transparency and accountability of government action (World Bank, 2021; de Jong et al., Reference de Jong, Fernandez-Monge, Mayne and Vachon2025).
Despite this recognition that data matter for public problem solving, academic research squarely focused on the enabling conditions for data use in the public sector is still nascent. Research exploring the use of data for specific purposes, such as better targeting of public services, often makes tangential references to the role of data capacity in achieving desired outcomes (Allard et al., Reference Allard, Wiegand, Schlecht, Datta, Goerge and Weigensberg2018; Robb et al., Reference Robb, Diaz Amigo, Marcoux, McAteer and de Jong2022; Danemayer et al., Reference Danemayer, Young, Green, Ezenwa and Klein2023; Liiv et al., Reference Liiv, Verhulst, Tauchnitz, Giovanardi, Nicolaïdis and Wählisch2025). Increasingly, however, scholars have sought to understand these conditions in a more systematic way. Two main approaches can be found in this scholarship. On the one hand, some studies focus on measuring governments’ “organizational readiness” to use (Klievink et al., Reference Klievink, Romijn, Cunningham and de Bruijn2017), manage (Thomas et al., Reference Thomas, Cipolla, Lambert and Carter2019), or publicly release data (Zhao and Fan, Reference Zhao and Fan2021). On the other hand, other studies investigate individual-level competencies and behaviors associated with the effective interpretation of data and making decisions with data (Christensen, Reference Christensen2018; Cantarelli et al., Reference Cantarelli, Belle and Hall2023; Lerusse and Van de Walle, Reference Lerusse and Van de Walle2023).
Despite the significant progress made by existing research, in this paper we explore what we view as the still understudied “missing link” between tangible organizational resources and individual human factors: namely, capabilities. We define capabilities as coordinated and habituated patterns of action through which groups of humans activate tangible assets (Helfat and Peteraf, Reference Helfat and Peteraf2003) to generate knowledge and insights from data. Understanding how individuals collectively—and not just individually—gather, process, share, and use data (OECD, 2019) can provide additional, and often crucial insight into public entities’ ability to leverage data effectively. In doing so, capabilities provide the connective analytic tissue between the organization and the individual.
Scholars studying data use in the public sector have pointed to the role played by capabilities when discussing the importance of standards for data sharing (Tulloch and Harvey, Reference Tulloch and Harvey2007; Gil-Garcia and Sayogo, Reference Gil-Garcia and Sayogo2016) or formal processes that aim to institutionalize data behaviors (Kim and Lee, Reference Kim and Lee2006; Yang and Maxwell, Reference Yang and Maxwell2011; Janssen et al., Reference Janssen, Konopnicki, Snowdon and Ojo2017). Other studies explicitly highlight the importance of data-related routines (Giest, Reference Giest2017; Allard et al., Reference Allard, Wiegand, Schlecht, Datta, Goerge and Weigensberg2018; Fusi, Reference Fusi2021) and informal rules (Ruijer et al., Reference Ruijer, Détienne, Baker, Groff and Meijer2020; Ruijer and Meijer, Reference Ruijer and Meijer2020), organizational inertia (DellaVigna et al., Reference DellaVigna, Kim and Linos2024), or even collective attitudinal factors such as public officials’ values (Gil-Garcia and Sayogo, Reference Gil-Garcia and Sayogo2016) and mindsets (Redden, Reference Redden2018; Ranchod, Reference Ranchod2020).
None of the above studies, however, has made the study of these capabilities the central object of investigation. We address this gap with an empirical study of the data capabilities developed by three city teams tackling the same urban challenge: property distress and abandonment. We focus more specifically on the following research questions: (i) what are the capabilities that teams use and develop within city halls to collect, process, share, and use data? (ii) how do these capabilities affect teams’ self-reported ability to tackle problems more effectively? And (iii) what additional factors help or hinder teams’ development and use of these capabilities?
Our analysis of interviews with public officials from these three city teams shows that data capabilities consist of formal processes, habituated routines, and attitudes of groups of individuals. These capabilities activate the tangible resources, in the form of skills and technologies, that teams can leverage to collect, process, and use data to tackle public problems. Our findings confirm the value of capabilities for better understanding how data are collected, processed, and used that organizational accounts of capacity or studies around individuals’ behaviors fail to grasp. They also show how certain resource endowments and elected-administrative leadership dynamics can enable—but also constrain—teams in their journey to becoming more data-informed.
In the Discussion section, we bring together these findings into a conceptual framework that can help future researchers seeking to investigate this topic across teams and across public-sector organizations. By bridging the existing gap between the organization and the individual, this article connects two broader approaches in public administration scholarship identified by Moynihan (Reference Moynihan2018): a macro focus on state capacity and a micro approach to studying the psychology of administrative behavior. Finally, by shedding light on the role of political and executive leaders in building data capabilities, this research also provides valuable guidance for public officials and their partners.
2. The “missing link” in the study of data-informed governance
Scholars across multiple lines of inquiry and disciplinary perspectives have examined the potential of data to improve government functioning. In policy and public administration, one important precursor is the incorporation of evidence-based practices in public policy (Jennings and Hall, Reference Jennings and Hall2012). This approach seeks to use data collection and analysis techniques to inform the design and evaluation of public policies (Head, Reference Head2016). In addition, public management scholars, particularly those studying performance management, have investigated how the use of data to monitor and assess programs has affected organizational behaviors, decision-making, and outcomes (Moynihan, Reference Moynihan2008; Moynihan and Pandey, Reference Moynihan and Pandey2010).
More recently, the open data movement has emphasized the need to release data collected by governments with the expectation that this will increase transparency and accountability of public action, as well as foster innovation (Attard et al., Reference Attard, Orlandi, Scerri and Auer2015; Safarov et al., Reference Safarov, Meijer and Grimmelikhuijsen2017; Mergel et al., Reference Mergel, Kleibrink and Sörvik2018). In the last decades, debates about data in the public sector have focused on the potential of large amounts of data, big data (Desouza and Jacob, Reference Desouza and Jacob2017; Pencheva et al., Reference Pencheva, Esteve and Mikhaylov2020), and the algorithms used to interpret and apply big data in public processes and services (Snow, Reference Snow2021). An increasingly important concern within this body of work has been the ethical and governance dilemmas posed by these emerging technologies (Verhulst, Reference Verhulst2021; Grimmelikhuijsen and Meijer, Reference Grimmelikhuijsen and Meijer2022; Soares et al., Reference Soares, Grimmelikhuijsen and Meijer2024). Finally, and cutting across these different lines of research, scholars and practitioners have also paid attention to the role of cross-sectoral collaboration in unlocking the potential value of data for both public and private organizations (Dawes et al., Reference Dawes, Cresswell and Pardo2009; Kettl, Reference Kettl2016; Susha et al., Reference Susha, Rukanova, Zuiderwijk, Gil-Garcia and Gasco Hernandez2023).
Across the data-informed governance literature, a common theme is that certain conditions enable the public to use data to achieve desired public outcomes (Mayne et al., Reference Mayne, de Jong and Fernandez-Monge2020; de Jong et al., Reference de Jong, Fernandez-Monge, Mayne and Vachon2025). While the study of these enabling conditions remains fragmented, often mentioned in passing in articles studying a particular data use, scholars have started to focus on data capacity as a central topic of study. Among these, we can distinguish two main approaches to studying the nature of the conditions associated with leveraging data for public action: one centered on organizations and another focused on individuals.
From an organizational perspective, a small set of academic articles has been published in recent years with the explicit goal of conceptualizing and measuring organizational data capacity. Zeleti and Ojo (Reference Zeleti and Ojo2017) developed a framework to assess the open data practices of the Marine Institute in Ireland. Taking this organization as their unit of analysis, they measure the technological tools, working processes, and staff skills developed to release open datasets. Zhao and Fan (Reference Zhao and Fan2021) also analyzed a set of factors—technical capacity, organizational structure, basic resources, awareness, among others—that shape the open data capacity of government agencies in Shanghai. Rather than focusing on open data, Thomas et al. (Reference Thomas, Cipolla, Lambert and Carter2019) examined enterprise-wide internal data management practices in 15 US government agencies using the Data Management Maturity reference model framework. Finally, using the concept of “organizational readiness,” Klievink et al. (Reference Klievink, Romijn, Cunningham and de Bruijn2017) developed a framework to assess public entities’ ability to use big data and applied it in the Dutch public sector.
These studies tend to emphasize the role of organizational structures and tangible resources that are associated with data capacity. One of the benefits of this approach is that these kinds of resources can be measured and compared across organizations and over time within the same organization. By contrast, one limitation of this approach is that it tends to overlook the fact that, ultimately, data capacity hinges upon people, often working together, collecting, sharing, and making sense of data. Some of these articles mention non-tangible aspects such as staff awareness and organizational culture (Zhao and Fan, Reference Zhao and Fan2021) or internal and external attitudes toward big data use (Klievink et al., Reference Klievink, Romijn, Cunningham and de Bruijn2017). Zeleti and Ojo (Reference Zeleti and Ojo2017: 346), in particular, highlighted the need to identify the collection of structured activities or tasks to produce a service and the way in which people work together to accomplish a task. None of these studies, however, provides an empirical assessment of these collective actions, coordinated tasks, and working processes; instead, they are identified as existing at the organizational level and described at a high degree of abstraction.
At the other end of the spectrum, practitioners and scholars have studied individual-level competencies and behaviors that shape how public officials, from elected leaders to frontline staff, incorporate data into their work. Professional associations and international organizations have developed data competency frameworks with different degrees of specialization. For example, the Canadian School of Public Service has released a Data Competency Framework (2023), the United Nations has published a competency framework for big data (2020), and the National Health Service in England has developed its own national competency framework for data professionals in health and care services (2026). On the academic front, a recent systematic synthesis of 162 studies on information use in public administration and policy found that cognitive biases such as accessibility, loss aversion, or framing effects impact how information is used by government officials (Cantarelli et al., Reference Cantarelli, Belle and Hall2023: 1673). In other cases, elected officials’ use of data is explained by politically motivated behaviors that lead, for example, to a preference for quantity indicators to assess infrastructure projects versus quality indicators when evaluating educational programs (Avellaneda et al., Reference Avellaneda, Bello-Gomez and Olvera2025). Skills and literacy also matter. Ballard (Reference Ballard2020) studied US local and county public health managers and found that graphically displayed information increases public managers’ data usage intention. Based on these findings, the author suggested that data visualization literacy should be considered when examining the key causes of the data adoption gap by public officials (Ballard, Reference Ballard2020: 121).
Studies of individual-level factors shaping public officials’ use of data have received a methodological boost by advancements in behavioral science and experimental designs. In their review, Cantarelli et al. (Reference Cantarelli, Belle and Hall2023: 1673) found that 30% of articles adopt behavioral public administration as their methodological approach. This body of research has substantially increased our understanding of how data are used in government settings. The reliance on individual-level data, however, is problematic as effective data use is unlikely purely a function of staff or leaders’ particular skills or dispositions. Effective data use is also shaped by collective arrangements encapsulated in the routines, and coordinated actions of an organization or a team (Mayne et al., Reference Mayne, Fernandez-Monge and de Jongn.d.).
As a result, the literature lacks focused empirical studies of the coordinated tasks and collective behaviors that enable groups of people to leverage data to achieve public outcomes. There are, for sure, numerous references to these collective practices and processes peppered across existing work. For example, authors interested in understanding data sharing have pointed to routines (Fusi, Reference Fusi2021) and attitudes, such as interpersonal trust (Dawes et al., Reference Dawes, Cresswell and Pardo2009; Chen and Lee, Reference Chen and Lee2018), as key factors influencing data exchange between organizations. Integrating big data into existing routines has also been found to be challenging for many public entities (Giest, Reference Giest2017). In some cases, this reflects the difficulties of weighing privacy and ethical risks (Ranchod, Reference Ranchod2020). Scholars also note that public employees’ risk aversion or an organizational risk-averse culture in governments may create barriers to the adoption of data use (Wirtz et al., Reference Wirtz, Piehler, Thomas and Daiser2016; Janssen et al., Reference Janssen, Konopnicki, Snowdon and Ojo2017). This absence or weakness of a “data culture” is further aggravated by a lack of “strategic orientation” when using data, specially in medium-sized and smaller cities or those with persistent organizational challenges (Ranchod, Reference Ranchod2020). City governments have also displayed heterogenous approaches to data within organizations, with practices related to generating, capturing, and analyzing data localized in a few departments (Chatfield and Reddick, Reference Chatfield and Reddick2018). These findings highlight the critical importance of capabilities; yet, to date, they have not been empirically studied in a focused way.
Building on existing research, we empirically investigate how formal and informal practices and attitudes manifest in groups of people applying data to tackle a public challenge. Our unit of analysis is not the whole organization, but instead three cross-departmental city teams using data to tackle a specific public problem: property distress and abandonment. Also, and contrary to most existing work, we do not solely study the use of data for decision-making. We explore capabilities as they relate to other tasks along the data value cycle (OECD, 2019), such as data collection and processing as well as data sharing within and across city departments.
3. Methods
3.1. Case selection
Given that research in this area is nascent (Edmondson and McManus, Reference Edmondson and McManus2007), we followed an exploratory case-study research design to investigate our questions (Yin, Reference Yin2018). We purposively selected three cross-departmental city teams from a pool of nine US cities participating in a two-year state-funded program to tackle property distress and abandonment. This is a complex public policy issue with deep ramifications for local communities, including increased crime (Kondo et al., Reference Kondo, Keene, Hohl, MacDonald and Branas2015) and public health risks (Jay et al., Reference Jay, de Jong, Jimenez, Nguyen and Goldstick2022; Robb et al., Reference Robb, Ahmed, Wong, Ladd and de Jong2024).
Our case selection was guided by a theoretical replication logic (Yin, Reference Yin2018: 55). This approach entails replicating the same analysis in different settings to identify what variations may explain differences in results: in this case, differences in the capabilities developed by the teams, the conditions that shaped these capabilities, and their effects on teams’ ability to tackle the same public problem. Accordingly, from the pool of nine city teams, we selected three teams: one scored above-average, one average, and one below-average on data capacity in a rating exercise performed by key informants from the program management team. The key informants were two program managers who had weekly calls with all city teams. Data capacity was assessed separately by key informants using a common rubric created by the research team to capture each city team’s ability to use data to tackle distressed and abandoned properties. To preserve anonymity, we refer to each city team by a letter: A, B, and C.
A further methodological advantage of selecting teams from this pool was that, as part of the program, all city teams received public funding through competitive grants as well as additional technological resources and technical assistance. The program was funded by a US state government, and the competitive grants were awarded with input from the academic institution where the authors are affiliated. Each of the teams received access to a software tool capable of integrating data to perform a diverse set of analyses. The program also provided support to fund additional staff positions in participant cities. Holding these tangible resources relatively constant allowed us to focus more precisely on the development and role of intangible conditions, centering our analysis on how teams with similar resource endowments diverged in their capabilities.
All teams had members with different seniority and technical skills, ranging from department heads to community development experts and data analysts. Some of the team members had technical backgrounds in technology and data, but others were field inspectors or community managers. Data capabilities were therefore not measured by looking at the practices of centralized IT or data units only, but by exploring the practices described by the groups of people directly engaged in tackling property abandonment and distress. These teams were responsible for implementing a series of interventions, supported by the program.
One of the members of the research team for this study actively participated in the design and implementation of the program. This engagement provided institutional access to information and interviewees.
3.2. Interviewing and coding
The main data source for this research was eight semistructured interviews with nine members of the three city teams. The protocol for these interviews was informed by existing research and structured around open questions (see Appendix A) to enable the exploration of how and why questions (Yin, Reference Yin2018: 118). Two members of the research team conducted the interviews, which lasted, on average, one hour and were video-recorded and fully transcribed.
We employed a hybrid coding approach that combined deductive and inductive thematic analysis (Boyatzis, Reference Boyatzis1998). Building on existing research, we identified broad themes to guide our coding: constitutive elements of data capabilities, relevant skills and leaders’ approach to data, enabling conditions, and capabilities’ effects. We supplemented this deductive approach based on pre-set themes with a more inductive and open thematic coding process. The goal of this inductive coding was to provide a more complete characterization of data-related capabilities as well as their determinants and effects. The open coding process also allowed us to identify subthemes within some of the themes. The first-order concepts that emerged from the inductive analysis of the transcripts formed the codes. We then applied axial coding techniques to identify common patterns to cluster and regroup these codes into higher-order subthemes and themes that did not overlap with the pre-set themes (Gioia et al., Reference Gioia, Corley and Hamilton2013). The initial codebook, as well as an illustration of its evolution during the inductive coding, including examples of the codes, can be found in Appendix B (see Tables B1 and B2). While the coding approach was developed by the research team, only one member coded all the transcripts.
We complemented this manual coding approach with Artificial intelligence (AI)-based experimental coding. This involved a mixed deductive and inductive coding approach informed by research on generative AI-based qualitative coding (De Paoli, Reference De Paoli2024; Naeem et al., Reference Naeem, Smith and Thomas2025). This is a nascent methodology, so we built on and adapted existing guidance on prompt crafting to develop our own set of phased prompts (see Appendix C). This complementary coding process had two phases. First, a deductive phase of the coding was based on the same themes that formed our initial codebook for the manual coding. Second, we requested the Large language model (LLM) to derive additional codes, as well as themes and subthemes, inductively. We used OpenAI’s GPT5 Pro model to code de-identified transcripts.
The AI-generated output mostly focused on describing capabilities as coordinated practices to perform a task (e.g., integration and linkage: bringing together city, county, nonprofit and survey data at the property level or governance and quality: standards and routines that preserve data quality and lineage [checklists, ownership, maintenance]). These were complementary concepts related to data capabilities, so we combined the manual and AI-coding to distinguish two critical aspects of capabilities: (i) constitutive elements (what capabilities are made of) derived from manual coding and (ii) functional elements (what capabilities seek to perform: the ability to integrate data sources or to preserve data quality) generated through AI coding. The AI coding outputs, including the code databases and full codebooks, are available upon request.
Once coding was completed, we elaborated memos with the findings for each of the city teams. These memos were structured around the three research questions. In addition, we included a cross-case comparison to distill similarities and differences across the three cases (Yin, Reference Yin2018) and, based on this, developed a conceptual framework. We did not use any AI tool to conduct the conceptualization and writing phases (Naeem et al., Reference Naeem, Smith and Thomas2025). Both the within-case and cross-case findings were discussed and iterated by the research team before reaching the final output presented in the following section.
4. Findings
4.1. City A team
4.1.1. What are the capabilities that teams use and develop within city halls to collect, process, share, and use data?
According to interviewees, this team incorporated data into existing processes in a relatively formal way. For example, a senior manager explained how data are fundamental to “how they [the team] orient themselves towards their workflow” (Interview A1). Sometimes this means formalizing protocols for data entry or establishing specific reporting practices (Interview A2). Yet, this formalization was not always easy since getting people to follow protocols for data entry to ensure quality is often “an uphill battle” (Interview A1).
Formal processes and workflows around data were complemented by routines, such as weekly team meetings where data were discussed, but also regular check-ins with the mayor, who constantly asked for data to track progress (Interview A1). Another important routine established by this team were regular “show and tells” to which the team leader would invite other teams and departments (Interview A2). Sometimes this routine included doing some data work for other departments to demonstrate the value of the data for their own purposes and projects (Interview A2).
This example pointed to the importance of the collective aspect of data use related to forging relationships to facilitate interdepartmental data sharing and to leverage different data sources to tackle specific challenges. This also connects with something that was repeatedly mentioned by interviewees: the role of attitudes such as awareness of the existence of data and its value, excitement about its potential, and the need for team members to be “creative” (Interview A2) and “a bit idealistic” (Interview A1). At the same time, interviewees recognized that it is not uncommon to meet colleagues who are unwilling to adapt, and who find it hard to use data if it involves changing habits (Interview A2).
4.1.2. How do these capabilities affect teams’ self-reported ability to tackle problems more effectively?
Interviewees described how enhanced data capabilities enabled them to “come up with practical solutions” but also to “get ahead of the game of larger issues” (Interview A2). Being capable of integrating data from different departments also provided a solid basis to align goals across organizational boundaries (Interview A1). In addition, the team used data to communicate with the community and to inform decisions, for example by providing a more accurate account of vacant buildings in the city. Thanks to a new tracking system that linked complaints to properties, the team was able to identify a previously unnoticed problem: landlords who were serving eviction notices but were not responding to tenants’ complaints about basic repairs. The team was in turn able to address abuses by landlords in a coordinated way to stop unfair evictions (Interview A1).
4.1.3. What additional factors helped or hindered teams’ development and use of these capabilities?
In general, interviewees recognized the need for skills, both technical skills around data analysis as well as subject matter expertise to interpret data and apply the resultant insights to policy and public problems. This combination of skills in a cross-functional team was highlighted by all interviewees from this team.
Another critical factor “external” to the team but crucial for its development and use of data capabilities was leadership. Here, interviewees pointed to the complementary roles played by the mayor and a senior department head. The mayor was a “source of inspiration” through their personal commitment to data (Interview A1) but also motivated the team by asking for data during meetings and making them accountable for backing up all their claims with data (Interview A2). The department head also played a key role in assembling a cross-functional team that combined data-skilled members and different subject matter experts and helping the team navigate the bureaucracy to access data and ensure collaboration with other departments (Interview A1).
4.2. City B team
4.2.1. What are the capabilities that teams use and develop within city halls to collect, process, share, and use data?
Interviewees from this team described a context where behaviors around data were mostly ad hoc, and, in the words of one interviewee “without a rigorous process” (Interview B3). Another interviewee described how they approached data updating on a needs-base “it’s not like we’re linked to their [system]. You gotta kinda stay on top of it, quarterly or whatever, reach out to people and say, Hey, can you send me another shape file?” (Interview B1). While formalization was therefore low, the team did mandate that colleagues use a data-analysis software to inform code-enforcement, so there was a degree of obligation to overcome potential resistance “I don’t know if they’re excited to have the data, but I think a lot of it is, no, they don’t have a choice. This is the way we’re gonna do it” (Interview B1).
The team had not developed strong routines around data, for example by establishing regular meetings or discussions where data were being used to inform programming decisions (Interview B2). The only clear operational routine regarding data related to the use of information on properties for code enforcement operations: “I give the guys [code enforcement officers] a list-off from the data that is submitted in the [new data platform], and we go from there and it’s been working out great” (Interview B1). Outside this and a few other examples, data collection and use seemed barely routinized in the team.
Despite this lower routinization and formalization, interviewees expressed excitement and a willingness to use data, bringing others along. This behavioral change happened through a combination of persuasion and more direct mandating. “Oftentimes I am pulling data or pulling information for some of my staff if they don’t know how to access or get to it” explained one of the interviewees (Interview B2), while another official described a situation with other team members “they don’t come to me and say, wow, this is awesome. … But if I walk out into their offices on any given day, I see the software up on at least one of the computers, or they’re asking questions” (Interview B1).
4.2.2. How do these capabilities affect teams’ self-reported ability to tackle problems more effectively?
In a context characterized by lower formalization and higher dependence on a few enthusiastic team members, this city team was able to leverage data to make operational improvements, especially given its low data use prior to participating in the program. For example, by the end of the two-year program the code enforcement team were regularly using granular data on property status to prioritize inspections. They were using historical records in each property to engage with property owners and find solutions to emerging disputes. One of the interviewees also described how they uncovered a fraudulent use of single- and two-family houses for rentals through a data-analysis exercise “That was huge to us. That has been one of the major things that we have got out of using data” (Interview B1). The uses of data described by this team were, however, significantly thinner than those of the other two city teams, both in terms of the breadth of use cases and the sophistication of their analyses.
4.2.3. What additional factors helped or hindered teams’ development and use of these capabilities?
A distinguishing characteristic of this team was their clear reliance on an outside vendor for many data-related tasks, including the integration of datasets into a data visualization software and the extraction of data to create reports. Most team members lacked technical skills beyond those required for basic data analysis and use of the software. Given the small size of the team’s home city administration and its limited resources, they found that the current situation was fit for purpose (Interviews B2 and B1).
In addition to the support of this outside vendor, interviewees mentioned the role played by a former department head and the current mayor in supporting the team’s use of data. The former department head was described as “a big drive” (Interview B1) in the use of data: “because of his enthusiasm and his engagement with it, we ended up doing a lot more with it, and kind of getting over some of the hurdles that may have been there in the beginning” (Interview B2). The mayor also supported the team by “pushing the agenda” and “establishing the strategy” (Interview B3). Though the mayor was not portrayed as someone who would use data regularly, they did support the team by establishing key relationships with county officials to ensure data sharing, which became critical for tackling abusive practices by certain landlords who were acquiring houses in county tax auctions (Interviews B1 and B3).
4.3. City C team
4.3.1. What are the capabilities that teams use and develop within city halls to collect, process, share, and use data?
When describing their capabilities, members of this team, particularly those from the city’s centralized data department, emphasized the importance of creating data catalogues, clear data stewardship functions, and conducting regular audits of data quality (Interview C1). Increasing the adoption of data use also involved mapping and changing processes to identify ways in which data could be incorporated into existing processes (Interview C1). This showed not just a more formal approach to data use (including a belief in the power of formalization of new rules and processes to change existing practices) but also an approach directed at formalization that was more systematic in nature. Interviewees, however, recognized that this effort to formalize how data is used along the data value chain was an ongoing effort: “there’s some basic hygiene around data that I think could be principles, practices, and city policies that just are not articulated yet” (Interview C3). In some cases, interviewees described informal workarounds that they had to design to be able to collect data and use it given the lack of adequate technology and processes (Interview C2).
The team also developed routines around data that shaped their ability to activate specific assets such as software programs and tools. As one interviewee articulated “if people were just doing that [using excel and power BI] on a more regular basis, [they would be] building up the muscles they need to eventually be doing the harder things” (Interview C1). Some of the interviewees also explained how they regularly and intentionally reach out to other colleagues to shape the organizational culture, making data use “more the norm across the roles and less the exception” (Interview C2).
Finally, another critical component of data capabilities, namely, team members’ attitudes toward data, emerged from the interview data. Some of the team members who were more seasoned with data use always made sure to provide ongoing support and positive feedback, so that others did not lose their enthusiasm (Interview C1). Other interviewees mentioned the need of staying creative and avoiding punitive interactions (Interview C2). Strengthening capabilities also involved convincing people to change their old ways of doing things (Interview C4), including helping colleagues to move away from operating mainly “on instinct” to “operating on data” (Interview C3). Several interviewees mentioned that this work to change attitudes and overcome resistance demanded negotiation and conflict resolution and could be “exhausting” (Interview C4) and “tough” (Interview C3).
4.3.2. How do these capabilities affect teams’ self-reported ability to tackle problems more effectively?
Members of this team shared multiple examples of how their investments in building data capabilities were paying off. For instance, they were using data to directly inform their new strategy for dealing with rental permits (Interview C3) and to build a property manager scorecard to inform citizens and future tenants of the track record of existing property managers with code enforcement (Interview C2). They were also starting to use data and integrate different datasets to provide better services to residents (Interview C3) and to communicate with citizens and stakeholders about decisions but also to share evidence of changes and impacts in the city. As one interviewee noted, “we can prove [changes resulting from the government’s actions] by what we’re showing with the numbers” (Interview C4).
4.3.3. What additional factors helped or hindered teams’ development and use of these capabilities?
This team pointed to the general lack of technical and data-related skills as a hindrance to strengthening their data capabilities. This was partly attributed to the overall age of the workforce and to problems with job descriptions and hiring rules (Interviews C1 and C3). Interviewees also mentioned their city’s outdated technology system, which runs on a decades-old mainframe (Interview C2) as well as paper-based processes (Interview C3) as significant challenges that the team had to face.
Despite this sometimes “frustrating environment” (Interview C3), the team remained committed to developing and using their capabilities effectively primarily thanks to the drive and support of a senior executive leader. All interviewees underscored the role played by a senior official, who had an “unmatched energy level and drive” (Interview C4) and “placed a really, really, really high importance” on using data (Interview C3). This leader had assembled a data-focused team (Interview C2), used data regularly himself (Interviews C4 and C3), and was able to “drag” others along (Interview C4).
The leadership exercised by this senior official was complemented by clear support from the mayor, who understood and appreciated the value of data (Interview C1 and C2) and was able to articulate the value of data in a way that connected with citizens’ needs and experiences (Interview C3). Interviewees explained how the mayor had made the case for certain initiatives and strategies and communicated it so that the importance of data “propagated through the middle and bottom of the organization” (Interview C2) and “drove down through the ranks” and across silos (Interview C4).
4.4. Cross-team synthesis
Through our analysis of the interviews, we identified three main factors that shaped how teams were able to put existing skills to use and get the most out of available tech tools to generate value from data in the service of tackling problem properties. These include (i) the formalized guidelines that establish how tasks ought to be performed (e.g., data collection protocols or data-quality audits); (ii) the habituated collective actions of the team (e.g., “show and tells” or regular data check-ins); and (iii) team members’ shared beliefs about data but also their affective orientation toward data, the value of data, and how data can and should be used (e.g., collective enthusiasm about the potential of data or a shared commitment to incorporating data into discussions and decision-making processes).
These capabilities were directed at performing a set of tasks along the data value cycle. For example, city teams had to collect data and share it to enable the combination and integration of datasets from multiple departments. They also had to establish routines that involved using data in new ways to identify properties that were prioritized for inspection (in city team B) or for proactive demolition (in city team A). Other critical abilities involved the development of checklists or establishing routines to onboard other actors and diffuse data adoption to other departments.
Not all the teams showed the same level of formalization and routinization, however. The team in city B had few formalized processes and habituated routines around data. Its ability to collect, process, and use data mostly depended on a few members’ attitudes and enthusiasm that was then instilled in others. This approach to developing capabilities is arguably less sustainable, as it will likely falter if the people committed to data leave the team. By contrast, when data are ingrained in formalized processes and routines that are not tied to specific individuals, capabilities have better chances of enduring. The less formal and habituated approach to building data capabilities also seemed more limited, both in terms of the breadth and depth of the data uses reported by interviewees in city team B.
Reviewing the interview evidence from all three cases, two clear enabling conditions stand out. First, teams—in particular in cities A and C—stressed the importance of skills as an enabling factor. Interviewees in these teams felt that rigid civil service regulations prevented them from hiring people with the right technical and data-analytic skills. Second, all three teams underscored the role played by leaders in enabling the development and deployment of capabilities. This entailed a combined and synergistic approach where the mayor created the space, legitimacy, and alliances for the team to access and use data, and the executive manager directly led the assembling of the team, instilling and maintaining enthusiasm among team members, and steering the team through bureaucratic intricacies.
5. Discussion
There are currently two main approaches to studying data capacity. On the one hand, some scholars take organizations as the main unit of analysis to understand how organizational configurations and resource endowments explain differences in entities’ ability to use data to become more productive (see Brynjolfsson and McElheran (Reference Brynjolfsson and McElheran2016) in the private sector) or to create public value (see Pang et al. (Reference Pang, Lee and Delone2014) in a public setting). On the other hand, and in large part facilitated by the methodological opportunities offered by behavioral science, other scholars study how individuals’ skills and behaviors affect data use (Cantarelli et al., Reference Cantarelli, Belle and Hall2023). These two approaches mirror a broader divide in public administration scholarship: a macro approach to studying institutions and organizational capacity, and a focus on the psychological microfoundations of individuals’ administrative behavior (Moynihan, Reference Moynihan2018).
Between these two poles—organizations and individuals—lies a missing link: the capabilities of groups of individuals who, collectively, are responsible for collecting, processing, sharing, and using data in the service of tackling public problems. Our exploratory empirical study generated insights into the nature, constitutive elements, and enabling conditions of this missing link.
Through our analysis of the interviews, we found three main constitutive components of capabilities: processes, routines, and shared attitudes. This finding is consistent with existing literature on data use in the public sector. For example, scholars have shown how formalization, understood as the writing of processes (Pugh et al., Reference Pugh, Hickson, Hinings and Turner1968) on how behaviors should be performed, can help change entrenched behaviors and stimulate new ones (McGuirk et al., Reference McGuirk, O’Neill and Mee2015; Mergel et al., Reference Mergel, Kleibrink and Sörvik2018). An example of this was the protocols designed by certain teams to ensure quality during data entry. Routines, understood as “repetitive, recognizable patterns of interdependent action, carried out by multiple actors” (Feldman and Pentland, Reference Feldman and Pentland2003: 95), establish predictable patterns of action by team members, which in turn guide expectations and support the creation of value, for example through “show and tells” to explain how data can be used by other departments. Finally, the attitudes that team members share around the value of data shape how they think and do their work (Klievink et al., Reference Klievink, Romijn, Cunningham and de Bruijn2017). These attitudes extend beyond individualized dispositions and reside instead in the collective understandings of data that, as one of the interviewees explained, “drag” team members along with a shared enthusiasm and commitment to using data. Attitudes show their strength as a core component of team capabilities when they are collectively shared across the team.
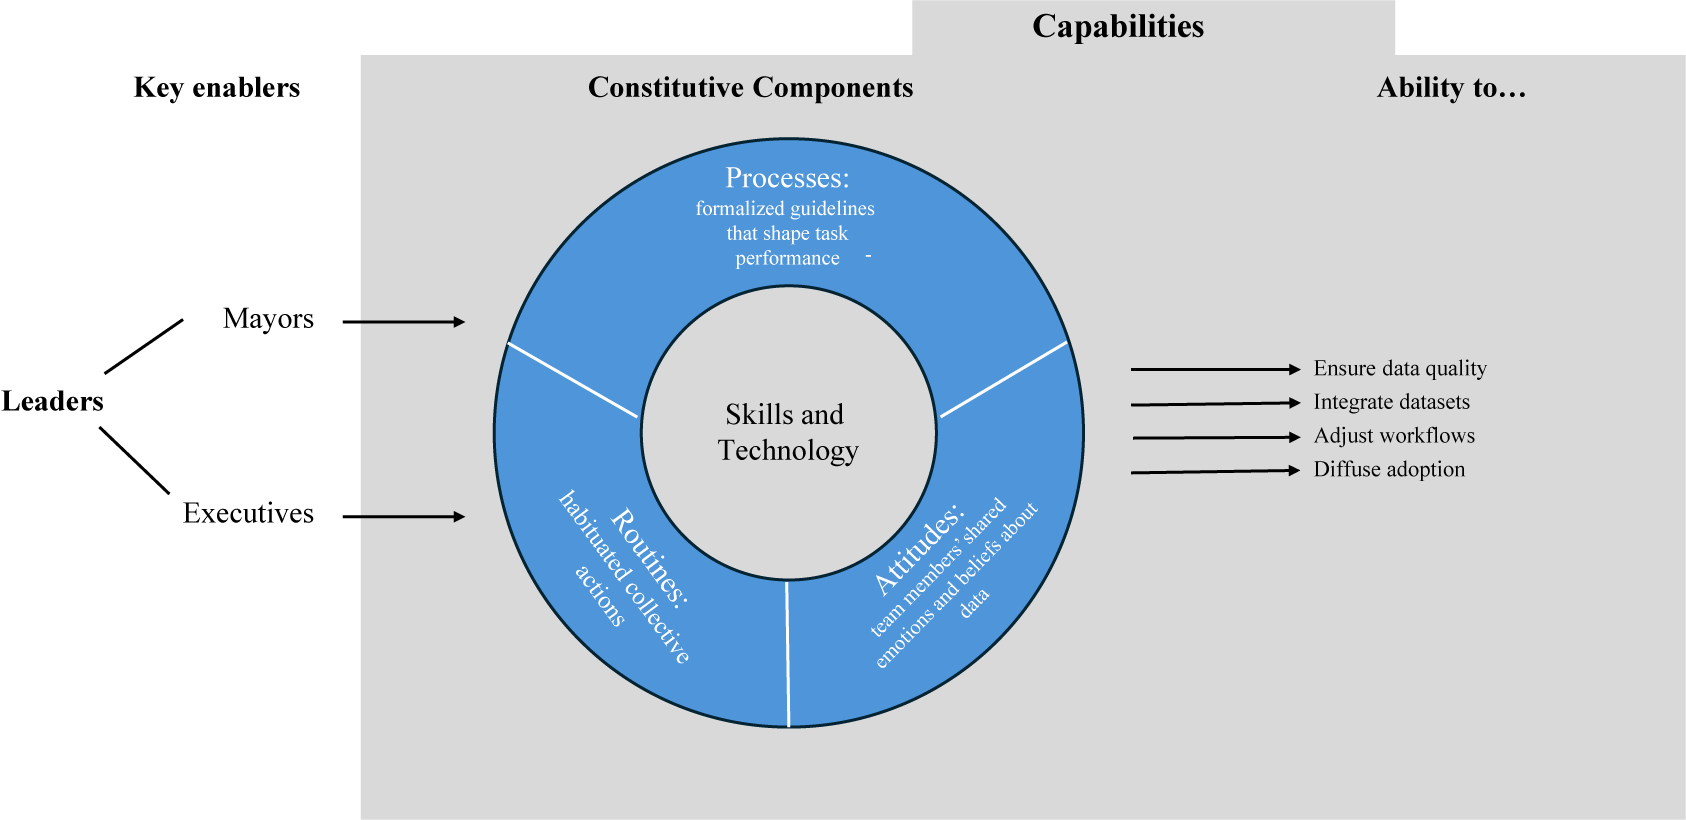
Processes, routines and shared attitudes need to work in sync and, together with available skills and technological tools, generate teams’ ability to perform a series of tasks along the data value cycle (e.g., integrate data, ensure data quality, adjust workflows, and diffuse adoption). Figure 1 illustrates a conceptual framework built on the findings above. This conceptual framework can help advance future scholarship by providing researchers with strong analytical scaffolding and operationalizable constructs to study data capabilities.
Conceptual framework: data capabilities.

Figure 1. Long description
The diagram is organized into three main sections: Key enablers on the left, Constitutive Components in the center, and Ability to... on the right.
At the center of the diagram is a core circle labeled Skills and Technology. Surrounding this core is a blue ring divided into three segments:
1. Processes: formalized guidelines that shape task performance.
2. Routines: habituated collective actions.
3. Attitudes: team members’ shared emotions and beliefs about data.
To the left, under the heading Key enablers, the word Leaders branches into Mayors and Executives. Arrows point from Mayors and Executives toward the central ring.
To the right, under the heading Ability to..., four horizontal arrows point away from the central ring toward a list of outcomes:
- Ensure data quality
- Integrate datasets
- Adjust workflows
- Diffuse adoption.
The entire central and right-hand sections are contained within a large grey box labeled Capabilities.
Our research was limited to three city teams from a particular context during a relatively short period of time. This research design was appropriate given the nascent nature of research in this area (Edmondson and McManus, Reference Edmondson and McManus2007), but it leaves important questions unanswered: how do capabilities evolve over time? What helps them endure in the face of political and administrative change? How does the composition of capabilities, as well as their enablers and effects, vary across institutional and contextual settings? The conceptual framework introduced in this article will support future research that complements our qualitative and exploratory analytical approach. This includes using other methods and research designs, including longitudinal research and larger datasets, but also more in-depth studies of capabilities applying ethnographic and process-tracing techniques.
When pursuing these research avenues, academic scholars studying data capabilities may consider groups of individuals as a more suitable unit of analysis than broader organizations—whose boundaries may be hard to scope and grasp—and individuals—whose contributions to collective data capacity may be partial and limited. While a few existing studies have examined cross-departmental teams (Wastell et al., Reference Wastell, Kawalek, Langmead-Jones and Ormerod2004; Chen and Lee, Reference Chen and Lee2018; Ruijer and Meijer, Reference Ruijer and Meijer2020; Gueguen et al., Reference Gueguen, Snel and Mutonji2022), they remain an under-used unit of analysis. This article highlights the potential of taking cross-functional teams as a unit of analysis in future data and policy studies.
Our research also explored the factors enabling capability development. Among these, leaders stand out as a crucial force. The literature on data use in the public sector already recognizes the importance of senior leaders in articulating a vision (Yang and Maxwell, Reference Yang and Maxwell2011) and fostering collaboration around data (Chen and Lee, Reference Chen and Lee2018). Other studies have described how leaders use their authority to direct resources toward building data capacity (Haneem et al., Reference Haneem, Kama, Taskin, Pauleen and Abu Bakar2019; Coulthart and Riccucci, Reference Coulthart and Riccucci2022). Our study extends and refines this research. We found that executive leaders can directly impact the development of capabilities based on how they decide the membership of teams, navigating the organization to build alliances and secure partnerships, and keeping the team focused and motivated. Political leaders, mayors in particular, play a different and complementary role by creating an authorizing environment (Moore, Reference Moore1995) for the team, modeling behaviors and removing barriers through their personal commitment and championing. This synergistic approach aligns with current research in public leadership, which has noted the differential role that leaders at different levels of the organization play in promoting innovations (Demircioglu and Van der Wal, Reference Demircioglu and Van der Wal2022; Fernandez-Monge et al., Reference Fernandez-Monge, Mayne and de Jong2026). It can also inform the strategic and tactical sharing of responsibilities between leaders seeking to foster their teams’ and organizations’ data capabilities.
Shedding light on the relevance of capabilities has important implications for practitioners. Our interviews with city officials showed that resources, such as skills and technological tools, do shape how teams collect, extract, and use data. Interviewees repeatedly mentioned the barriers posed by rigid hiring rules in the public sector as an impediment for attracting people with the necessary technical data skills. At the same time, some of these skills and tools can be outsourced, as illustrated by the example of city team B. While it may be a worthwhile cost–benefit calculation given this city’s size and needs, this difference points to an important issue. Contrary to tangible assets, capabilities cannot be outsourced and need to be built “like a muscle” (in the memorable words of one of our interviewees). As they are intangible and reside in individuals and teams, they cannot be easily acquired from outside the organization. This in turn highlights the importance of formalizing processes and cultivating internal habituated routines. Buying tools and hiring experts from outside is not enough, specially for long-term sustainability. Practitioners and officials who wish to improve data use in their teams and organizations and sustain it over time should therefore pay attention to building this muscle internally.
Finally, our research shows that these capabilities vary substantially across teams and governments, in their combination, in the extent of their in-house development and maturity, and in how they interact with leadership. Future research can use our framework to examine more systematically how these different elements vary, and with what outcomes, across different settings.
6. Conclusion
The use of data is critical for city governments and teams to deliver more effective services, use resources more efficiently, distribute benefits more equitably, and to increase the transparency and accountability of government action. This article shows how this ability to use data depends not only on tangible resources and individual skills, but on capabilities: the coordinated and habituated tasks and actions performed by groups of humans. Our exploratory study offers insights into the constitutive elements of these capabilities: processes, routines, and attitudes inherent in teams and their individual members. By identifying capabilities as an important subject of study in the data-for-policy literature, and teams as an important unit of analysis, this article highlights the importance of capabilities for enhancing data-informed governance, unlocking a rich agenda for future research.
Data availability statement
None, as the only original data used for this article are interview transcripts that cannot be published to protect interviewees anonymity.
Author contribution
Conceptualization: F.F.-M., Q.M., and J.D.J. Methodology: F.F.-M., Q.M., and J.D.J. Investigation: F.F.-M. and Q.M. Writing original draft: F.F.-M. Writing review and editing: F.F.-M., Q.M., and J.D.J.
Funding statement
This research was supported by the Bloomberg Harvard City Leadership Initiative, which is funded by Bloomberg Philanthropies. The funder had no role in study design, data collection and analysis, decision to publish, or preparation of the manuscript.
Competing interests
The authors declare none.
Provenance
This article was submitted for consideration for the 2025 Data for Policy Conference to be published in Data & Policy on the strength of the Conference review process.
A. Appendix A: Interview protocol
[Note: Interviews were conducted in spring of 2022]
A.1. General (10 minutes)
-
• There are all these words used by people that work on data (data-driven, data-forward, data-savvy…), do you think any of those words apply to your team? Why?
-
• Has your thinking about using data to tackle problem properties changed over the last few years? How? Can you give us some examples, or concrete experiences that help explain your thinking?
-
• Would you say you have tried new things or innovated in the use of data in the last few years? Can you give us some examples?
A.2. Skills (10 minutes)
-
• Through these experiences, what have you learned about the skills that are particularly useful to getting the most out of data?
-
• Are there any skills that you wish you had? Both in terms of your own skills and the team’s skills
-
• Do you think you have gotten better at improving the quality of your data?
A.3. Habits and culture (15 minutes)
The ability of a team to perform a set of tasks requires the transformation of individual skills into organizational habits or rhythms, which can be more or less formalized.
-
• Would you say there is a particular way you go about using data? Has that changed over time? Has it become firmer over time? Are there any habits that you have changed or abandoned over time?
-
• Have you felt the need to formalize some of these habits? How do you think that would help you?
-
• Would you say that there is energy around the use of data in your team? Where do you think it comes from? Has it changed over time? Why do you think that is?
-
• Do you think there is similar energy in other parts of the city government?
A.4. Leadership (10 minutes)
-
• What role has the mayor played in building a data-informed organization? Has this changed over time?
-
• What is your mayor’s approach to data?
-
• Are there any concrete examples that come to mind about how the mayor has engaged with data?
A.5. Closing (10 minutes)
-
• We have covered a lot about data capabilities; what would you say are the key elements that have helped you the most? Which ones have held you back?
-
• If one of your colleagues from another department would come to you for advice on how to become more data-informed, what advice would you give them?
-
• Is there anything that we have not covered that you think is important? Anything you want to share with us or ask us?
B. Appendix B: Codebook with iterations and examples
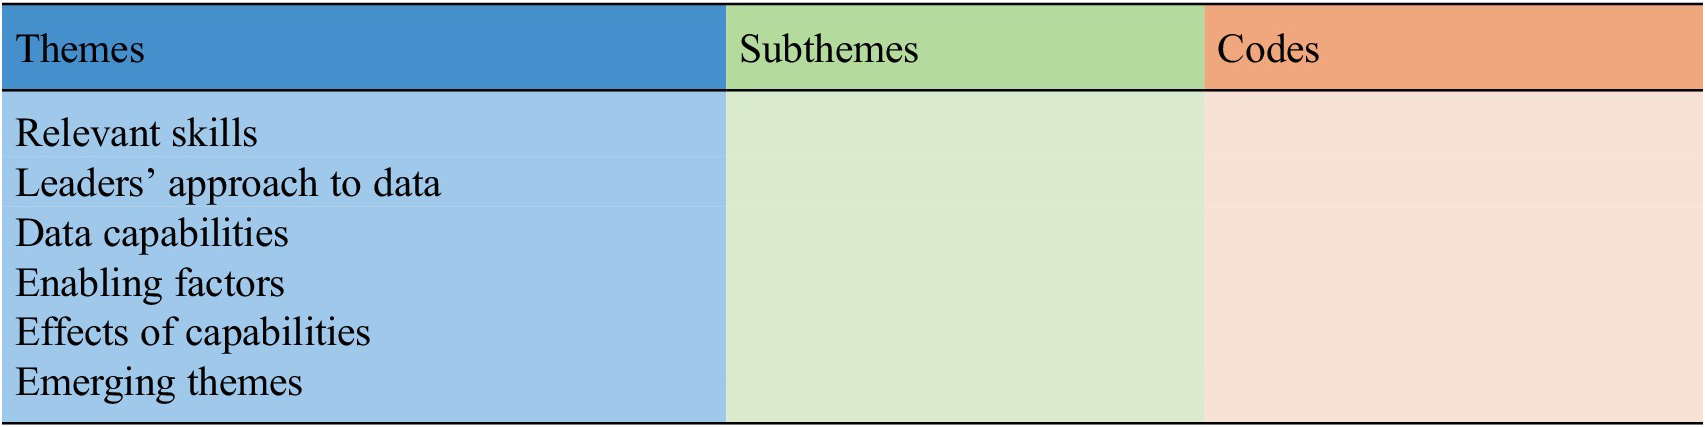
Starting codebook

Table B1. Long description
The table consists of three columns titled Themes, Subthemes, and Codes. The Themes column contains six primary entries listed vertically.
1. Relevant skills.
2. Leaders’ approach to data.
3. Data capabilities.
4. Enabling factors.
5. Effects of capabilities.
6. Emerging themes.
The Subthemes and Codes columns are currently empty in this view, indicating these are the top-level categories for a qualitative analysis framework.
Iteration with addition of subthemes and illustrative codes

Table B2. Long description
The table is organized into three columns: Themes, Subthemes, and Illustrative codes.
* Relevant skills: Includes subthemes of Skill combination (multidisciplinary teams), Technical skills (data processing and pivot tables), Subject matter expertise (long-term city knowledge), and Transversal skills (analytical thinking and broader picture perspective).
* Leaders’s approach to data: Includes subthemes for Mayors (requiring hard numbers before moving forward) and Executive leaders (placing high importance on data).
* Data capabilities: Includes subthemes of Routine practices (building muscles through regular use), Process (data hygiene and city policies), and Attitudes (excitement and team momentum).
* Enabling factors: Includes subthemes for Executive leaders (identifying champions), Mayors (seeing potential and success), and Barriers (modernizing and hiring the right people).
* Effects of capabilities: Includes subthemes of Inform decisions (new strategies for permits), Communicate information (data-driven discussions), Align efforts (resolving conflicts in planning), and Anticipate situations (proactivity to save time and money).
* Emerging themes: Includes subthemes of Importance of go-between role (communication between departments) and Need to break silos (addressing historically siloed departments).
C. Appendix C: Prompting guide for ChatGPT coding iteration
C.1. PROMPT 1
You are a social scientist with expertise in public management, data studies, and organizational science. You are also an expert qualitative coder.
You are going to code a series of transcripts of semi-structured interviews, but first I want to give you context for the research as well as the coding method that you need to use.
The goal of this research is to identify the key capabilities that city teams deploy to solve public problems with data. We define capabilities as the set of coordinated tasks and actions performed by groups of humans to activate tangible assets and translate data into information to support operational, programmatic, and policy decisions. By studying three teams from three different cities, we want to understand how teams of individuals collectively gather, process, share, and use data.
Our focus on capabilities seeks to go beyond traditional scholarly attention dedicated to either organizational elements—such as resources, organizational structures, or funding—or individuals’ skills and behaviors. Thus, this focus on the “meso-level” capabilities requires that we study the collective formal and nonformal practices and attitudes around data developed by teams in their day-to-day work.
With this overarching goal, we conducted eight interviews with team members from three different cities tackling issues related to problem properties in their cities. The three research questions explored through the interviews were: (i) What capabilities do teams use and develop within city halls to collect, process, share, and use data? (ii) How do these capabilities affect teams’ self-reported ability to tackle problems more effectively? And (iii) what additional factors helped or hindered teams’ use of these capabilities?
Do you have any questions about the research before I move on to describe the coding methodology that I want you to follow?
C.2. PROMPT 2
I want you to do thematic coding. This will be a mix of deductive and inductive thematic coding following two iterations to generate one deliverable: an Excel file.
In the first iteration, you will use this list of themes and their associated descriptions:
-
1. Relevant skills: skills (both technical and nontechnical, including relational and behavioral skills) that are identified as important to collect, process, store, and use data by interviewees.
-
2. Leaders’ approach to data: refers to leaders’ attitudes, behaviors, and actions related to data. Include only descriptive references, leaving out those that include a judgment about their positive or negative contribution to generating data capabilities.
-
3. Data capabilities: the teams’ collective formal and non-formal interactions, routines and attitudes to activate tangible assets and translate data into information to support operational, programmatic, and policy decisions described by interviewers.
-
4. Enabling factors of capabilities: the set of conditions that enabled the team to develop their capabilities.
-
5. Effects of data capabilities: the tangible and beneficial results that were derived from city teams developing and deploying data capabilities in their work.
Next, you will review the transcripts related to one of the city teams that I will give you to generate a broad range of codes that fit into one of each of these five themes. These codes should capture all the explicit or latent meanings or events related to these themes and that are relevant for my research questions. Provide a name for each code in no more than 5 words, an up to 20-word meaningful and dense description (the larger the number of words allowed in the description, the shorter the number of codes [De Paoli, Reference De Paoli2024]) of the code, and quotes from the interviewee that are relevant for each code (no longer than 40 words). There may be two or more quotes for each code.
Within each of the five themes, and when appropriate, identify subthemes by sorting, comparing, and grouping the codes. Describe each of the subthemes along with a name, and a dense description (no more than 40 words). Ensure that the themes and subthemes capture the richness and diversity of the initial codes.
Format the response as an Excel file with the following structure:
-
First column: code name.
-
Second column: code description.
-
Third column: theme to which the code belongs.
-
Fourth column: subtheme (if applicable) to which the code belongs.
-
Fifth column: description of the newly generated subtheme, if applicable.
-
Subsequent columns: add a column for each of the relevant quotes per code (up to five quotes and columns per code).
In the second iteration, I want you to generate a broad range of codes that, according to your expert judgment, do not fit into the themes and subthemes of the first iteration above. This may be because they do not squarely fit into the themes and subthemes that I gave you in the first iteration, or because you identify several codes that have something in common and that are thematically different from the list of five themes that I gave you. These codes should capture all the explicit or latent meanings or events that are relevant for my research questions. As with the first iteration, provide a name for each code in no more than 5 words, an up to 20-word meaningful and dense description of the code, and the quote(s) from the interviewee for each code (no longer than 40 words).
Once you have identified all these possible additional codes, determine all the possible themes and subthemes related to these additional codes by sorting, comparing, and grouping these codes. Describe each of these additional themes and subthemes along with a name, and a dense description (no more than 40 words). Ensure that the themes and subthemes capture the richness and diversity of the additional codes.
Include these additional codes as a second tab in the same Excel file above, using this format:
-
First column: code name.
-
Second column: code description.
-
Third column: newly generated theme to which the code belongs.
-
Fourth column: description of the newly generated theme.
-
Fifth column: subtheme (if applicable) to which the code belongs.
-
Fourth column: description of the newly generated subtheme, if applicable.
-
Subsequent columns: add a column for each of the relevant quotes per code (up to five quotes and columns per code).
Before I give you the transcripts to proceed with the coding, do you have any questions about the coding approach?
C.3. PROMPT 3
OK, then attached are two transcripts corresponding to City A. Please now proceed to code the two transcripts following the methodology and steps described above to generate the Excel file.
C.4. PROMPT 4
Please now proceed to code the three transcripts corresponding to City B and generate a new Excel file.
C.5. PROMPT 5
Finally, please now proceed to code the three transcripts corresponding to City C and generate a new Excel file.


 Open access


Comments
No Comments have been published for this article.