Introduction
In a polymer electrolyte fuel cells (PEFCs), the existence of tiny volume of CO in H2 feed from the reformer acts to poison Pt anode catalyst.[Reference Götz and Wendt1, Reference Lemons2] The metal surface which binds hydrogen weakly lead high catalytic selectivity; although that metal surfaces usually have high activation barriers for H2 dissociation that bounds the activity of the catalysts.[Reference Nørskov, Bligaard, Logadottir, Bahn, Hansen, Bollinger, Bengaard, Hammer, Sljivancanin and Mavrikakis3, Reference Lucci, Darby, Mattera, Ivimey, Therrien, Michaelides, Stamatakis and Sykes4] Ru addition to Pt helps to hinder CO poisoning of the Pt surface sites that would carry out hydrogen oxidation.[Reference Gasteiger, Markovic, Ross and Cairns5, Reference Rolison, Hagans, Swider and Long6] Ru stimulates oxidation of CO to form CO2 and may diminish the Pt–CO interaction.[Reference Ge, Desai, Neurock and Kourtakis7] In such bimetallic alloy, the geometrical layouts of two metals in surfaces are very crucial for their catalytic nature[Reference Somorjai and Borodko8–Reference Sinfelt10] because their reactivity and selectivity would be varied by their surface adjustment.[Reference Campbell11]
The alloying effects of Pt for CO tolerance is likely to be complicated although some facets of it are understood: CO removal is occurred by oxidation to CO2 and the activation barrier for a reaction amid CO and an involved oxidant species on the surface has been found to depend precisely on the adsorption strength of both species.[Reference Gong, Liu, Raval and Hu12–Reference Narayanasamy and Anderson15] Still, this is a very critical issue to speculate the adsorption strengths of the species under complex conditions, such as segregation of mixing elements and coadsorption of other species. Some researchers have also suggested a loosening of the CO bond to the Pt–Ru alloy referring to pure Pt, that established by recent ultrahigh vacuum (UHV) studies.[Reference de Mongeot, Scherer, Gleich, Kopatzki and Behm16] For methanol decomposition reaction, Watanabe and co-workers reported that dehydrogenation takes place at Pt sites and CO oxidation takes place at Ru sites with the available formed OH species.[Reference Yajima, Uchida and Watanabe17]
Koper and co-workers theoretically investigated adsorption of CO and OH on Pt, Ru, and their alloys.[Reference Koper, Shubina and van Santen18] Gong and co-workers reported CO oxidation by water molecules on Pt (111)[Reference Gong, Hu and Raval19] and Dunietz et al. also treated CO oxidation with cluster models introducing electric field.[Reference Dunietz, Markovic, Ross and Head-Gordon20] Shimodaira et al. reported adsorption phenomena of CO and H2 using different Pt-based binary alloys by density functional theory (DFT) study.[Reference Shimodaira, Tanaka, Miura, Kudo and Kobayashi21] Ge et al. in their first principle-based computational study demonstrated that CO adsorption energy decreased on the surface of the bulk alloy, but increased when the surface layer contains only Ru atoms.[Reference Ge, Desai, Neurock and Kourtakis7] Koper et al. reported bonding mechanism of H2O derivatives (i.e. H, O, and OH) at different metal surfaces and noticed in the presence of applied electric field species donate electric charge to surface but there was the negligible effect of existing electric field for H adsorption.[Reference Koper and van Santen22]
Levendorf et al. from their situ ATR-SEIRAS (attenuated total reflection-surface enhanced infrared adsorption spectroscopy) and electrochemical studies reported that the polyvinylpyrrolidone-free Pt NPs adsorbed more bridged bound gases CO and the fragile hydrogen-bound interfacial H2O performed a major role for the assimilation dependent increase in methanol oxidation activity.[Reference Levendorf, Chen, Rom, Liu and Tong23]
Previous studies indicated that composition ratio of Pt and Ru is essential to design updated catalysts and Pt:Ru = 2:3 alloy is suggested to be a good composition compared with all other mixing ratio for high CO-tolerant anode catalysts.[Reference Sato, Kunimatsu, Okaya, Yano, Watanabe and Uchida24, Reference Sato, Okaya, Kunimatsu, Yano, Watanabe and Uchida25] CO coadsorption either with O or OH on Pt and Pt–Ru alloy can be noticed when Ru is oxidized by O or OH subsequently, Pt–CO bond stability dramatically changes.[Reference Han and Ceder26] Our previous study reported that the adsorption strengths of H, CO, and OH were affected by the ratio of Pt/Ru atoms in the top surface, the neighboring atom of the adsorption site, and subsurface of the alloying atoms.[Reference Khorshed, Saito and Takaba27] We also reported the theoretical investigation on the segregation behavior of Pt in the Pt2Ru3 nanoparticle with cluster size and temperature.[Reference Khorshed, Saito and Takaba28] However, to our knowledge, there is hardly the study on the report about segregation behavior of Pt2Ru3 nanoparticle in the presence of gases.
Bimetallic NP catalysts are developed by different but the particulars of orientation and local arrangement are hard to ascertain and generally freeze poorly defined.[Reference Hills, Nashner, Frenkel, Shapley and Nuzzo29–Reference Yuge31] Alayoglu et al. reported the structural and engineering assessment of bimetallic nanoparticles of Pt–Ru alloy using MC as well as experimental method.[Reference Alayoglu, Zavalij, Eichhorn, Wang, Frenkel and Chupas32] Using MC simulations some researchers have discussed the impact of CO electro-oxidation.[Reference Alayoglu, Zavalij, Eichhorn, Wang, Frenkel and Chupas32–Reference Saravanan, Koper, Markovic, Head-Gordon and Ross39] Surface segregation phenomena have attracted attention because it impacts such materials properties as adsorption, oxidation, and catalysis, etc.[Reference Dowben and Miller40–Reference Polak and Rubinovich42] Some theoretical groups investigated segregation propensity of Pt atoms to the surfaces using united DFT and MC simulation of PtRu,[Reference Han, Van der Ven, Ceder and Hwang43] PtNi,[Reference Wang, Van Hove and Ross44] PtRh[Reference Yuge, Seko, Kuwabara, Oba and Tanaka45] nanoparticles. Those theoretical studies mainly discussed the adsorption phenomena of adsorbing species,[Reference Yajima, Uchida and Watanabe18–Reference Koper and van Santen22, Reference Han and Ceder26] structural and segregation behavior[Reference Hills, Nashner, Frenkel, Shapley and Nuzzo29–Reference Yuge, Seko, Kuwabara, Oba and Tanaka45] of alloying atoms of bimetallic systems in the absence of gas species. Recently, some experimental reports guessed that Pt2Ru3 nanoparticle considered as good choice as an efficient CO resistant anode catalysts for PEFCs.[Reference Sato, Kunimatsu, Okaya, Yano, Watanabe and Uchida24, Reference Sato, Okaya, Kunimatsu, Yano, Watanabe and Uchida25] On the Pt–Ru alloy, it is very important to determine equilibrium arrangement of Pt and Ru atoms against CO.
In this study, we focus on the Pt2Ru3 alloys to discuss a stable conformation of Pt2Ru3 nanoparticle catalyst in the presence of gases (H2, CO). More precisely, we have applied a technique combining DFT with MC simulations in order to quantitatively investigate equilibrium conformation of Pt2Ru3 alloy nanoparticle induced by the adsorption of mixture gas. Adsorption energies of gases and its correlation with adsorption sites were investigated by the DFT calculations. Then the DFT calculations results were analyzed by a quantitative structural property relationship (QSPR) to associate the constructural descriptors based on the binding information of Pt2Ru3 alloys and adsorption energies by DFT. Furthermore, MC simulations were performed to investigate the stable conformation of Pt2Ru3 nanoparticle and affecting factors such as: temperature, pressure of adsorbing species, and nanoparticle size was also examined.
Computational method
To parameterize the adsorption energy using QSPR, DFT was employed for calculating adsorption energy of gas species on Pt2Ru3 nanoparticles. A number of models with different configurations of Pt2Ru3 with adsorbates (H2 and CO) were considered. The models have various orientations of Pt and Ru atoms with maintaining Pt:Ru = 2:3. We modeled a 2 × 2 unit cell with a periodic five layers to represent Pt2Ru3 surface with ordered face-centered cubic (fcc). A vacuum phase of thickness of about 10 Å model was created. Three bottom layers were fixed and two surface layers were permitted for flexibility at their position with adsorbates (CO, H2) during the geometry optimization. Details of structural information of used Pt2Ru3 surface models were described in our previous paper.[Reference Khorshed, Saito and Takaba27]
DFT calculations were carried out using DMol3.[Reference Delley46–Reference Delley48] Basis set and effective core potential were considered accordingly with our previous reports.[Reference Khorshed, Saito and Takaba27, Reference Khorshed, Saito and Takaba28] The generalized gradient approximation (GGA) functional developed by Perdew–Burke–Ernzerhof (PBE)[Reference Perdew, Burke and Ernzerhof49] was employed. The convergence tolerances, maximum force and displacement, K-point were followed by our previous reports.[Reference Khorshed, Saito and Takaba27, Reference Khorshed, Saito and Takaba28] The dipole slab correction was applied. All the calculations were performed in the spin-unrestricted mode. To calculate adsorption energies of the adsorbates we follow the below formula
 $$E_{{\rm ad}} = E({\rm adsorbing species}/{\rm surface}) - E({\rm gas}) - E({\rm surface})$$
where adsorbing species = H2 or CO. According to this equation, a negative E ad means a firm adsorption on the surface.
The stable arrangement of Pt or Ru atoms in the nanoparticle models under the gas adsorption was calculated by a grand canonical ensemble MC (GCMC). In the GCMC the attempt of displacement was applied only for Pt and Ru atoms. The detailed MC procedures for the displacement of Pt or Ru atoms in the nanoparticle models were mentioned in our previous paper.[Reference Khorshed, Saito and Takaba28] On the other hand, the attempts of insertion and deletion were employed only for adsorbing species as a function of partial pressure and temperature. The molecular adsorption of H2 and CO was considered. The adsorption sites are assumed to locate on the top of atoms exposed on the surface. Although the adsorption energy depends on the adsorption site, the variation of adsorption energy is averaged for each adsorption site. Because the degree of molecular orientation of adsorbing molecule is not considered in our GCMC, some entropic effect originated from freedom of molecular orientation would lack, which might mean the slight overestimation of the amount of adsorption; 300–363 K were set for MC simulations.
GCMC simulations were performed for models of nanoparticles of Pt2Ru3 alloy with randomly alloying of Pt and Ru atoms where the atoms of like element were ordered not to be the next. Two types of nm sized particles were assembled with number of atoms (N) = 309 and 923 corresponding to the diameters of 2.0, and 3.0 nm, respectively. Polyhedron particle shape was generated from Pt-based fcc lattice and surfaces were mixed of (111) and (100) facets.
Model validation
Multiple linear regression equation (MLR) contains more than one dependent variable. MLR regression coefficients for each independent variable are settled whose summation of the squares of the errors is minimized. Therefore, for the general multilinear, the relation can be expressed as follows:
 $$Y = b_0 + b_1 \times _1 + {\rm} b_2 \times _2 + \cdots + b_px_p,$$
where dependent variable Y is the adsorption strength of CO or H2 in this report. In addition to that b 0, b 1 to b p and x p represents intercept, descriptors, regression coefficients, and descriptors, respectively. We have reported in our previous study the most common parameters (denoted R 2), which are usually referred as configuration fitness and internal validation (Q 2) for similar nanoparticle cluster.[Reference Khorshed, Saito and Takaba28]
Results and discussion
Absorption energy
Adsorption energies of H2 at the atop, bridge, and hollow sites on the Pt2Ru3 surface for various conformations of Pt and Ru atoms were reported in our previous study.[Reference Khorshed, Saito and Takaba27] Reported results showed that H2 preferably adsorbed on the atop site (Pt) compared with Ru on the different surface conformation.
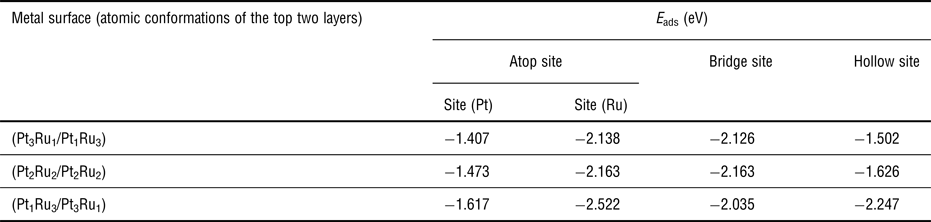
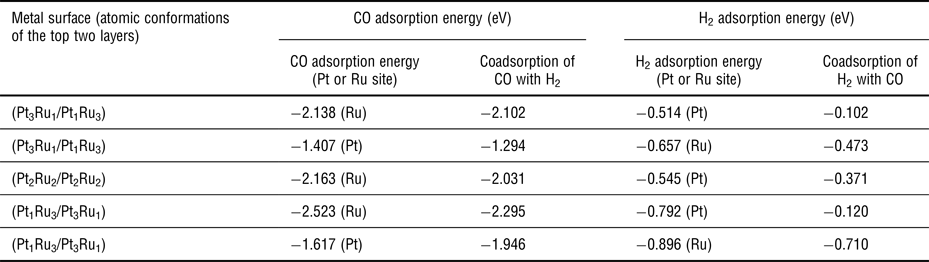
Table I shows the measured adsorption strengths of CO on the Pt2Ru3 alloy surfaces with various combinations of Pt and Ru atoms. We consider different adsorption sites; atop, bridge, and hollow. These computed adsorption strengths indicated that atop site (Ru) is the preferable site. The geometry optimization for CO adsorption on the bridge site for all conformation shows that CO shifts to the Ru site from the opening site, which shows higher inclination of CO to the Ru site compared with the Pt site. We reported in our previous study of bridge site adsorption[Reference Khorshed, Saito and Takaba27] that CO adsorption on the Ru–Ru site, is more favorable site compared with the Pt–Pt, Pt–Ru site. The CO adsorption energy at atop sites (Ru) becomes larger as the increase in the Ru ratio on the top layer. In order to investigate the coadsorption of CO with H2, we measured the adsorption energies for systems in which H2 and CO were set at the Pt or Ru sites (Supplementary Fig. S1). The measured coadsorption energies of CO with H2 and coadsorption energies of H2 with CO on the Pt3Ru1/Pt1Ru3, Pt2Ru2/Pt2Ru2, Ru3Pt1/Pt3Ru1 conformations of Pt2Ru3, are listed in Table II. Results reveal that the adsorption strength of both CO and H2 on Pt2Ru3 decreases by the presence of H2 for all surface configurations. In particular, the adsorption energy of H2 decreases more than that of CO, which means the CO adsorption prevents further H2 adsorption.
Calculated adsorption energies E ads (in eV) of CO on Pt2Ru3 alloy.

Calculated coadsorption energies E cads (in eV) of CO with H2 on Pt2Ru3.

Regression equation
A regression equation was constructed so as to reproduce the results of DFT only from the structural descriptors. As descriptors, the number and nature of neighboring atoms of adsorption site and the type of neighboring atoms in the alloy were selected. In the regression equation descriptors were fixed; xa–b indicates the number of bonds within focused atom a and adjoining atom b in the same layer (a,b = Pt or Ru). Terms of xa–H 2 and xa–CO represent the number of atoms a binding H2 and CO molecules, respectively. xa–S is the number of atom a on the surface. xa–b– is the number of bonds within atom a and adjoining atom b positioned outside the layer. The number of bonds or atoms was counted for a unit cell of slab model with the consideration of periodicity.
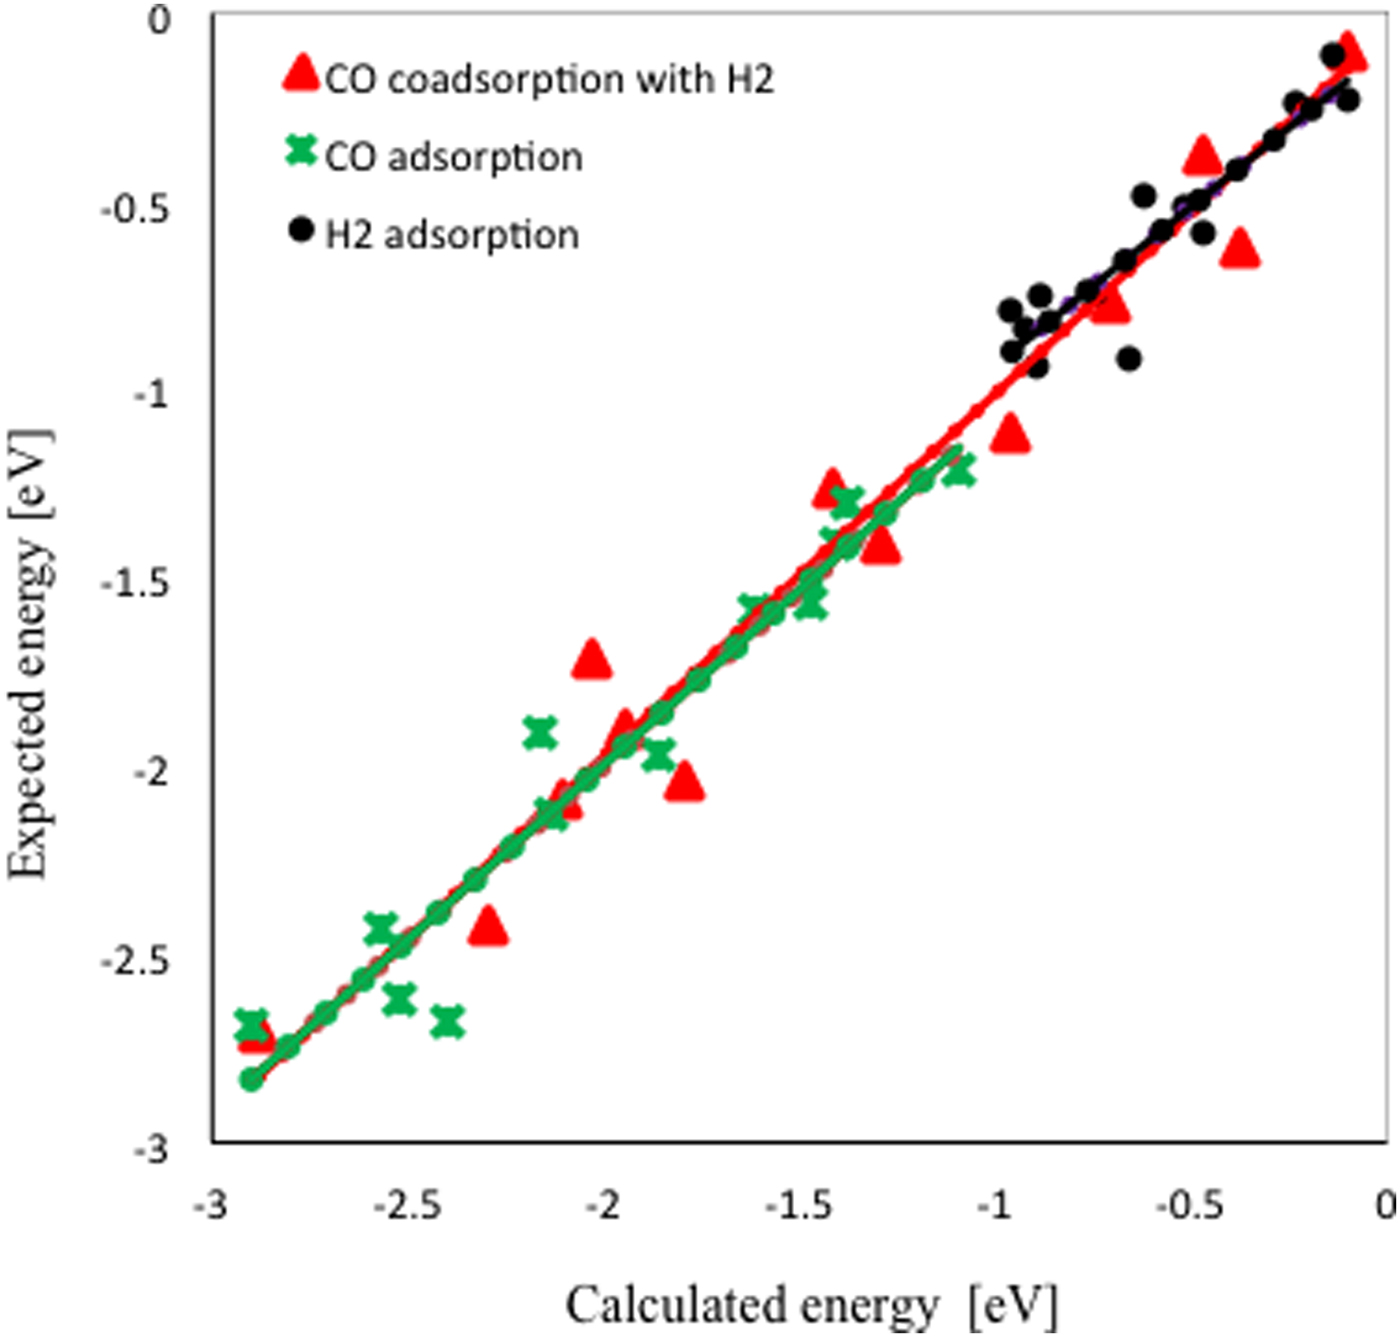
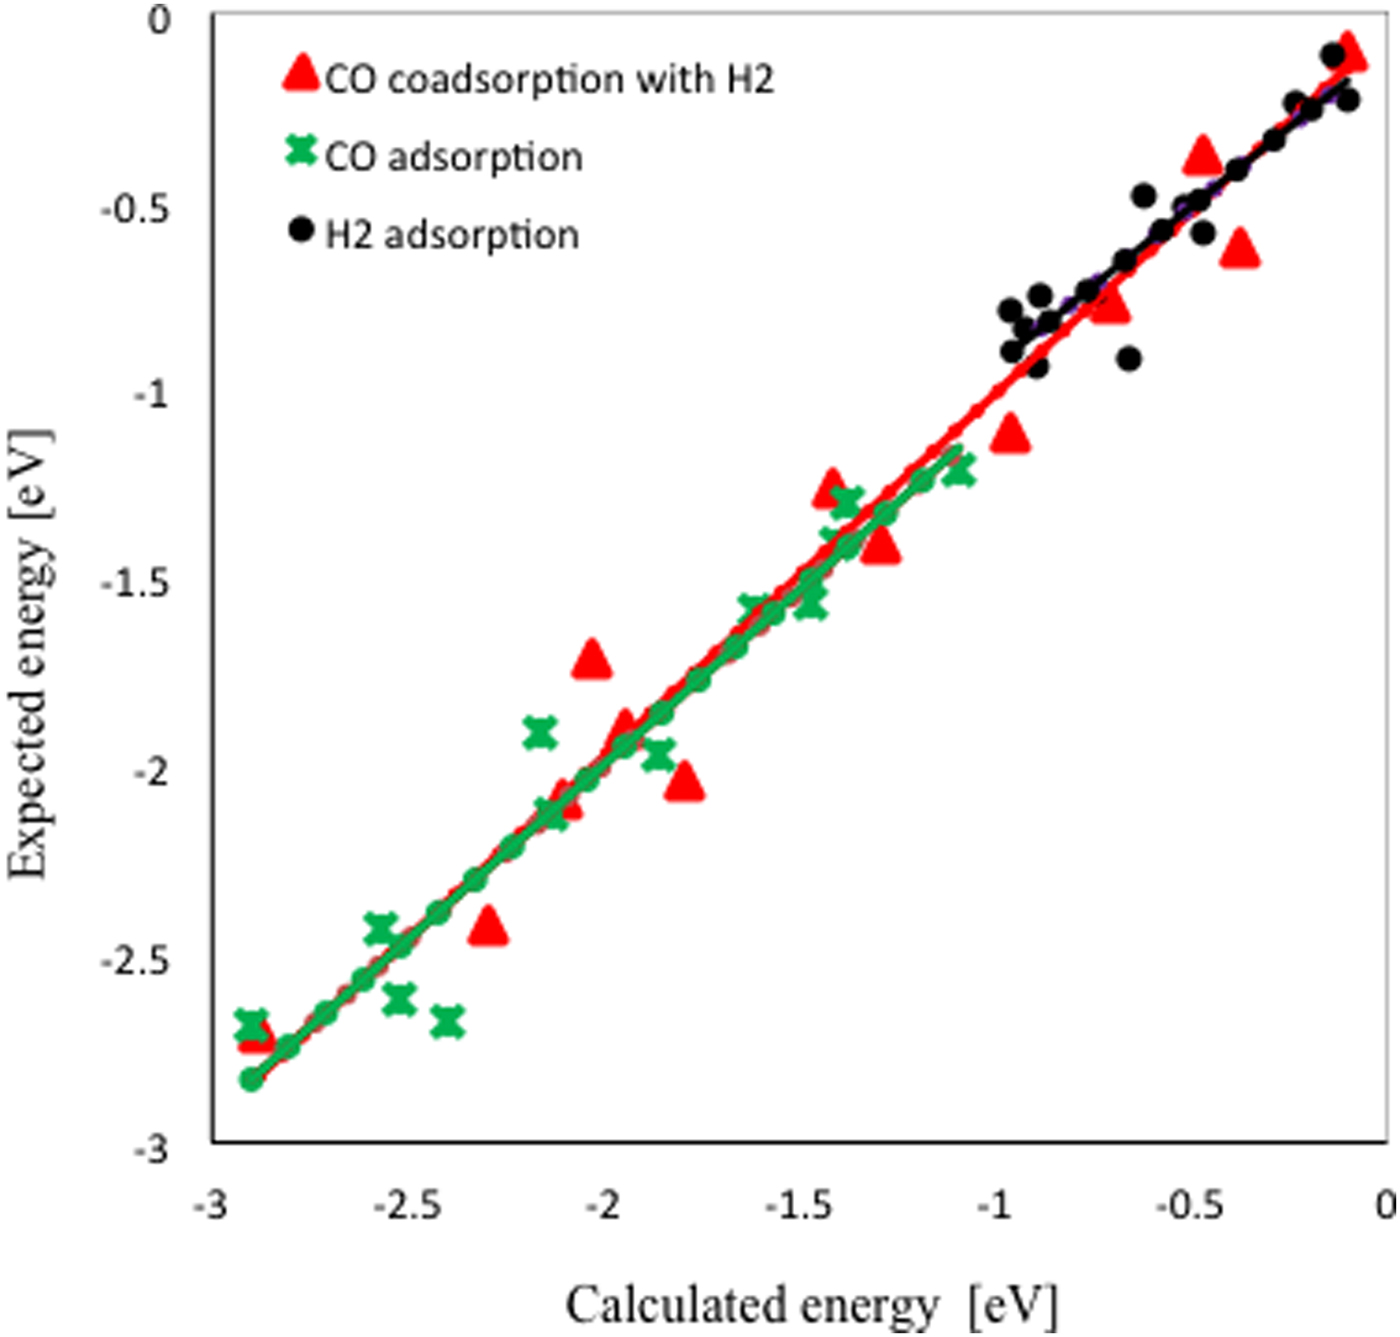
The regression coefficients, b n, of MLR were fixed so that the summation of the squares of the errors in the adsorption energy becomes minimum. The calculated regression coefficients are summarized in Table III. The adsorption energy is determined by a competition between the adsorbed atom and alloy conformation. The correlation between the adsorption energy by DFT and the one by MLR equation is shown in Fig. 1, which shows the reasonable correspondence.
Correlation between the calculated energy by DFT and estimated energy by multiple regression equation for CO–H2 coadsorption on the Pt2Ru3 alloy and also separate adsorption of CO and H2 on the same surface using QSPR analysis.
Approximated regression coefficients of MLR, b n, for the calculation of adsorption energy.


Equilibrium conformation in the presence of adsorbates
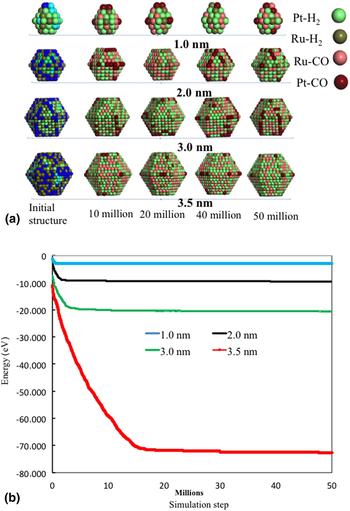
To investigate stability and equilibrium of the Pt2Ru3 alloy against the different concentration of CO, simulations were performed on different size (1.0, 2.0, 3.0, and 3.5 nm) of nanoparticle that were randomly mixing of Pt and Ru atoms considering temperature range (300–363 K). Simulations were performed upto 50 million MC steps. Figure 2(a) shows snap shots of MC results and Fig. 2(b) shows the corresponding energy change diagram with simulation time for the partial pressure of CO is 10.13 Pascal (Pa) [100 ppm]. The initial structure of Pt2Ru3 alloy surface was positioned with Pt and Ru atoms and Pt/Ru ratio was almost equal (little Ru rich). Simulation results of MC indicate, in the presence of gases (H2, CO), gas molecules occupy the surfaces. In equilibrium position, the major portion of the surface is occupied with H2 rich for various type of model. The energy diagram confirms that 1.0 nm cluster of Pt2Ru3 alloy gets equilibrium position very faster than the other larger size clusters according to the cluster size as shown in Fig. 2(b). This is because many attempts are required for larger models, which includes larger adsorption site and alloy atoms, to reach the equilibrium.
(a) Snap shots from MC simulation results of Pt2Ru3 nanoparticle in the presence of gases and shows surface coverage by the gases for different cluster. (b) Energy change diagram of Pt2Ru3 alloy in the presence of gases with simulation time.
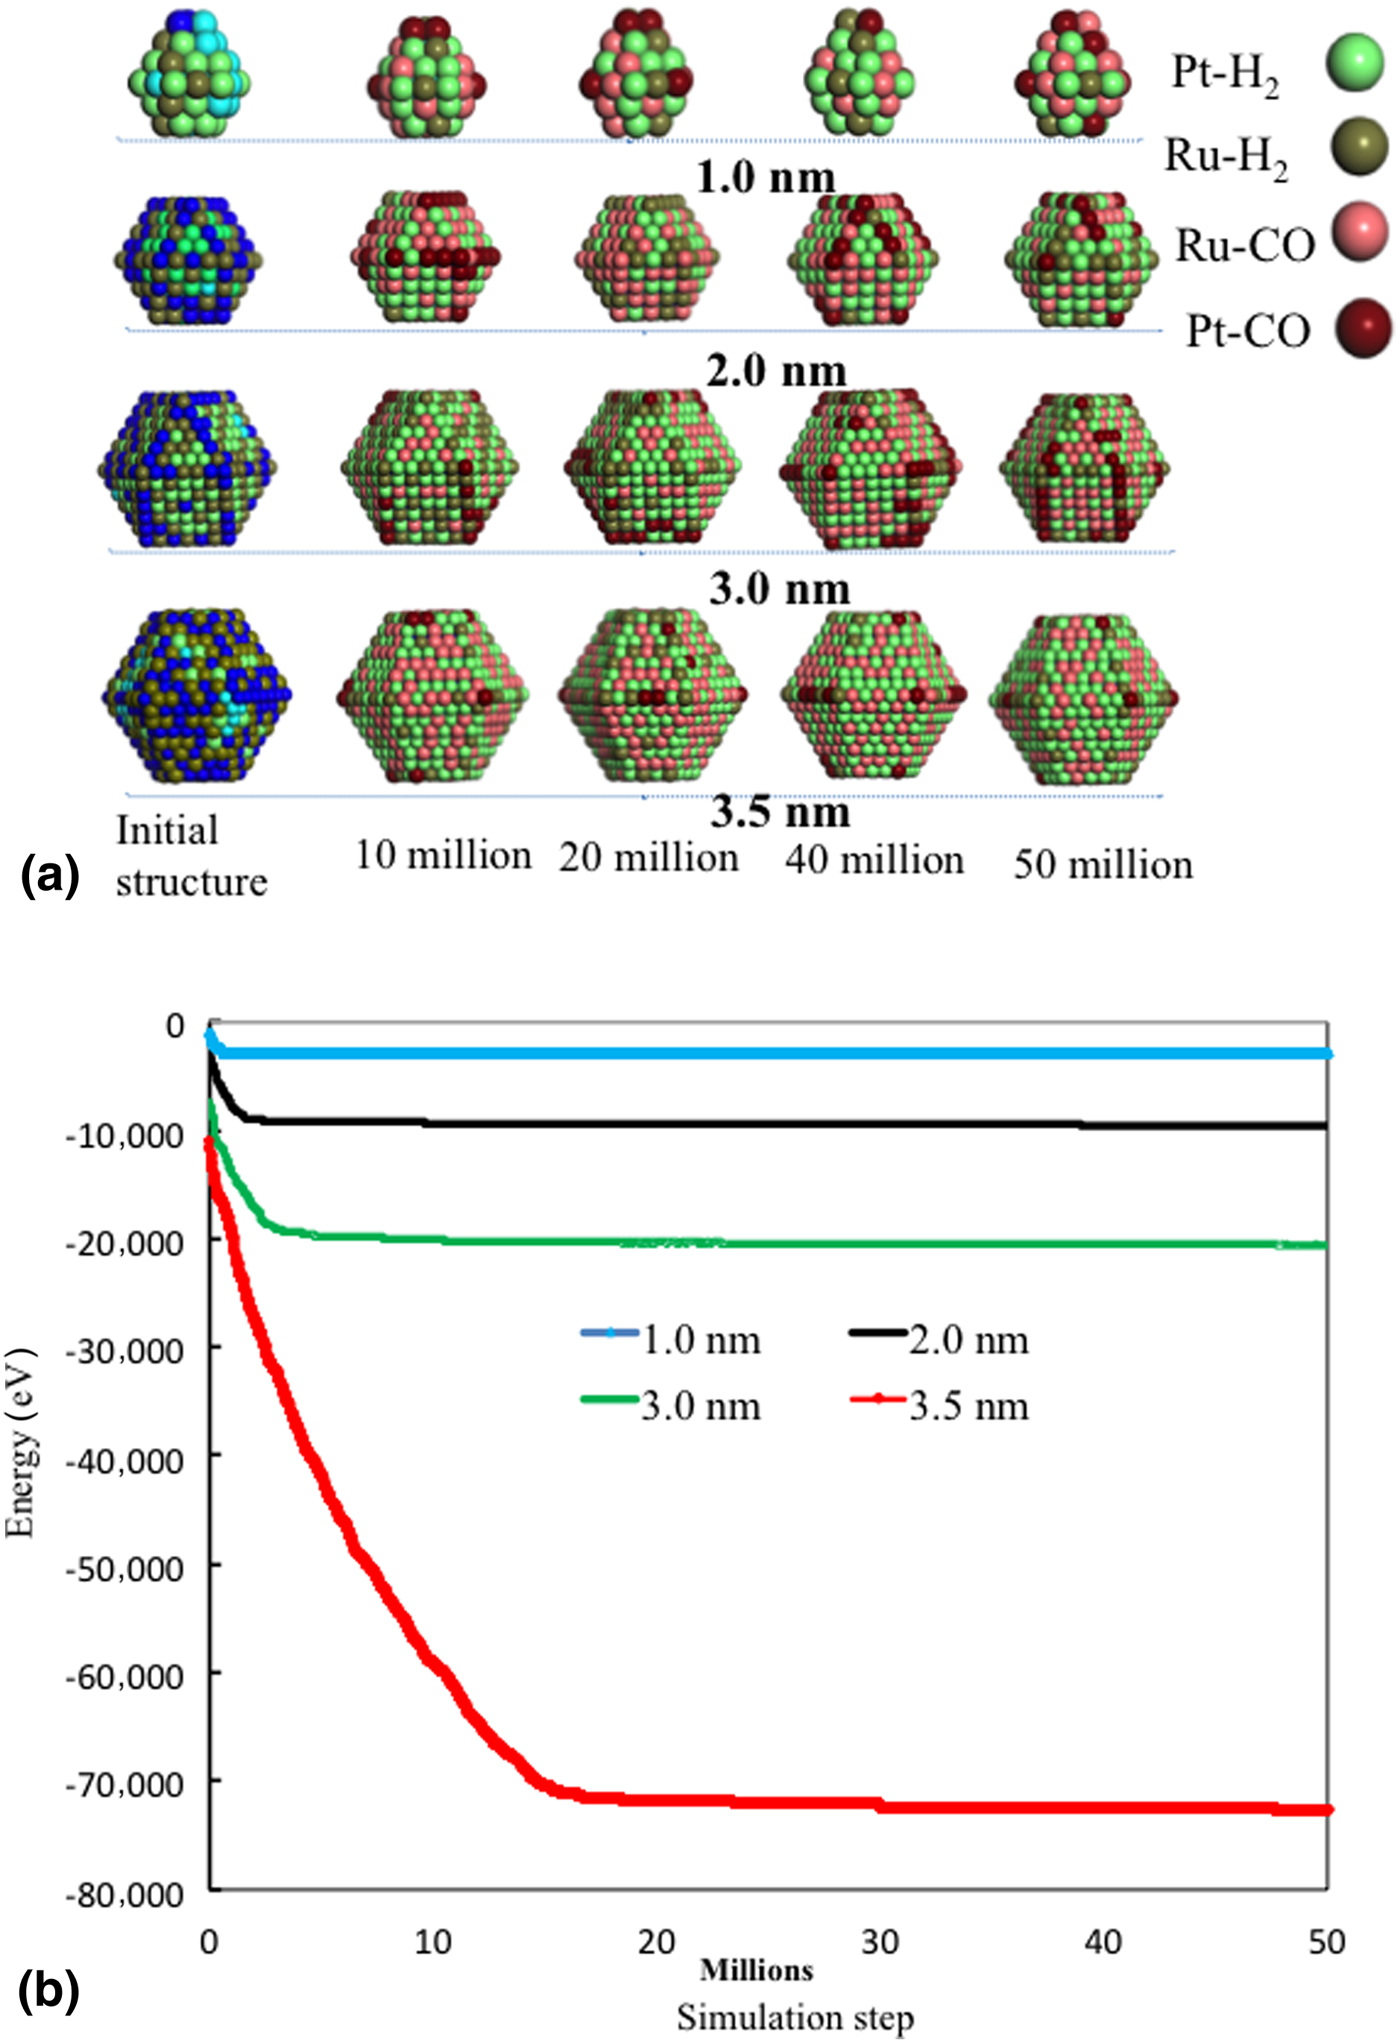
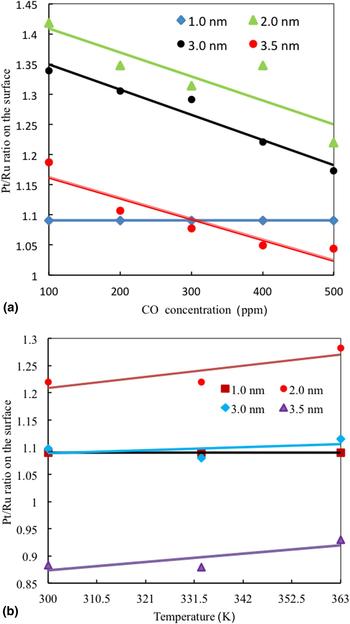
Figure 3(a) shows the Pt/Ru ratio on the surface as a function of CO concentration at 333 K. In the original system, the Pt/Ru ratios on the surfaces for different cluster sizes were in the range 0.85–0.95. MC simulations were employed when the partial pressure of H2 (P H2) and CO (P CO) were 70 kPa and 10.13–50.66 Pa (100–500 ppm), respectively. The Pt/Ru ratios decrease with the increase in the CO concentration except the result for 1.0 nm particle size. The adsorption strength of CO on the Ru site is higher than the Pt site that would be one of the reasons for decreasing the Pt/Ru ratio on the surface. When the particle size is 1.0 nm, the ratio of Pt/Ru is always one regardless of any conformation of Pt and Ru. It is noted from this figure that the adsorption of CO and H2 induce the rearrangement of the surface.
(a) Pt/Ru ratio on the surface of Pt2Ru3 nanoparticle as a function of CO concentration. (b) Pt/Ru ratio on the surface of Pt2Ru3 nanoparticle as a function of temperature.
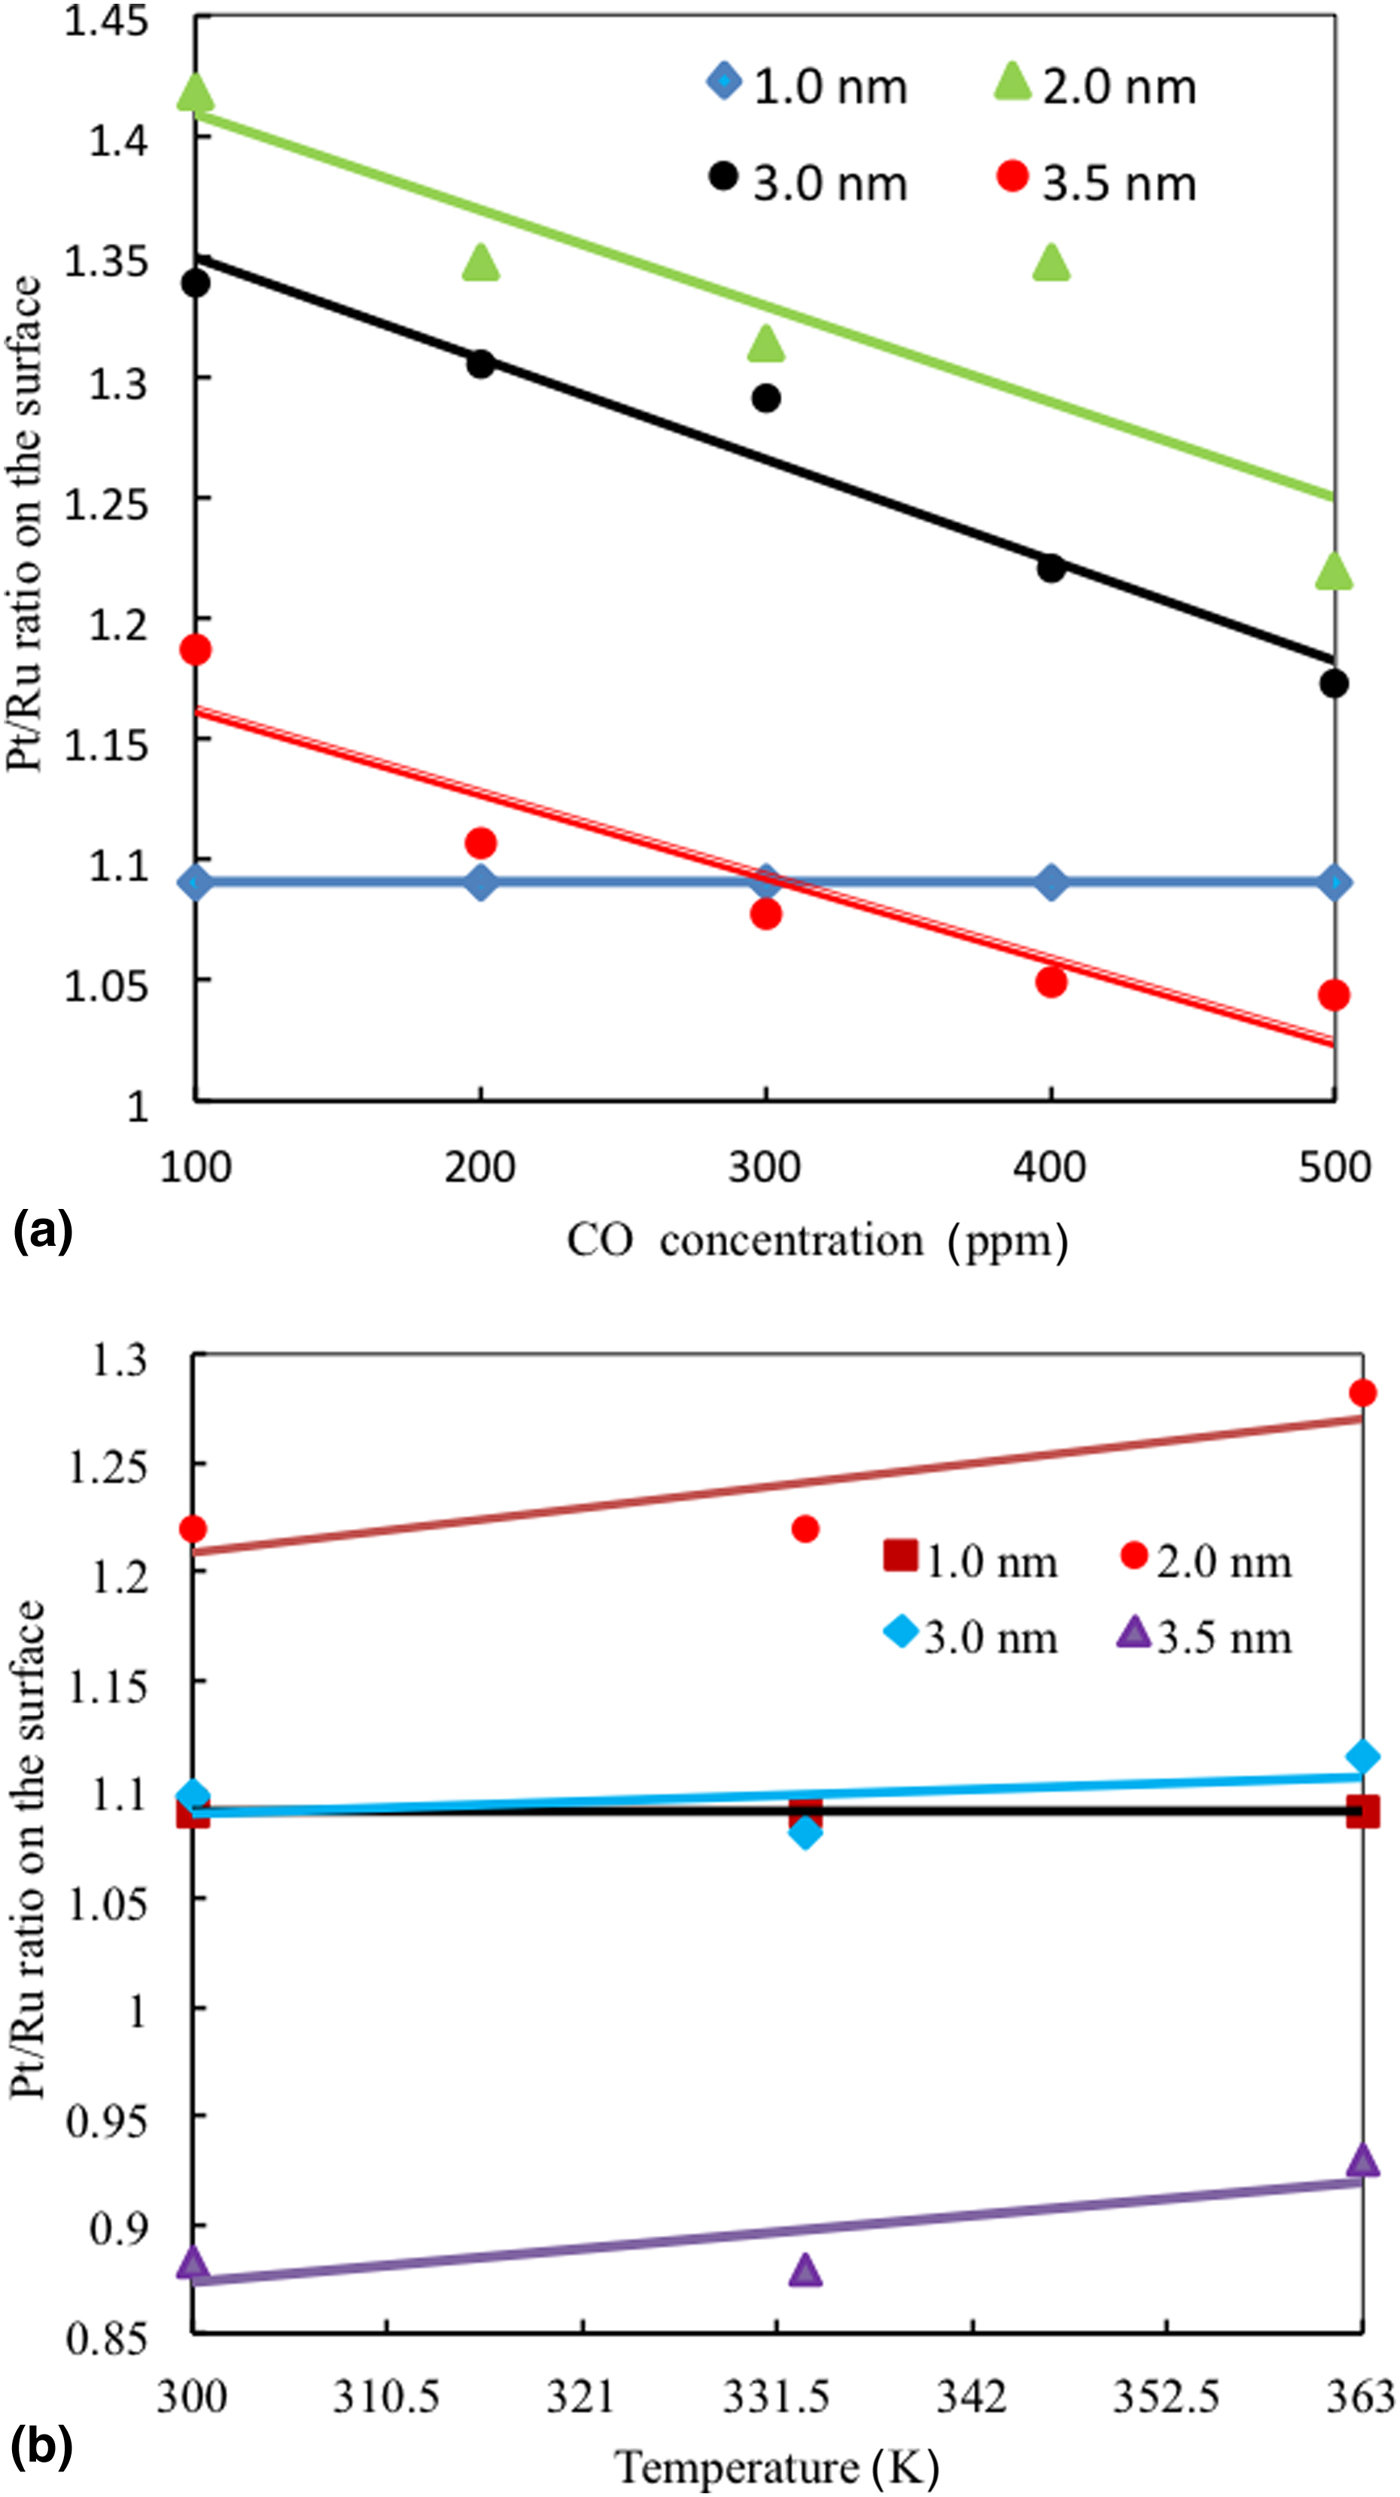
Figure 3(b) shows the MC results for the Pt/Ru ratio on the surface as a function of temperature. The simulations were performed when P H2 = 70 kPa and P CO = 10.13 Pa (100 ppm). This figure shows that the Pt/Ru ratios keeps almost constant or slightly increase with the increase in the temperature for the nanoparticle larger than 2.0 nm. According to Table III (a), the MLR coefficient of χ Pt–S is negative, which means that the system becomes stable when Pt atoms are exposed on the surface. As the temperature increases, the nature of alloy stable conformation becomes dominant compared with the contribution of gas adsorption.
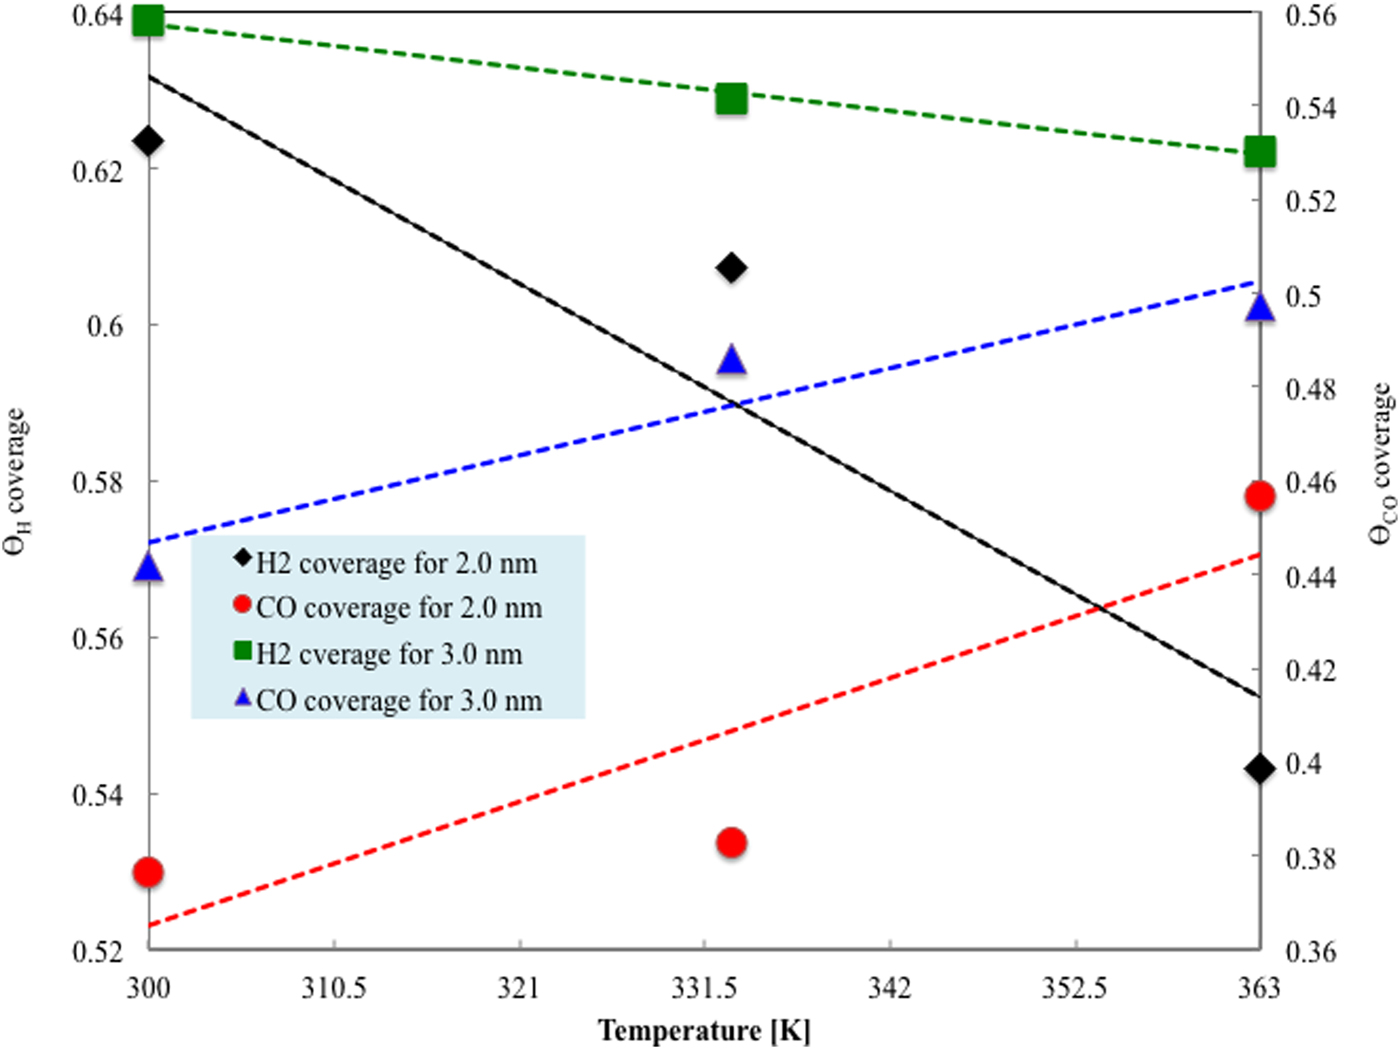
Figure 4 shows the surface coverage of CO (ϴCO) under the fixed H2 and CO partial pressure (P H2 = 70 kPa and P CO = 10.13 Pa [100 ppm]). We have analyzed CO concentration effect for two different nanoparticle alloys (2.0 and 3.0 nm) in a temperature range of (300–363 K) using the MC simulations. From the simulation results for different temperature, we noticed that number of Pt–CO and Ru–CO bonds increases with the increasing temperature. There are stronger bonds between the CO and Pt compared with H2 and the Pt from DFT results. From the MC simulations for CO concentration 100 ppm values of ϴCO varies from 0.37 to 0.54 of the temperature range (300–363 K) that have good consistent with experimental reports.[Reference Sato, Kunimatsu, Uchida and Watanabe50]
CO coverage (ϴCO) and H2 coverage (ϴH) on the surface of Pt2Ru3 nanoparticle for partial pressure [P H2 = 70 kPa, P CO = 10.13 Pa (100 ppm)] as a function of temperature.
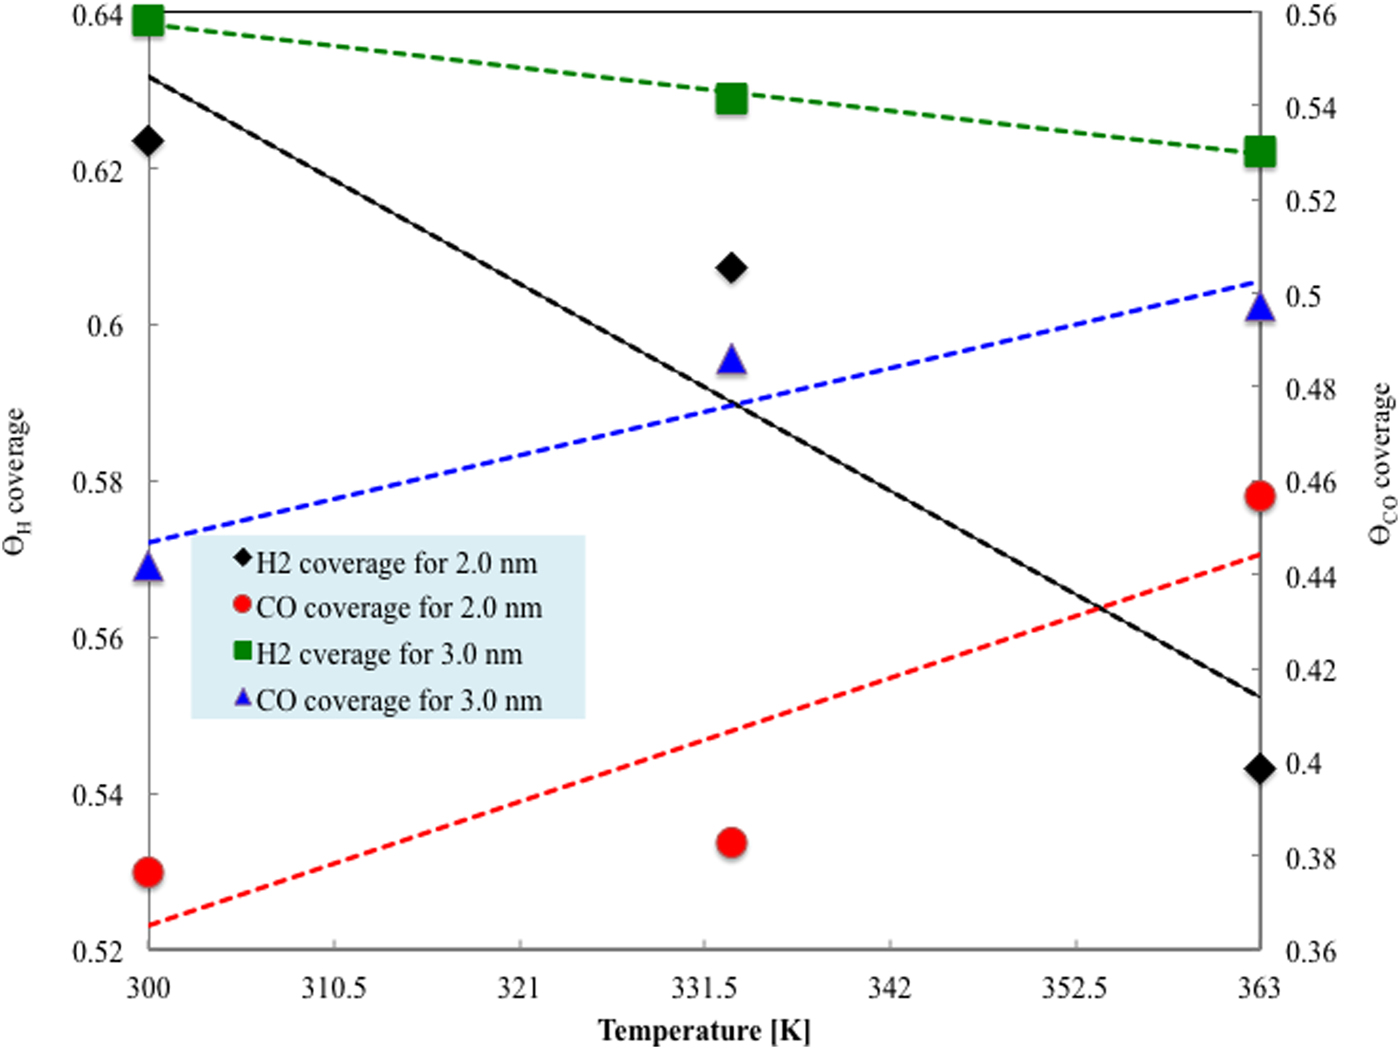
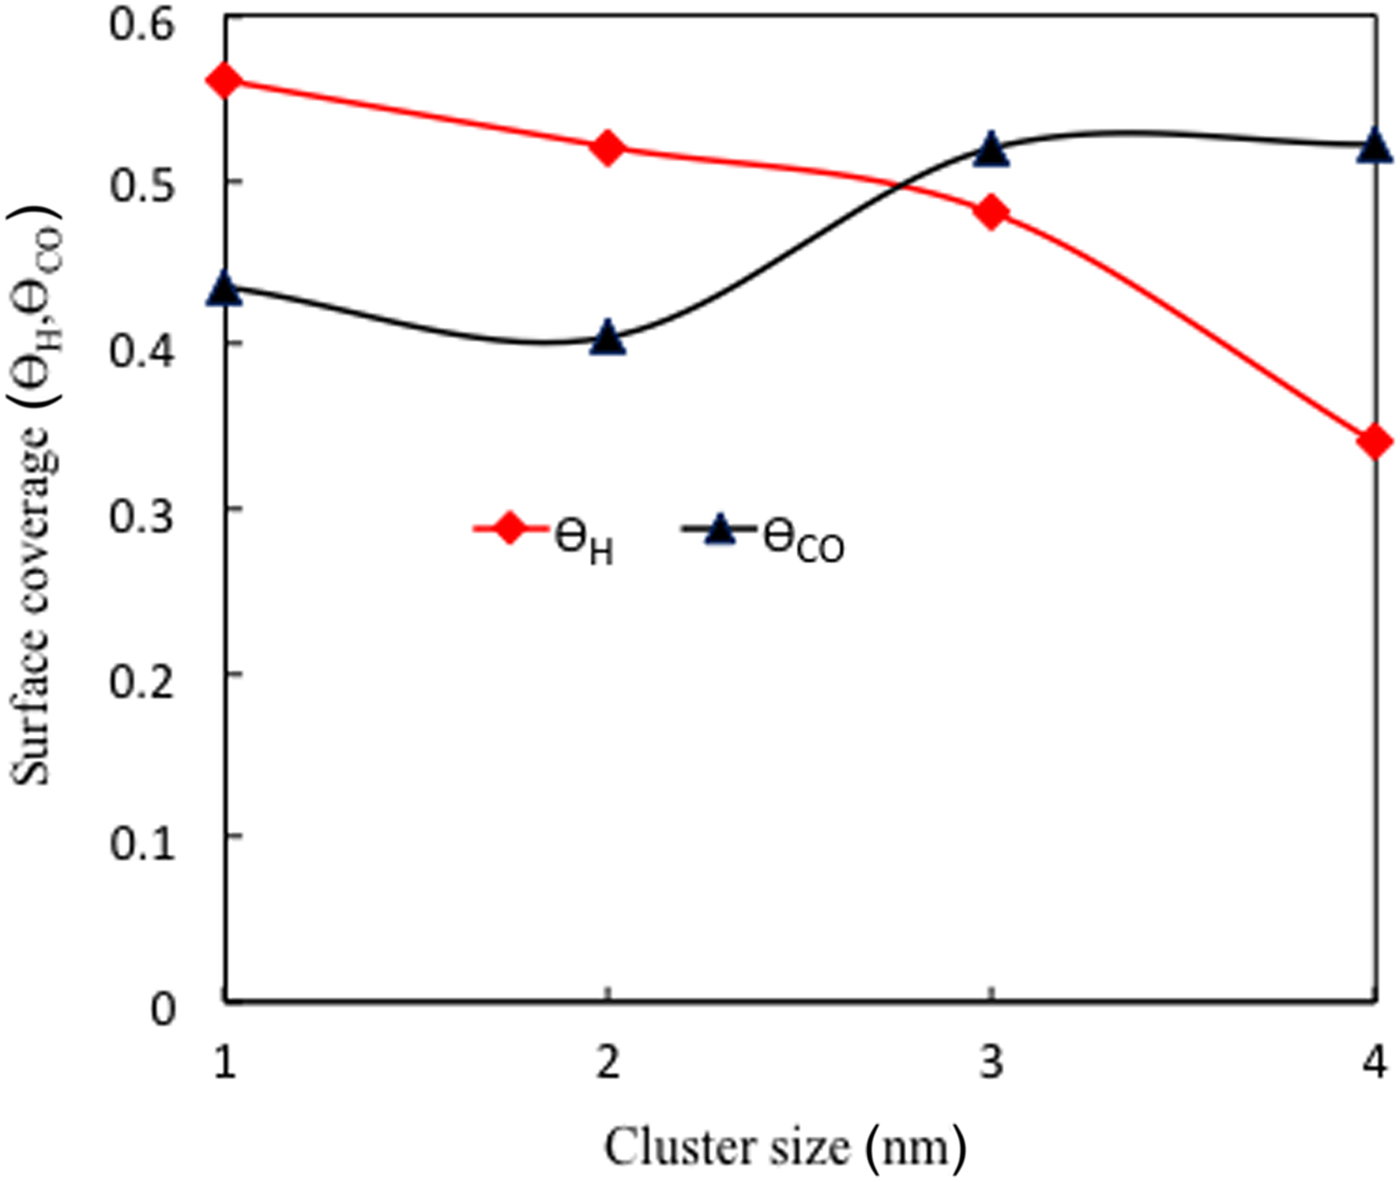
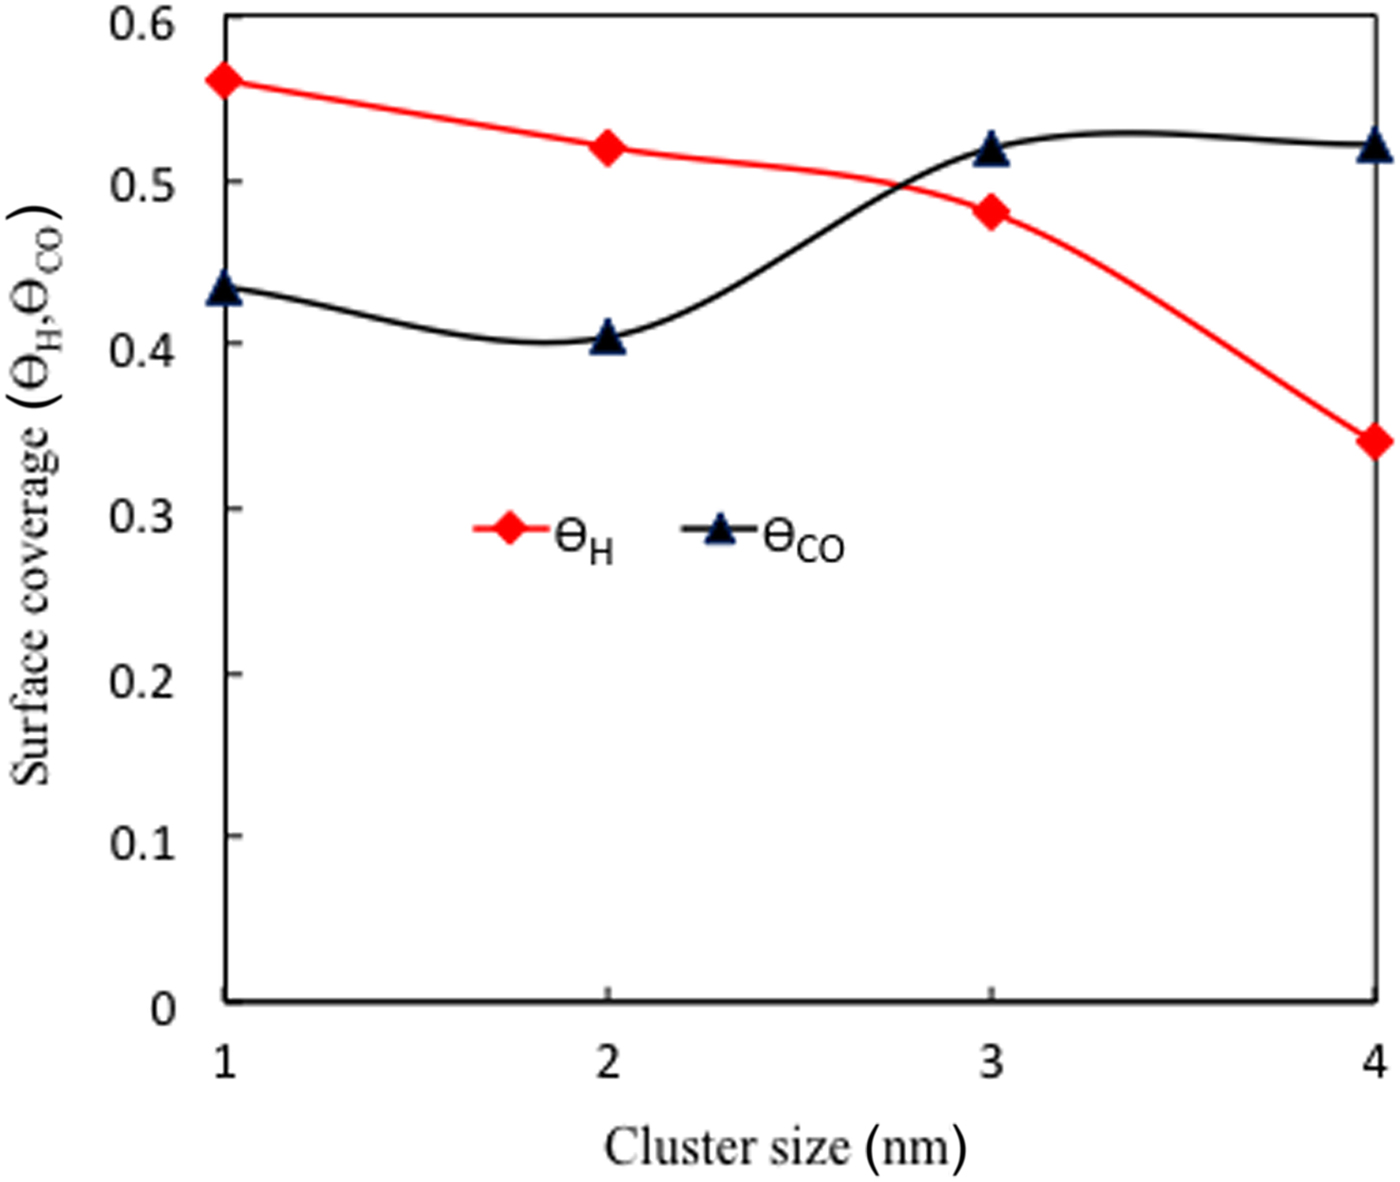
Figure 4 also shows the surface coverage by the hydrogen coverage (ϴH) under the fixed H2 and CO partial pressure [P H2 = 70 kPa and P CO = 10.13 Pa (100 ppm)]. From the surface coverage effect by the hydrogen, we observed the just reverse trend of CO coverage on the Pt2Ru3 surface. The hydrogen coverage (ϴH) on the alloy surface decreases with the increasing temperature. In the earlier part, we have discussed our DFT result that CO preferably adsorbed on the Pt and Ru sites compared with the hydrogen. For a constant pressure of H2 and CO, the coverage of ϴH reached in the equilibrium structure at 0.53 from 0.56 for 2.0 nm cluster and ϴH reached 0.56 from 0.62 for 3.0 nm of a temperature range (300 – 363 K) which has similar tendency of previous experimental reports for 1% CO content with various (40–80%) hydrogen content.[Reference Wang, Chu, Yan and Hsueh51] Fig. 5 shows the surface coverage of ϴH and ϴCO at 333 K as a function of cluster size. From the simulation results, it shows that the hydrogen coverage on the metal cluster decreases with the increasing size of the cluster. On the other hand, ϴCO increases with the increasing cluster size. Small cluster easily gets the equilibrium position and surface sites maintaining constant Pt/Ru ratio on the surface site, which is good for the stability of anode catalyst against CO.
ϴH and ϴCO coverage on the surface as a function of cluster size at 333 K.
Thus, our research identifies that regulating the nanoparticle size, composition, conformation of alloying atoms, concentration and chemical potential of adsorbates have impact on the steadiness of nanoparticle alloys which ultimately and also overall catalytic performance during the operations.
Conclusion
In this paper, we have reported equilibrium conformation of intermixture atoms in the Pt2Ru3 alloy in the presence adsorbing gases for a wide range of CO concentration (100–500 ppm) at finite temperature. Our approach combines DFT with finite temperature Monte Carlo, connected through quantitative structural property relationship. Calculation results of DFT display that the adsorption nature of the adsorbates relies on the mixing ratio of intermixing atoms and also on the arrangements of the adsorption site, nature of first neighboring atoms, nature, and composition of 2nd layer. A Monte Carlo simulation model was developed with parameters based on DFT results. The simulation was used to investigate how the nanoparticle structure evolves with chemical potential of adsorbing gases. It was demonstrated that gas adsorption can change the surface composition. The results of the MC simulations indicated that equilibrium conformation of the Pt2Ru3 nanoparticle depends on the partial pressure of the gases (CO and H2). The ratio of the Pt/Ru decreased with the increasing CO concentration. Surface coverage of CO (ϴCO) on the Pt2Ru3 surface increased with temperature and CO concentration. On the other hand, the surface coverage of hydrogen (ϴH) decreased with the increasing temperature as well as CO concentration. Hence, surface coverage and segregation of Pt to the surface depends on the pressure and chemical potential of the adsorbates, temperature, and size of the nanoparticle during the processing of catalysts.
Supplementary material
The supplementary material for this article can be found at https://doi.org/10.1557/mrc.2018.44
Acknowledgments
We gratefully acknowledge the New Energy and Industrial Technology Development Organization (NEDO) for the financial grant.