1 Introduction
Question answering (QA) systems have been under development for many years and include systems designed to support retrieval from structured databases (c.f., Woods, Kaplan and Nash-Webber, Reference Woods, Kaplan and Nash-Webber1972) and those used to support retrieval from unstructured collections of documents (cf., Harabagiu et al., Reference Harabagiu, Hickl, Lehmann and Moldovan2005). Current development is moving towards QA systems that support a range of question types and interactions with users (cf., Maybury, Reference Maybury and Maybury2004; Strzalkowski and Harabagiu, Reference Strzalkowski and Harabagiu2006). In this paper, we focus on interactive QA systems that have been designed to support human users engaged in complex, analytical information tasks, such as those that are typically performed by intelligence analysts (Maiorano, Reference Maiorano, Strzalkowski and Harabagiu2006). By interactive QA system we mean a QA system that supports at least one exchange between the user and the system, and that allows the user some control over the content that is displayed and the actions that are taken.
With the design of interactive QA systems comes the challenge of determining how to evaluate such systems in their interactions with end-users. The TREC (Text Retrieval Conference) QA and Interactive Tracks (Voorhees and Harman, Reference Voorhees and Harman2005) provide ways to evaluate QA systems for fact retrieval and systems that support interactive information retrieval (IR), respectively, but they do not show us how to evaluate interactive QA systems. Evaluation approaches created for dialogue systems such as those described in Walker et al. (Reference Walker, Litman, Kamm and Abella1997) and den Os and Bloothooft (Reference den Os and Bloothooft1998) provide techniques for investigating systems that are driven by dialogue interactions, but they do not show us how to evaluate systems that employ a variety of interactive techniques.
The TREC QA Track evaluation paradigm is system-oriented and evaluates techniques used for answer extraction (Voorhees Reference Voorhees, Voorhees and Harman2005). No users are involved in these evaluations, and interaction and use are not focal points of the evaluation framework. Historically, this evaluation approach has focused on retrieval for factual questions rather than retrieval for other question types, such as analytical questions (Maybury Reference Maybury and Maybury2004). Analytical QA differs from factual QA in that answers are often multi-dimensional and require combining information from multiple sources. Analytical QA includes factual QA and other activities, such as comparison and synthesis, and therefore demands much richer interactions among the system, the information and the user. Examples of analytical QA research include Harabagiu et al. (Reference Harabagiu, Hickl, Lehmann and Moldovan2005) and Small et al. (Reference Small, Strzalkowski, Janack, Liu, Ryan, Salkin, Shimizu, Kantor, Kelly, Rittman, Wacholder and Yamrom2004) (see Strzalkowski and Harabagiu, Reference Strzalkowski and Harabagiu2006 for an overview of advances in analytic QA and descriptions of other research efforts).
The TREC QA Track has expanded recently to other question types, such as relationship questions, and by adding an interactive QA task (Dang, Lin and Kelly, Reference Dang, Lin, Kelly, Voorhees and Buckland2007). A relationship is said to exist between two entities when there is ‘the ability of one entity to influence another,’ and relationship questions address both the means of influence and the motivation for doing so. Such questions have been identified as a type of information need often experienced by intelligence analysts. The complex interactive QA task (ciQA) provided an evaluation framework for participants to investigate QA interaction for relationship questions within the confines of a single interaction. In particular, ciQA measured the impact of various single-cycle interactions on the performance of QA systems, using evaluation measures used in noninteractive QA research. The goal of the ciQA task was not to suggest holistic evaluation measures for interactive QA systems or measures for evaluating the quality of the interaction or the process of finding information. The focus was instead on the outcome of the interaction; this is obviously important, but it does not tell the whole story. The ciQA evaluation method did not elicit evaluation data from system users and given that users are one of the major players in the interaction, we feel that this is an important limitation. Overall, the method used in ciQA is most suited to formative evaluation of individual aspects of QA interaction, rather than for summative system evaluations.
In the context of IR, the TREC Interactive Track led research and development of evaluation methods for interactive IR systems for 9 years (Hersh and Over, Reference Hersh and Over2001; Dumais and Belkin, Reference Dumais, Belkin, Voorhees and Harman2005). The overall design issues associated with conducting user-centered IR evaluations were presented by Tague-Sutcliffe (Reference Tague-Sutcliffe1992) (see also Borlund, Reference Borlund2003a). One basic change in viewpoint needed to study interactive systems with real users is to leave the TREC evaluation model which posits that specific items are relevant, leading to measures such as precision and recall. The TREC model assumes fixed relevance judgments made by a single (idealized) user (i.e., a TREC assessor). It is not clear that the same judgments would be made by other users, and it is well documented that relevance judgments vary according to user, task, and context (Borlund, Reference Borlund2003b). Another major finding of interactive IR research conducted so far is that results obtained in non-user evaluations do not always translate to user-centered evaluations (Hersh, Reference Hersh, Strzalkowski and Harabagiu2006). For example, two systems might perform (measurably) differently within the context of a TREC QA evaluation, but this difference might not be observed when people use the systems in either laboratory or naturalistic settings. Thus, there is a need to create methods, and metrics supporting multi-user evaluations which are not dependent on objective relevance judgments are needed. In this paper we focus on questionnaires. Although individual researchers have developed a range of questionnaires to supplement their evaluations of interactive IR systems, these questionnaires have varied as much as the systems studied and no major effort has been made to develop a single questionnaire that is general enough to be used across a range of interactive IR systems.
Recent work in the QA community considers how to evaluate QA systems that support complex analytical tasks, with real users (Diekema et al., Reference Diekema, Yilmazel, Chen, Harwell, He, Liddy and Maybury2004; Liddy, Diekema and Yilmazel, Reference Liddy, Diekema and Yilmazel2004; Kelly et al., Reference Kelly, Wacholder, Rittman, Sun, Kantor, Small and Strzalkowski2007; Wacholder et al., Reference Wacholder, Kelly, Rittman, Sun, Kantor, Small and Strzalkowski2007). Diekema et al. (Reference Diekema, Yilmazel, Chen, Harwell, He, Liddy and Maybury2004) evaluated the Knowledge Acquisition and Access System (KAAS), a QA system for undergraduates in aeronautical engineering. They worked in a natural environment, using data from system logs and users' responses to open-ended survey questions. Wacholder et al. (Reference Wacholder, Kelly, Rittman, Sun, Kantor, Small and Strzalkowski2007) describe a series of 3-day evaluations of HITIQA (Small et al., Reference Small, Strzalkowski, Janack, Liu, Ryan, Salkin, Shimizu, Kantor, Kelly, Rittman, Wacholder and Yamrom2004), a complex QA system designed to support intelligence analysts' exploratory research for analytical questions. Analysts used HITIQA to prepare reports on various scenarios and participated in a number of evaluation exercises including questionnaires, interviews, and report ratings. Finally, Hersh (Reference Hersh, Strzalkowski and Harabagiu2006) describes a series of studies conducted within the medical domain that evaluated users' abilities to answer clinical questions using relatively traditional IR systems. The methods and metrics employed in these studies were similar to those used in interactive IR evaluations and the systems being studied were not designed specifically to support the resolution of complex, analytical questions. While these research efforts offer measurement methods, they do not focus on the development and evaluation of the methods and metrics per se. Such a step is needed to validate them so that they can be used by other researchers.
Walker et al. (Reference Walker, Litman, Kamm and Abella1997) and den Os and Bloothooft (Reference den Os and Bloothooft1998) proposed methods for evaluating spoken dialogue systems. These methods were meant to be general, in that no specific task or use situation was described. The performance function proposed by Walker et al. (Reference Walker, Litman, Kamm and Abella1997) was based on the success and costs of spoken dialogue interactions, as well as a single-user satisfaction measure. It is an important limitation of this method that only a single satisfaction measure was elicited from users. Satisfaction is a complex construct and it is difficult to imagine that any single question can reliably assess this construct in this context. For instance, den Os and Bloothooft (Reference den Os and Bloothooft1998) proposed and evaluated a general questionnaire designed to assess the quality of spoken dialogue interactions. den Os and Bloothooft (Reference den Os and Bloothooft1998) found that five factors contributed to user opinions of the systems: (1) general appreciation; (2) functional capabilities; (3) intelligibility of the output speech; (4) proficiency in the system's language; and (5) familiarity with spoken dialogue systems. While some interactive QA systems of the sort that are the focus of this paper have a dialogue module, not all of them do; few, if any, have a spoken dialogue component. Therefore, dialogue-centered evaluation methods are not entirely appropriate to the situation that is under study in this work. Finally, we note that the purpose of our work is to evaluate the utility of systems, rather than the effectiveness of dialogue episodes, so the unit of analysis also differs.
2 The problem
The work reported here seeks to fill the gap just mentioned by developing and validating methods and metrics for evaluating the utility of interactive, analytical QA systems. An overview of the study method is provided elsewhere (Kelly et al., Reference Kelly, Kantor, Morse, Scholtz and Sun2006). In this paper, we provide a detailed look at the questionnaires used in the evaluation. These questionnaires proved to be effective at distinguishing among systems, and they can be applied easily to other interactive QA evaluations. We focus on three types of questionnaires: a Cognitive Workload Questionnaire (NASA Task Load Index), a Task Questionnaire (completed after each specific task), and a System Questionnaire (completed after using a system). To our knowledge, this is the first research effort to develop and evaluate a set of questionnaires for use in assessing the utility of interactive QA systems designed to support the investigation of complex, analytical tasks.
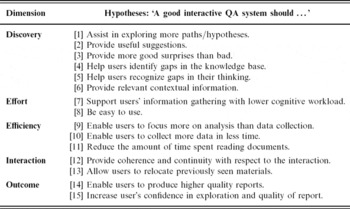
Development of the instruments followed a set of working hypotheses about the general benefits that a ‘good’ QA system should provide (Table 1). The hypotheses were developed during planning meetings involving the authors, several system developers, and representatives of the intelligence community, and were informed by research described in Kelly et al. (Reference Kelly, Wacholder, Rittman, Sun, Kantor, Small and Strzalkowski2007). No claim is made about the exhaustiveness and comprehensiveness of these hypotheses. We pose them as starting points for evaluating systems with interactive QA capabilities. As advances occur, this list may grow and change, but we do not expect that this will happen rapidly.
Dimensions and hypotheses used to guide the development and evaluation of Questionnaires

The hypotheses relate to five putative dimensions of either the task or the system: discovery, effort, efficiency, interaction, and outcome. After considerable discussion we converged on these hypotheses as general enough to address many of the functionalities of current interactive QA systems. We note that each hypothesis implies a comparison, which requires the testing of at least two systems. This might be a direct comparison of two systems at the same point in time or a comparison of the same experimental system at two points in time.
This study includes three experimental, interactive QA systems and one baseline system. We stress that the goal is not to evaluate the systems, but to evaluate the efficacy of our instruments in distinguishing among these four systems, with respect to the hypotheses. Our subjects were representative of the target users, intelligence analysts who use such systems to meet information needs related to their jobs. The systems, users, and tasks are described in more detail in the next section.
3 Methods and materials
The research was done at the Pacific Northwest National Laboratory in Richland, WA as a U.S. government Department of Defense Advanced Research and Development Activity (ARDA) Challenge Workshop. The work spanned 3 weeks: one week in on-site preparation of tools and systems, and two weeks conducting the evaluation.
3.1 Systems
The systems were three state-of-the-art interactive QA systems and a Google baseline. Each QA system was an example of an end-to-end system developed under the ARDA Advanced Question Answering for Intelligence (AQUAINT) program. The QA system developers allowed us to use their systems to validate our evaluation methodology, which was the purpose of our research. Their participation was encouraged by the program manager and individual systems were chosen so that the set of systems exhibited widely divergent approaches to addressing the problem of QA. The Google appliance with its standard search interface was used to create the baseline system.
The three experimental QA systems are not named here as they are not the focus of the research reported in this paper. Although the features and interaction techniques differed across system, the underlying goal of all systems was to help analysts in complex, analytic tasks. All systems required analysts to enter natural language queries to initiate their interactions and all provided answer sets for analysts to review. Aspects that distinguished systems included whether or not they engaged analysts in dialogue, how they presented results to analysts, and how they elicited and used feedback from analysts.
3.2 Subjects
Seven intelligence analysts used each system. The analysts were volunteers serving a yearly 2-week service requirement as U.S. Naval Reservists. They were recruited by email solicitation to a large pool of potential volunteers. The first eight people to respond were accepted into the study, but only seven analysts were present for the entire experiment. The analysts' ages ranged from 30 to 54 years. Their education levels ranged from high school diploma to Ph.D.; over half had Master's degrees. The number of years they had served in the military ranged from 2.5 to 25, and the number of years spent doing intelligence work ranged from 0 to 23.
3.3 Scenarios and tasks
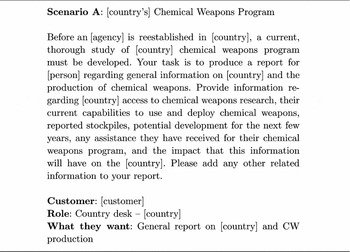
Fourteen scenarios were developed by analysts from the Air Force Rome Research Lab (U.S.) and were later vetted to ensure their appropriateness to the corpus. In total, eight scenarios in the domain of chemical/biological weapons of mass destruction were used. Each scenario included a title and description of an information need, as well as information about the target audience for the report. An example scenario is shown in Figure 1. The assigned ‘task’ for analysts was to gather information about the scenario using one of the QA systems and to write a report similar to the kind they would write while doing intelligence work for a specific ‘customer.’ The customer, the role, and a description of what was desired in the report was provided at the bottom of each scenario. We refer to analysts' work products as ‘pseudo-reports,’ since they were not as comprehensive as the ones they would produce in their normal jobs, given the time and corpus constraints.
Example scenario (information redacted as part of the funder's internal review process).

The primary corpus was the AQUAINT Center for Non-Proliferation Studies (CNS) corpus. This consists of the January 2004 distribution of the Eye on Proliferation CD-ROM collection, which has been disaggregated by CNS into about 40,000 documents. When the initial fourteen scenarios were delivered to the National Institute of Standards and Technology (NIST), they were compared with the CNS corpus. Several scenarios had less than hundred documents in the CNS corpus and were subsequently judged inadequate for the pseudo-report task. The corpus was further supplemented by mining the Web. Documents were collected from the Web by semi-automated querying of Google and manual selection of documents in the result sets. The approximate sizes of the different kinds of files, as determined by their file extensions, are summarized in Table 2.
Size of corpus in bytes

3.4 Evaluation design
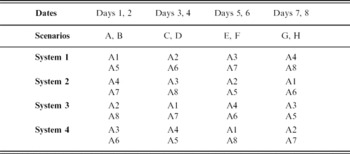
The evaluation workshop consisted of four, 2-day blocks. In each block, two analysts were assigned to one of the four rooms that contained two machines with the same QA system. Analysts worked independently and after each block rotated to different rooms. To control for potential interaction effects among analysts, systems, and scenarios, we used a modified Greco-Latin 4×4 design (Table 3). The goal in using this design is to ignore the effect of second-order interactions, so that estimates of the main effects can be obtained from a much smaller set of observations than is required for a full factorial design. For instance, one might imagine potential interaction effects of system and scenario (some systems might be better for certain scenarios); system and analyst (some analysts might adapt more quickly to a system); and analyst and scenario (some analysts might be more expert for certain scenarios). This design ensured that each analyst used each of the four systems and that each system was, for some analyst, the first, second, third, or last to be encountered. This also ensured that no analyst did any scenarios twice and that analyst pairings were unique.
Greco-Latin 4×4 evaluation design (A: analyst)

It was noted earlier that analysts varied according to their level of experience in performing intelligence tasks and also along other individual attributes, such as age and education. While the design in Table 3 distributes the potential effects of these attributes across systems by requiring that each analyst uses each system an equal number of times, it does not let us investigate the potential impact of these attributes. This would require a larger number of subjects, the identification of specific attributes of interest, and a stratified sampling technique to ensure that an equal number of subjects representing the specific attributes were studied.
3.5 Data collection
A variety of data collection methods and instruments were used in this study. Five techniques were used to assess experiences and attitudes: Task Questionnaire, System Questionnaire, Cognitive Workload Questionnaire, interviews, and focus groups. System logs, Glass Box (Cowley, Nowell and Scholtz, Reference Cowley, Nowell and Scholtz2005; Cowley et al., Reference Cowley, Haack, Littlefield and Hampson2006), and naturalistic observation were the core logging methods and provided data about analysts' interactions with systems and their search processes. Cross-evaluation (Sun and Kantor, Reference Sun and Kantor2006) was the primary quantitative method for evaluating reports that analysts produced. Cross-evaluation is both an activity and an instrument; it requires analysts to review each other's reports anonymously and rate each report according to seven quality criteria. The Task, System, and Cognitive Workload Questionnaires are the primary focus of this paper and are discussed in greater detail in Sections 3.6 and 3.7. Other instruments and methods will be described only briefly. Interested readers are referred to Kelly et al. (Reference Kelly, Kantor, Morse, Scholtz and Sun2006) for more detailed descriptions of these instruments and methods.
System logs were standard logs that recorded analysts' interactions with systems. These logs were developed by the system developers, although some requirements were specified by the research team. Glass Box is a client-side application which captures and archives all workstation activities, and also allows for subsequent retrieval and analysis of this data (Cowley et al., Reference Cowley, Haack, Littlefield and Hampson2006). This tool was developed as part of another project to study intelligence analysts' natural research activities (Novel Intelligence from Massive Data). This tool allowed us to obtain a very complete record of analysts' activities, including those related to report creation. In addition to these two types of logging, a trained researcher observed each pair of analysts while they worked.
Experimental blocks were divided into two sessions: each session corresponded to a scenario. Instruments were used throughout the experimental block (e.g., logging), at the end of the session, (e.g., the Task Questionnaire for each scenario), or at the end of the block (e.g., the System Questionnaire). When all of the work of writing and evaluating reports was completed, focus group interviews were conducted to understand more about analysts' overall experiences, and to learn more about the study method. The evaluation design gave analysts an opportunity to fully interact with four QA systems, and to complete time-limited tasks similar to their normal work tasks. From our perspective, this meant that we could evaluate a range of instruments across a panel of different systems that shared a common purpose. In this paper, we focus on the three questionnaires: the Cognitive Workload Questionnaire (NASA TLX), the Task Questionnaire, and the System Questionnaire.
3.6 Cognitive workload questionnaire: NASA TLX
The NASA TLX (Hart and Staveland, Reference Hart, Staveland, Hancock and Meshkati1988) was used to assess analysts' cognitive workloads as they completed scenarios. The NASA TLX was expected to evaluate hypotheses related to effort. Six factors comprise the NASA TLX:
(1) Mental demand: How much mental and perceptual activity was required (e.g., thinking, deciding, calculating, remembering, looking, searching, etc.)? Was the task easy or demanding, simple or complex, exacting or forgiving?
(2) Physical demand: How much physical activity was required (e.g., pushing, pulling, turning, controlling, activating, etc.)? Was the task easy or demanding, slow or brisk, slack or strenuous, restful or laborious?
(3) Temporal demand: How much time pressure did you feel due to the rate or pace at which the tasks or task elements occurred? Was the pace slow and leisurely or rapid and frantic?
(4) Performance: How successful do you think you were in accomplishing the goals of the task set by the experimenter (or yourself)? How satisfied were you with your performance in accomplishing goals?
(5) Frustration: How insecure, discouraged, irritated, stressed, and annoyed versus secure, gratified, content, relaxed, and complacent did you feel during the task?
(6) Effort: How hard did you have to work (mentally and physically) to accomplish your level of performance?
Each factor is rated across the same scale, but the choice of scale is arbitrary. We used a seven-point scale, where ‘1’ corresponded to ‘little’ and ‘7’ corresponded to ‘much.’ Analysts completed these ratings twice for each system, once after each scenario.
After analysts completed two-factor ratings (two for each scenario), they completed the NASA TLX weighting instrument. This elicited rankings of the relative importance of the six factors, for each system. Analysts completed all possible pairwise comparisons of the six factors. The number of times that a factor was rated more important by an analyst indicates the relative importance of the factor. Results of these comparisons are converted to a weight for each of the six factors and the individual factor score is multiplied by this value. It is standard practice to elicit weightings for each task, but in this study analysts completed the weighting instrument four times--once for each system, which generated different factor weightings for each system.
3.7 Task and System Questionnaires
The Task and System Questionnaires were created for this evaluation exercise and most of the questions were designed to evaluate interactive QA systems. Analysts completed the Task Questionnaire after each task and the System Questionnaire after they finished using a system. The key difference between these two Questionnaires is that the Task Questionnaire asked analysts about their experiences using a system for the particular scenario just completed, while the System Questionnaire asked analysts to consider their experiences using the system to complete both scenarios.
Questionnaires were developed by a team of researchers including the authors and the QA system researchers; the development of the questions was guided by the hypotheses and dimensions identified earlier, and by questionnaires used in Wacholder et al. (Reference Wacholder, Kelly, Rittman, Sun, Kantor, Small and Strzalkowski2007). Question development was iterative; we started with a much larger list of questions and narrowed and refined the questions over time. Standard usability questionnaires, such as QUIS (Chin, Diehl and Norman, Reference Chin, Diehl and Norman1988) were not used because such questionnaires are too general for our purposes and do not address QA functionality. In particular, standard usability questionnaires do not address all of the dimensions we were interested in measuring.
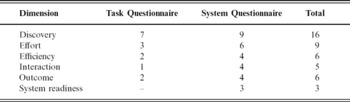
Table 4 shows how many questions assessed each dimension. Many questions assessed the discovery dimension as the Questionnaires were the primary tool for investigating discriminability among systems with regard to this aspect. Nine questions were used in conjunction with the NASA TLX to assess effort. Six questions assessed outcome and were used in conjunction with cross-evaluation. The dimensions of efficiency and interaction were not heavily addressed by the Questionnaires, but data about these dimensions were supplemented with log data. Furthermore, it is, in general, difficult to develop questions that assess these dimensions for comparisons among systems because the types of interactions supported by systems differed. However, individual system developers added questions that were customized to unique features of their systems (these questions are not shown here). Finally, three questions assessed an issue unrelated to the comparative hypotheses: the readiness of the system for an operational environment.
Number of questions from questionnaire associated with each dimension

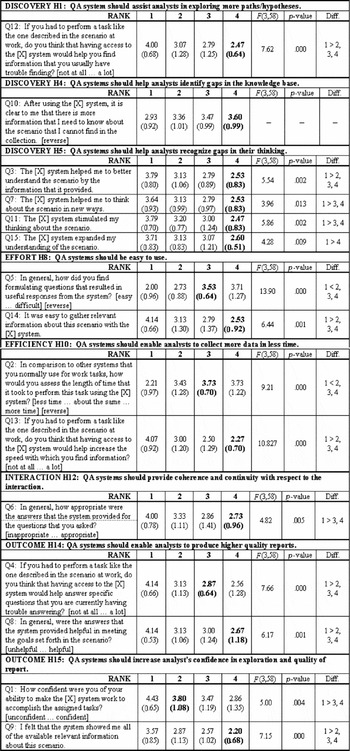
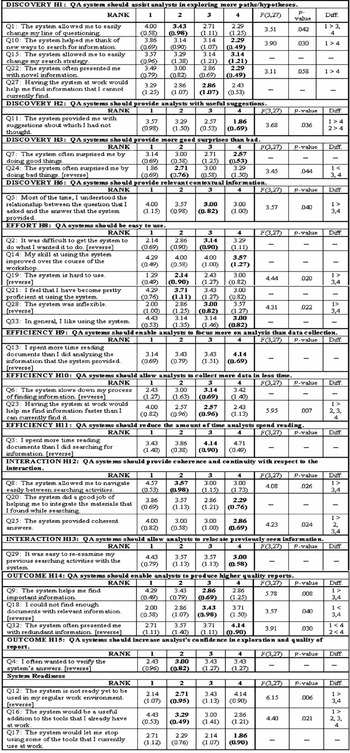
The Questionnaires are presented in Section 4 of this paper (Figures 2 and 3). All questions were assessed with five-point Likert-type scales, where ‘1’ was labeled ‘strongly agree’ and ‘5’ was labeled ‘strongly disagree.’ For a few questions in the Task Questionnaire, labels were changed as appropriate to the question. For those questions, the scale labels are shown in Figure 2 in the Results section. For most questions, higher scores are better, but for some, the direction is reversed and smaller numbers are better (e.g., Q2 and Q5 from the Task Questionnaire). These questions are marked by the word ‘reverse’ in the tables. A five-point scale was selected since this is the number of points used by Likert (Reference Likert1932) who initially proposed such scales.
Means, standard deviations, results of ANOVA tests (including F-statistics, degrees of freedom, and p-values) and Scheffe's pairwise comparisons (Diff. column) for the Task Questionnaire. For each question, scores are ordered from best to worst, not according to system. Higher scores are better except where the word ‘reverse’ appears. Scores for the baseline system are in bold. All scales contain five points with the labels ‘strongly agree’ and ‘strongly disagree’ unless otherwise noted.

Means, standard deviations, results of ANOVA tests (including F-statistics, degrees of freedom, and p-values) and Scheffe's pairwise comparisons (Diff. column) for the System Questionnaire. For each question, scores are ordered from best to worst, not according to system. Higher scores are better except where the word ‘reverse’ appears. Scores for the baseline system are in bold. All scales contain five points with the labels ‘strongly agree’ and ‘strongly disagree’ unless otherwise noted.

4 Results
4.1 NASA TLX questionnaire
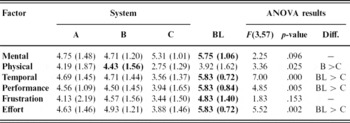
Table 5 displays the unweighted mean ratings analysts assigned to the different systems for each factor. The highest mean rating for each factor is in bold. This table also displays results of the Analysis of Variance (ANOVA) tests (including F-statistics, degrees of freedom, and p-values), and the results of Scheffe's pairwise-comparison tests (‘Diff.’ column). In cases where no statistically significant differences were found dashes appear in the last column.
Means (standard deviations) of unweighted scores for each factor and ANOVA results (BL: baseline)

Highest scores are in bold.
The ANOVA and Sheffe's tests are used in subsequent analyses reported in this paper and will be explained briefly. ANOVA is an inferential statistical test that determines whether differences among means are statistically significant (a fixed effects model is used). The p-value is the probability that the observed difference between means would happen by chance if the scores for the two systems were in fact drawn from the same distribution. For instance, a p-value of .01 means that there is a 1/100 chance that a difference of the observed size occurred by chance. It is standard practice in the social sciences to accept a p-value of .05 or less; this value will be used in analyses reported in this paper to identify statistically significant differences.
The Scheffe's test is a post-hoc test that is used to control the effect of multiple hypotheses, and is used if significant differences are found by the ANOVA. ANOVA can demonstrate that at least one statistically significant difference exists between means, but does not indicate between which pairs of means this occurred. In this case, there are four means (one for each system) and the Scheffe's test indicates the pair(s) of means between which the difference was significant. For instance, for the physical factor, the Scheffe's test showed a statistically significant difference between Systems B and C, but not among any other pair of systems. The notation in the Diff. column indicates the direction of this relationship; for instance, the mean score for System B was significantly greater than the mean score for System C.
For all but one factor, the baseline system received the highest score (indicating more effort) and System C received the lowest scores (indicating less effort). Statistically significant differences between means were detected among systems for four factors: physical, temporal, performance, and effort. In each case, the Scheffe's tests identified only one significant pair and System C's scores were always significantly lower. Overall, it appears that at least for two of the systems the unweighted TLX scores are sufficient at discriminating the top-performing system from the bottom-performing system.
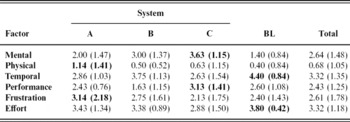
Results of the NASA TLX weighting instrument should provide some indication of the relative importance of each factor, overall, and for each system. Table 6 displays the mean weights that analysts assigned to each factor overall and for each system. Data presented in bold indicate the highest mean weights. Overall, the temporal and effort dimensions were associated with the highest total weight (3.32) and the physical dimension was associated with the lowest total weight (0.68), which is reasonable for reading, thinking, and typing. It appears that the amount of time and effort expended while using the system were the most important factors contributing to analysts' cognitive workloads. When factor weights for individual systems are examined, it becomes apparent that the factors which were selected the most often varied. It is important to note that these weights were generated with respect to each system and comparing weights across systems is not entirely appropriate since the values are relative to each system.
Means (standard deviations) of weights assigned to each factor

Highest scores are in bold.
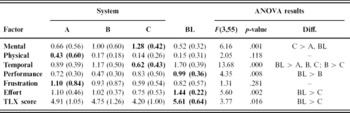
Table 7 displays the mean weighted scores for each factor for each system, which is a combination of the data from Tables 5 and 6. Statistically significant differences were found for four of the six factors: mental, temporal, performance, and effort. These results differ slightly from the results for the unweighted scores (Table 5) in that a statistically significant difference was found for the mental factor, but not for the physical factor. It is also the case that these results are stronger than those reported in Table 5, as evidenced by the larger F-statistics. The Scheffe's tests also detected significant differences among more than one pair of means. For the mental factor, System C's mean was significantly higher than System A's and BL's. For the temporal factor, BL's mean was significantly higher than System A's and System B's, and System B's was higher than System C's. Thus, the weighting had some impact on the resulting factor scores.
Means for each NASA TLX factor and ANOVA results (BL: baseline)

Highest scores are in bold.
Overall the final TLX score (last row in Table 7) shows that System C was associated with a significantly lower cognitive workload, while the cognitive workload associated with other systems was similar. Although System C was associated with the least cognitive effort, it was also associated with the highest weighted mental score, even though it was not associated with the highest unweighted mental score (Table 5). Since the scores in Table 7 are a function of those presented in Tables 5 and 6, this discrepancy may be an artifact produced by assessing individual weights for each system rather than for the task as a whole. For instance, it may have been the case that the effort associated with System C for all factors was relatively low compared to other systems, but the mental factor may have demanded the most effort from analysts even if this demand was lower than that for other systems. Alternatively, it may be the case that a high mental factor is desirable in this situation since the analyst's work is primarily mental in nature.
4.2 Task Questionnaire
Results for the Task Questionnaire are shown in Figure 2. Questions are grouped by associated hypotheses. Figure 2 displays the means and standard deviations of the ratings analysts assigned to the systems for each question, the results of the ANOVA tests (including F-statistics, degrees of freedom, and p-values), and the results of Scheffe's pairwise-comparison tests (‘Diff.’ column). In cases where no statistically significant differences were found dashes appear in the last three columns. Systems are referred to according how they ranked on a particular question, rather than according to a particular identification code. This is not necessarily fixed, as systems were rated differently for different questions. Thus, the system whose mean score is 4.00 for the first question (Q12) may not be the same system whose score is 2.93 for the second question (Q10). Scores for the baseline system are in bold.
Overall, these results show that most questions on the Task Questionnaires are able to distinguish among at least two groups of systems. Statistically significant differences were revealed by fourteen of the fifteen questions, and in all but two cases, the p-values were less than .01. In most cases, the questions divided systems into two groups. Sometimes one group was a singleton—that is, the score for the top-ranked system for any question was significantly better than the scores for systems ranked 2, 3, and 4. In four cases, the score for the top-ranked system was only significantly better than the scores for third and fourth ranked systems and in one case the score for the top-ranked system was only significantly better than the score for the fourth ranked system.
Another interesting finding is that there was much less variance in the scores that analysts assigned to whichever system ranked first, and to the baseline system than to the systems ranking in the remaining spots. The standard deviations for these systems usually did not exceed one point, while for the other systems the standard deviations often exceeded one. These results suggest that most analysts agreed on the scores that they assigned to whichever system was ranked highest on a question, and to the baseline system. The baseline system was ranked fourth by most questions, and in most cases its score was significantly different from whichever system ranked highest.
4.3 System Questionnaire
Results for the System Questionnaire are displayed in Figure 3. The information contained in this figure is organized similarly to that of Figure 2. For fourteen of the twenty-seven questions that were associated with hypotheses, statistically significant differences among one or more systems were detected. In addition, statistically significant differences among systems for two of the three questions associated with the readiness of the system for deployment in an operational environment were found.
Fewer statistically significant differences were elicited by the System Questionnaire than by the Task Questionnaire. In general, the values of the F-statistics were lower than those for the Task Questionnaire, which indicates weaker relationships. The results of the Scheffe's tests were also less discriminating. For most statistically significant relationships, the Scheffe's tests identified two groups. However, in only three cases did the score associated with the top-ranking system significantly differ from the scores associated with the second, third, and fourth ranking systems. In nine cases, the top-ranking system differed from the third and fourth ranked systems and in four cases it only differed from the fourth ranked system. In other words, this instrument seemed to group systems at the high end of the scale, while the Task Questionnaire seemed to distinguish one system from the rest.
Responses to the System Questionnaire also differed from the Task Questionnaire with respect to the range of scores analysts assigned to systems. Scores analysts assigned to systems were more similar to one another in the System Questionnaire than in the Task Questionnaire. Moreover, the position of the baseline system was more variable. While it still ranked fourth most often, its rank varied slightly more on questions in the System Questionnaire, than it did in the Task Questionnaire. However, as with the Task Questionnaire, most questions for which the baseline system did not rank fourth were related to analysts' comfort using the system and may be explained by their familiarity with the baseline system.
4.4 Combining evidence from questionnaires
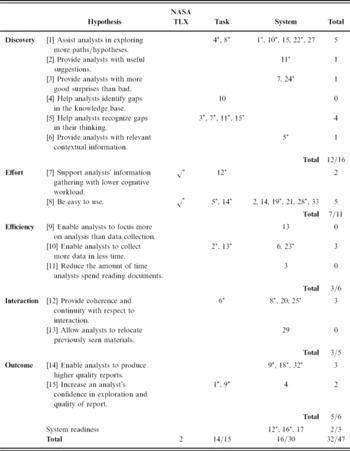
By combining results of the NASA TLX, the Task Questionnaire and the System Questionnaire, we see how much evidence each instrument provides in support of particular hypotheses. Table 8 presents the original hypotheses, along with specific instruments and questions that assessed each hypothesis. Items with an * indicate those for which a statistically significant difference was found between at least one pair of systems. The row total indicates the number of statistically significant differences for each hypotheses and the column total indicates the number of statistically significant differences revealed by each instrument.
Summary of the degree to which the questionnaires were able to measure differences postulated in the hypotheses

Entries in each cell correspond to question numbers on the different questionnaires. Items with an * indicate that statistically significant relationships were found among systems by these items. Check marks appear in the NASA TLX column since this entire instrument measured effort.
Overall, the three questionnaires elicited the most evidence for hypotheses related to the discovery and outcome dimensions: 75% of the discovery questions and 83% of the outcome questions demonstrated significant differences among systems. Although fewer than half of the Task and System questions for effort resulted in significant differences among systems, the additional evidence provided by the NASA TLX illustrates the effectiveness of combining these three questionnaires to examine this dimension. The least evidence was provided for the questions related to efficiency.
5 Discussion
The NASA TLX was sensitive in evaluating analysts' overall workloads for each scenario. It was inexpensive to administer and analyze and has established validity and reliability as an instrument in a different context, where there are real-time pressures to control mechanical systems (Hart and Staveland, Reference Hart, Staveland, Hancock and Meshkati1988). However, the way in which the NASA TLX weighting was done in this study may prevent comparisons of individual factor scores for each system. One interesting result was that certain system scores for individual factors appeared inflated. For instance, System C required significantly less effort than the baseline according to the final composite TLX score, but actually had a significantly higher weighted score for the mental factor than the baseline and System A (Table 7). This does not necessarily mean that System C required more mental effort than the baseline system or System A, but that during the pairwise comparisons of factors for System C, the mental factor was selected more times than the other factors. This approach to weighting masks the fact that System C could have required less effort across all six factors than the other systems because weights were derived for each system, rather than for the task. The weights are relative to an individual system, not the task for which the system is being used. The weighting process in previous applications of the TLX involved eliciting weights for each different task; indeed the NASA TLX is a measure of the task load. However, in this study weights were elicited for each system, which makes cross-system comparison of the weighted factor scores tenuous. Although there was only a single task type in this study and eliciting weights once might have provided a more stable weighting function across systems, the various topics of the tasks created a situation where the cognitive demand may have differed slightly for each task instantiation, which is why the TLX weightings were taken at the system level.
Overall 93% of the questions on the Task Questionnaire distinguished among systems, but only about 50% of the questions on the System Questionnaire did. It appears that the Task Questionnaire is more sensitive than the System Questionnaire and there are several possible explanations for these results. The Task Questionnaire was completed after analysts finished a scenario, while the System Questionnaire was completed after two scenarios (interrupted by a lunch break, and several other activities). The time lapse may have caused the strength of analysts' feelings or memories to decay. Analysts may have regarded some questions on the System Questionnaire as redundant to those on the Task Questionnaire and therefore felt that they had already told us this information. It may also be the case that a courtesy effect occurred when analysts completed the System Questionnaire: analysts may have felt uncomfortable evaluating the systems critically because they did not want to offend the researchers. The Task Questionnaire focused on the system and the task, rather than just the system, and analysts may have been more critical (and more truthful) in their responses to this questionnaire.
After combining evidence from all three questionnaires, it was shown that the questionnaires elicited the most evidence for the discovery and outcome dimensions of the hypotheses and the least evidence for the efficiency dimension. Since the systems were novel to analysts, it may be that benefits related to efficiency cannot be realized without more use. It may also be the case that our questions were not appropriate or sensitive enough. These questions attempted to elicit analysts' evaluations of different components of the search process, but it may not be appropriate to subdivide analysts' activities in this way. It is possible that this subdivision made it more difficult to identify what it means to be efficient.
Although the same system did not always score highest on every item, we found that when two or more instruments assessed the same hypothesis, the same system scored highest. For instance, for Hypothesis 1 the same system was rated the highest by Task questions four and eight, and by System questions one, ten, and twenty-two. This result is important since it provides some evidence that the instruments are reliable and that they have some construct validity. That is, the various ways we operationalized the different constructs (e.g., effort) seemed to converge. These measures also appear to be correlated with one another. Since the validity and reliability of the NASA TLX as an instrument for measuring effort has been established, this provides some evidence of the concurrent validity of the new measures of effort in the Task and System Questionnaires.
There are several limitations of this study. Although the validity and reliability of the NASA TLX has been established in numerous studies, this was only the first study where the Task and System Questionnaires were used. While our results provide preliminary evidence regarding the validity and reliability of the Questionnaires with respect to distinguishing among interactive QA systems, these aspects will be strengthened as the Questionnaires are used in more interactive QA evaluations. The study also had a relatively low number of participants. This was necessitated by the study design, which allowed us to study the same people's use of a number of systems to complete a number of scenarios. In this study, we chose to have more intense interactions with participants so that we could critically evaluate our instruments with a number of systems and scenarios. Although we found very strong effects for a number of measures, studies with larger numbers of participants and different interactive QA systems are needed to further validate these questionnaires.
6 Conclusions
There have been a number of advances in the evaluation of QA systems, interactive IR systems, and dialogue systems but little work has investigated evaluation methods and metrics for interactive QA systems. Previous work has focused on measuring usability and relevance, as opposed to the utility measures posed in this paper. One challenge to evaluating interactive QA systems using traditional evaluation measures is that relevance is unstable in multi-user evaluations. The problem with usability measures is that they are too general to assess specific aspects of interactive QA systems. The work reported in this paper evaluates alternative techniques for assessing the utility of interactive, analytical QA systems. Three questionnaires were evaluated with four systems, seven analysts, and eight scenarios. The major finding of this study is that the questionnaires were powerful discriminators across a range of hypotheses. While considerable time was spent developing the questionnaires, they were relatively economical to administer and analyze, and most analysts were comfortable completing them.
Results showed that the questionnaires used in this study – the NASA TLX, the Task Questionnaire and the System Questionnaire – were able to discriminate between systems with respect to several hypotheses related to discovery, effort, efficiency, interaction, and outcome. These Questionnaires were developed specifically for interactive QA systems that support a particular kind of task. These results show that it is feasible to use task-based questionnaires to find significant differences among interactive QA systems. However, the questionnaires might not extend well to a comparison of systems used for different types of tasks, for example answering procurement questions or planning recreational travel, as they were not developed for these types of systems and tasks. These questionnaires are most appropriate for evaluations that involve interactive QA systems that support analytical tasks.
A natural question is whether the questionnaires could be reduced and streamlined. Standard techniques used in psychometrics might identify some independent factors underlying the set of responses, and one might experiment with keeping only those questions which load most heavily on these factors. This would reduce the number of questions on the questionnaires, the amount of time spent by participants completing them and the amount of time spent by researchers analyzing them. This might, in particular, be useful for a customer contemplating a major investment in systems of the type studied here.
Each evaluation situation is somewhat different and one hesitates to strive for a one-size-fits-all evaluation strategy for interactive systems. Our questionnaires addressed general characteristics that most interactive QA systems should have, but they did not necessarily allow one to evaluate system-specific features. For this, researchers added their own questions customized to these features. However, there are many opportunities for developing shared frameworks and infrastructures for evaluation. One common approach is to share scenarios and corpora, since they are generally expensive to construct from scratch. The creation of the questionnaires presented here, which are customizable to individual systems, contributes to an infrastructure for interactive QA evaluation. We hope that they will be reused, refined, and further validated. As interactive QA systems advance, these instruments may need to be updated or changed. In fact, changes in interactive QA functionality might lead to changes in the very hypotheses about utility that were used to generate these questionnaires. To facilitate further adoption and use, NIST maintains a password-protected website for materials related to this project. Those who are interested in obtaining the questionnaires in electronic format should email Emile Morse (emile.morse@nist.gov).