Introduction
Rice is the staple food for half of the global population and more than 3 billion Asians (WRS, 2010). More importantly, 50% of the total rice farmland in South Asia is rainfed (Dawe et al., Reference Dawe, Block, Gulati, Huang, Ito and Pandey2010), where rice production is deeply affected by biotic and abiotic stresses. Among these, submergence and salinity are the main constraints of rice production (Khush, Reference Khush1984; Mackill et al., Reference Mackill, Ismail, Singh, Labios and Paris2012). Tolerance to salinity is complex, involving different physiological mechanisms, such as sodium exclusion from roots, sodium transport between root and shoot and sequestering of sodium ions in older tissues and vacuoles (Shannon, Reference Shannon1985; Yeo and Flowers, Reference Yeo and Flowers1986). Molecular responses of rice plants to salinity stress is well characterized (Munns and Tester., Reference Munns and Tester2008) but sufficient information is unavailable on submergence stress (Lee et al., Reference Lee, Mustroph, Sasidharan, Vashisht, Pedersen, Oosumi, Voesenek and Bailey-Serres2011).
Landraces being the intermediate group between cultivated and wild types holds evolutionary significance for their adaptation to different stresses (Pusadee et al., Reference Pusadee, Jamjod, Chiang, Rerkasem and Schaal2009). Native landraces are the product of natural and artificial selection over the years of domestication and are adapted to different agro-ecological conditions (Malik et al., Reference Malik, Dikshit, Das and Lodh1994). Therefore, rice landraces are the reservoir of many novel genes for different traits which is of potential use for identification of superior alleles/genes providing greater tolerance/adaptation to stresses. For instance, genes such as Sub1A for submergence tolerance from FR13A (Xu et al., Reference Xu, Xia, Fukao, Canlas, Maghirang-Rodriguez, Heuer, Ismail, Bailey-Serres, Ronald and Mackill2006), SKC1 for salinity tolerance from Nona Bokra (Lin et al., Reference Lin, Zhu, Yano, Gao, Liang, Su, Hu, Ren and Chao2004), Sh4 for grain shattering (Li and Sang, Reference Li and Sang2006), Rc7 for grain pericarp colour (Sweeney et al., Reference Sweeney, Thomson, Cho, Park, Williamson, Bustamante and McCouch2007), Wx for granule-bound starch synthase (Wang et al., Reference Wang, Zheng, Shen, Gao, Snustad, Li, Zhang and Hong1995) and GS3 grain size/shape (Fan et al., Reference Fan, Xing, Mao, Lu, Han, Xu, Li and Zhang2006) have been identified in landraces. Flood Resistance 13A (FR13A) was identified decades ago from ‘Dhalaputia’, a rice landrace collected from coastal Odisha and submergence tolerant varieties developed with FR13A background were not widely adopted because of their poor agronomic and grain quality traits (Septiningsih et al., Reference Septiningsih, Pamplona, Sanchez, Neeraja, Vergara, Heuer, Ismail and Mackill2009).
Submergence-1 (Sub1) is the major quantitative trait locus which enables plants to endure complete submergence for prolonged periods due to activation of a quiescence strategy. It involves a single amino acid substitution distinguishing the Sub1A1 allele of tolerant indica varieties. Sub1A1 in tolerant genotypes suppresses the production of ethylene, inhibiting GA-mediated shoot elongation and conserving energy (Singh et al., Reference Singh, Dang, Vergara, Pandey, Sanchez, Neeraja, Septiningsih, Mendioro, Tecson-Mendoza, Ismail, Mackill and Heuer2010). For salinity tolerance in rice plants, Saltol, a major quantitative trait loci (QTL) i.e. associated with the Na+/K+ ratio and seedling-stage salinity tolerance was mapped on chromosome 1 by using an F8 recombinant inbred line population of IR29/Pokkali (Gregorio, Reference Gregorio1997). Of nearly 70 salt tolerant QTLs identified to date, only Saltol has been exploited widely (Ren et al., Reference Ren, Gao, Li, Cai, Huang, Chao, Zhu, Wang, Luan and Lin2005).
Since, Bangladesh and India are associated with both primary and/or secondary centres for origin of indica rice (Ramaiah and Ghose, Reference Ramaiah and Ghose1951; Khush, Reference Khush1997), we have characterized rice landraces cultivated in the coastal states of India both at phenotypic and molecular level using SSR markers associated Sub1 and Saltol QTL to understand their genetic variation for salinity and submergence tolerance.
Materials and methods
Plant material
Several rice landraces are available in different gene banks of India, but most of them are yet to be characterized for different traits. We have selected 98 rice landraces from the National Bureau of Plant Genetic Resources (NBPGR), New Delhi and gene bank of National Rice Research Institute, Cuttack based on prior passport information for our screening (online Supplementary Table S1). The germplasm represented Kerala, West Bengal, Andhra Pradesh and Odisha. Since, Pokkali landraces cultivated in Kerala (India) are evolved to have genetic variability and varied response for salinity stress (Islam et al., Reference Islam, Singh, Salam, Hassan and Gregorio2008), different Pokkali accessions collected from farmers’ fields of the Pokkali tract in Alappuzha, Ernakulam and Thrissur districts were also included in the study along with other genotypes.
Phenotypic screening
Selected rice landraces along with positive FR13A (submergence)/FL478 (salinity) and negative IR42 (submergence)/IR29 (salinity) controls were evaluated for submergence and salt tolerance following protocol standardized by International Rice Research Institute, Philippines.
For submergence screening, 21 days old seedlings (20 seedlings per individual) were transplanted to submergence screening in specially designed tanks in two replications. After 10 days of plant growth under normal conditions (from the day of transplanting) data on plant population and shoot height were recorded. Then, the plants were subjected to complete submergence by filling the tank with water. The water level was maintained at 90 cm from the level of soil by periodically filling water. Plants were de-submerged by removal of water after 14 days under submerged conditions i.e. complete death of IR42 (negative control) and were allowed to recover for 10 days. After recovery of the genotypes (online Supplementary Fig. S1), visual stress symptoms such as leaf yellowing and rotting were observed and were scored based on the modified standard evaluation system (SES) (Suprihatno and Coffman, Reference Suprihatno and Coffman1981). Data on survival percentage and shoot length after stress were recorded. Elongation and survival percentage was recorded for each genotype from both replications based on shoot height difference and survival ratio after and before stress.
Phenotypic screening of seedling stage salinity tolerance of the genotypes was done following the protocol described by Gregorio (Reference Gregorio1997). The experiment was conducted in three replicates under controlled experimental conditions. Ten seeds of each accession along with positive and negative controls were germinated with distilled water on styrofoam floats having pre-made punch holes, fitted with nylon net at the bottom. After germination, seedlings were subjected to an initial salinity stress for 3 d at an electrical conductivity (EC) of 6 dS/m (60 mM NaCl) with nutrient solution of (Yoshida et al., Reference Yoshida, Forno, Cock and Gomez1976). Further, salt concentration was increased to 120 mM NaCl (EC 12 dS/m) after 4 d under initial salinity. The culture solution was periodically replaced with fresh solution in 7 days interval with 120 mM NaCl (EC 12 dS/m) and the pH of nutrient solution was maintained daily at 5.0 ± 0.5, until final scoring. The genotypes were scored based on visual symptoms using standard evaluation system of 1–9 for rice after complete death of negative control (IR29) (online Supplementary Fig. S1) (Gregorio, Reference Gregorio1997). Survival percentage was calculated based on survival ratio after and before salinity stress.
Molecular characterization and data analysis
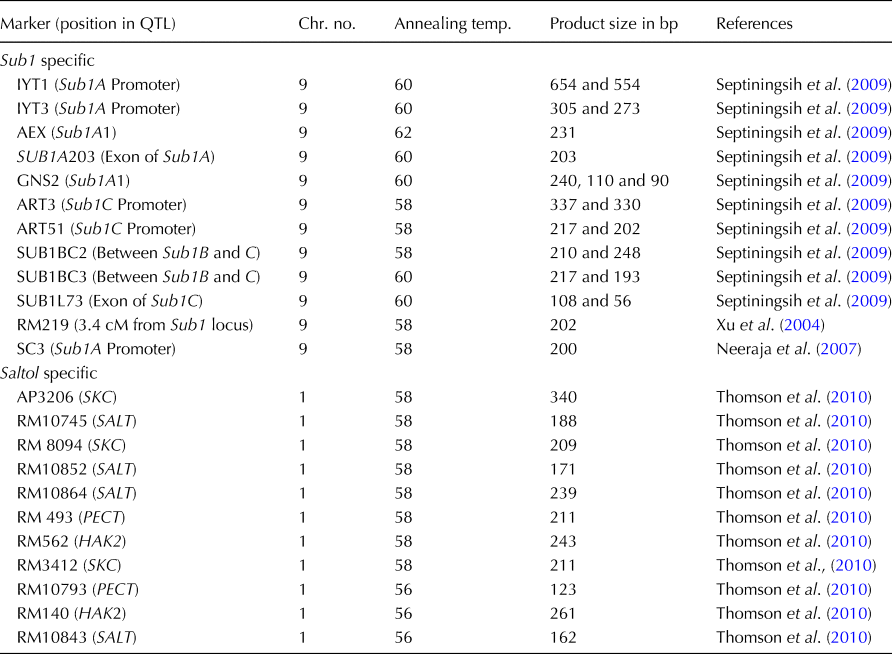
DNA was extracted from young leaves of 10 plants of each variety (Dellaporta et al., Reference Dellaporta, Wood and Hicks1983). For genetic diversity and haplotyping of Sub1 and Saltol QTL region, 12 and 11 QTL-linked markers were used, respectively. Details of primers, their position in respective QTL and product size are given in Table 1. For each primer, polymerase chain reaction (PCR) was performed in 10 µl reaction volume with 1 µl of 10× buffer containing MgCl2 (Promega), 0.5 µl of 10 mMdNTP, 1 µl of each 5 µM of primer pairs, 5.2 µl of nanopure water, 0.3 µl of 5 U/μl Taq DNA polymerase (Geneaid) and 1 µl of DNA template. Amplification was carried out in a thermal cycler (Applied Biosystems) at 94°C for 4 min followed by 35 cycles of 94°C for 30 s, 56–62°C for 45 s and 72°C for 1 min, with a final extension of 72°C for 7 min. The PCR amplification products were visualized in 2.5% of ethidium bromide stained agarose gel using a Typhoon FLA 7000 fluorescent image analyzer (GE Healthcare Bio-Sciences AB, Uppsala, Sweden).
Details of SSR markers representing Sub1 and Saltol QTL region of rice used in the study

The sizes of the amplified fragments were determined using 100 bp DNA ladder (BR Biochem) as the size standard reference. Markers were scored for the presence or absence of the corresponding band among the genotypes and their genetic diversity parameters such as N a (number of alleles), N e (number of effective allele), H e (Nei's genetic diversity), I (Shannon's information index) and Nei's unbiased pairwise genetic distance was evaluated using POPGENE v 1.32 (Yeh and Boyle, Reference Yeh and Boyle1997). The neighbour-joining dendrogram was constructed based on unbiased pairwise genetic distances by MEGA 6 to establish the relationship among genotypes (Tamura et al., Reference Tamura, Dudley, Nei and Kumar2007). The haplotype variation among the genotypes was derived from allelic variation generated by Sub1 and Saltol QTL-linked markers with reference to controls according to the procedure described by McCartney et al. (Reference McCartney, Sommers, Fedak and Cao2004).
Results
Phenotypic screening for submergence and salinity stress
A wide range of responses of submergence stress was detected among the genotypes where of the 100 genotypes, only FR13A showed high level of tolerance, while 32 accessions were tolerant followed by nine accessions with a moderate level of tolerance. Most of the genotypes were highly susceptible (49) to submergence stress and only nine genotypes were under susceptible category. The positive control, FR13A showed the highest rate of survival i.e. 95%, having a shoot elongation ability of 125% and was detected with less injury due to submergence (Fig. 1 and see online Supplementary Table S2). However, the survival percentage varied from 7 to 37% for susceptible genotypes and 67 to 79% for the tolerant group. Similarly, wide variation was detected for shoot elongation ratio of the genotypes when subjected to submergence stress. Genotypes such as Pateni and Lunidhan showed highest elongation ratio of 341 and 320, respectively. Whereas, the lowest shoot elongation ability of 50% was detected in the genotype IC203778 followed by 62% in IC413645.
Variation in the rate of survival of rice genotypes under submergence stress.

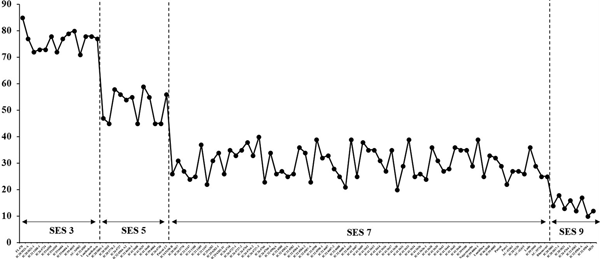
The phenotypic characterization for salinity tolerance trait, estimated on the basis of SES score and visual symptoms of the seedlings after stress showed wide variation ranging from score 1 (highly tolerant) to score 9 (highly susceptible) at 12 dS/m of EC. We could identify 14 genotypes having tolerance and 12 having moderate tolerance (Fig. 2). Majority of the genotypes (66) were susceptible while eight genotypes were highly susceptible. Two genotypes i.e. IC594019 and IC536604-1 showed a maximum survival of 79 and 80% along with the positive control FL478 which showed the highest survival rate (85%). Effect of salinity by visual symptoms was in line with survival rate of the genotypes.
Variation in the rate of survival of rice genotypes under salinity stress.

Microsatellite marker diversity
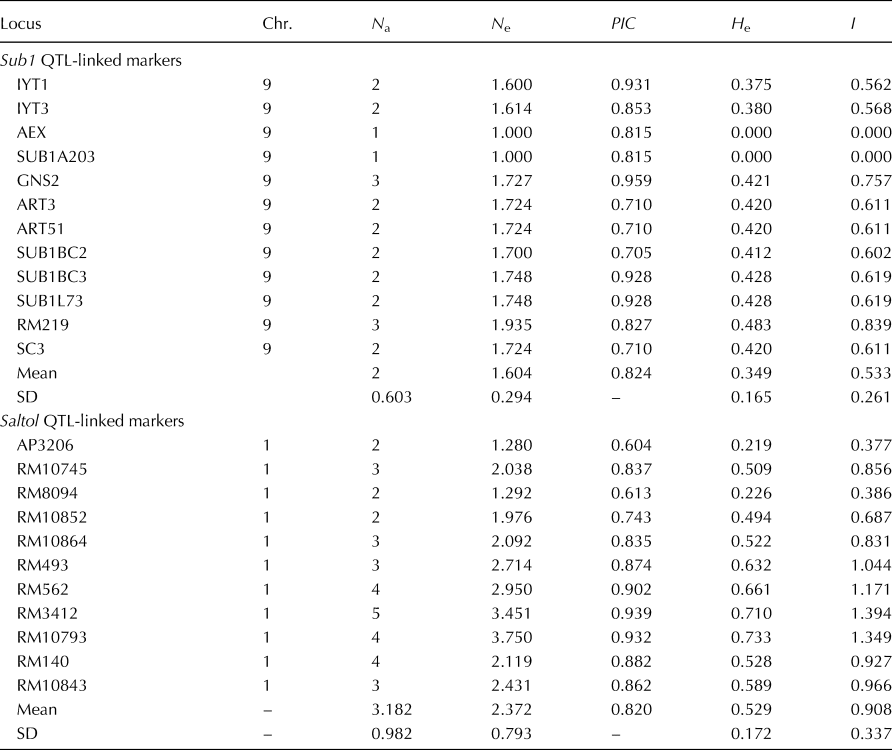
A wide range of allelic variations was detected among the genotypes with 11 tested loci representing Sub1 QTL (online Supplementary Fig. 2). Polymorphism information content (PIC) value of all the loci ranged from 0.705 (SUB1BC2) to 0.959 (GNS2) with an average of 0.824. Two of the markers i.e. GNS2 and RM219 amplified a highest of three alleles each (Table 2). RM219 was detected with highest (1.935) number of effective alleles while AEX and SUB1A203 were the lowest counterparts. The highest genetic diversity value and Shannon's information index of 0.483 and 0.839 were also detected for the marker RM219, respectively. Since the markers AEX and SUB1A203 did not show any allelic variation, their genetic diversity value could not be determined. Of the Sub1 region, genetic diversity was detected to be high in Sub1B and Sub1C as compared with the Sub1A region.
Genetic diversity parameters of the SSR representing Sub1 and Saltol QTL-linked microsatellite markers used in the study

Chr., chromosome; N a, number of alleles; N e, no. of effective alleles; PIC, polymorphism information content; H e, Nei's genetic diversity; I, Shannon Index; SD, standard deviation.
For the markers specific to Saltol QTL, high level of allelic variation was detected (see online Supplementary Fig. S3), where PIC value ranged from 0.604 (AP3206) to 0.939 (RM3412) with an average of 0.820. One locus, RM3412 could amplify highest of five alleles (Table 2). The genetic diversity value of the tested loci ranged from 0.219 to 0.733 for the markers AP3206 and RM10793 with an average of 0.529, respectively. The Shannon's information index was in agreement with the Nei's genetic diversity value for the tested loci with few exceptions. Markers of Saltol region recorded highest diversity for PECT region followed by HAK2, salT and SKC region. The average genetic diversity (H e) was comparatively high at 0.529 for Saltol linked markers than the Sub1 linked markers where the value was 0.349.
Genetic relationship among the genotypes
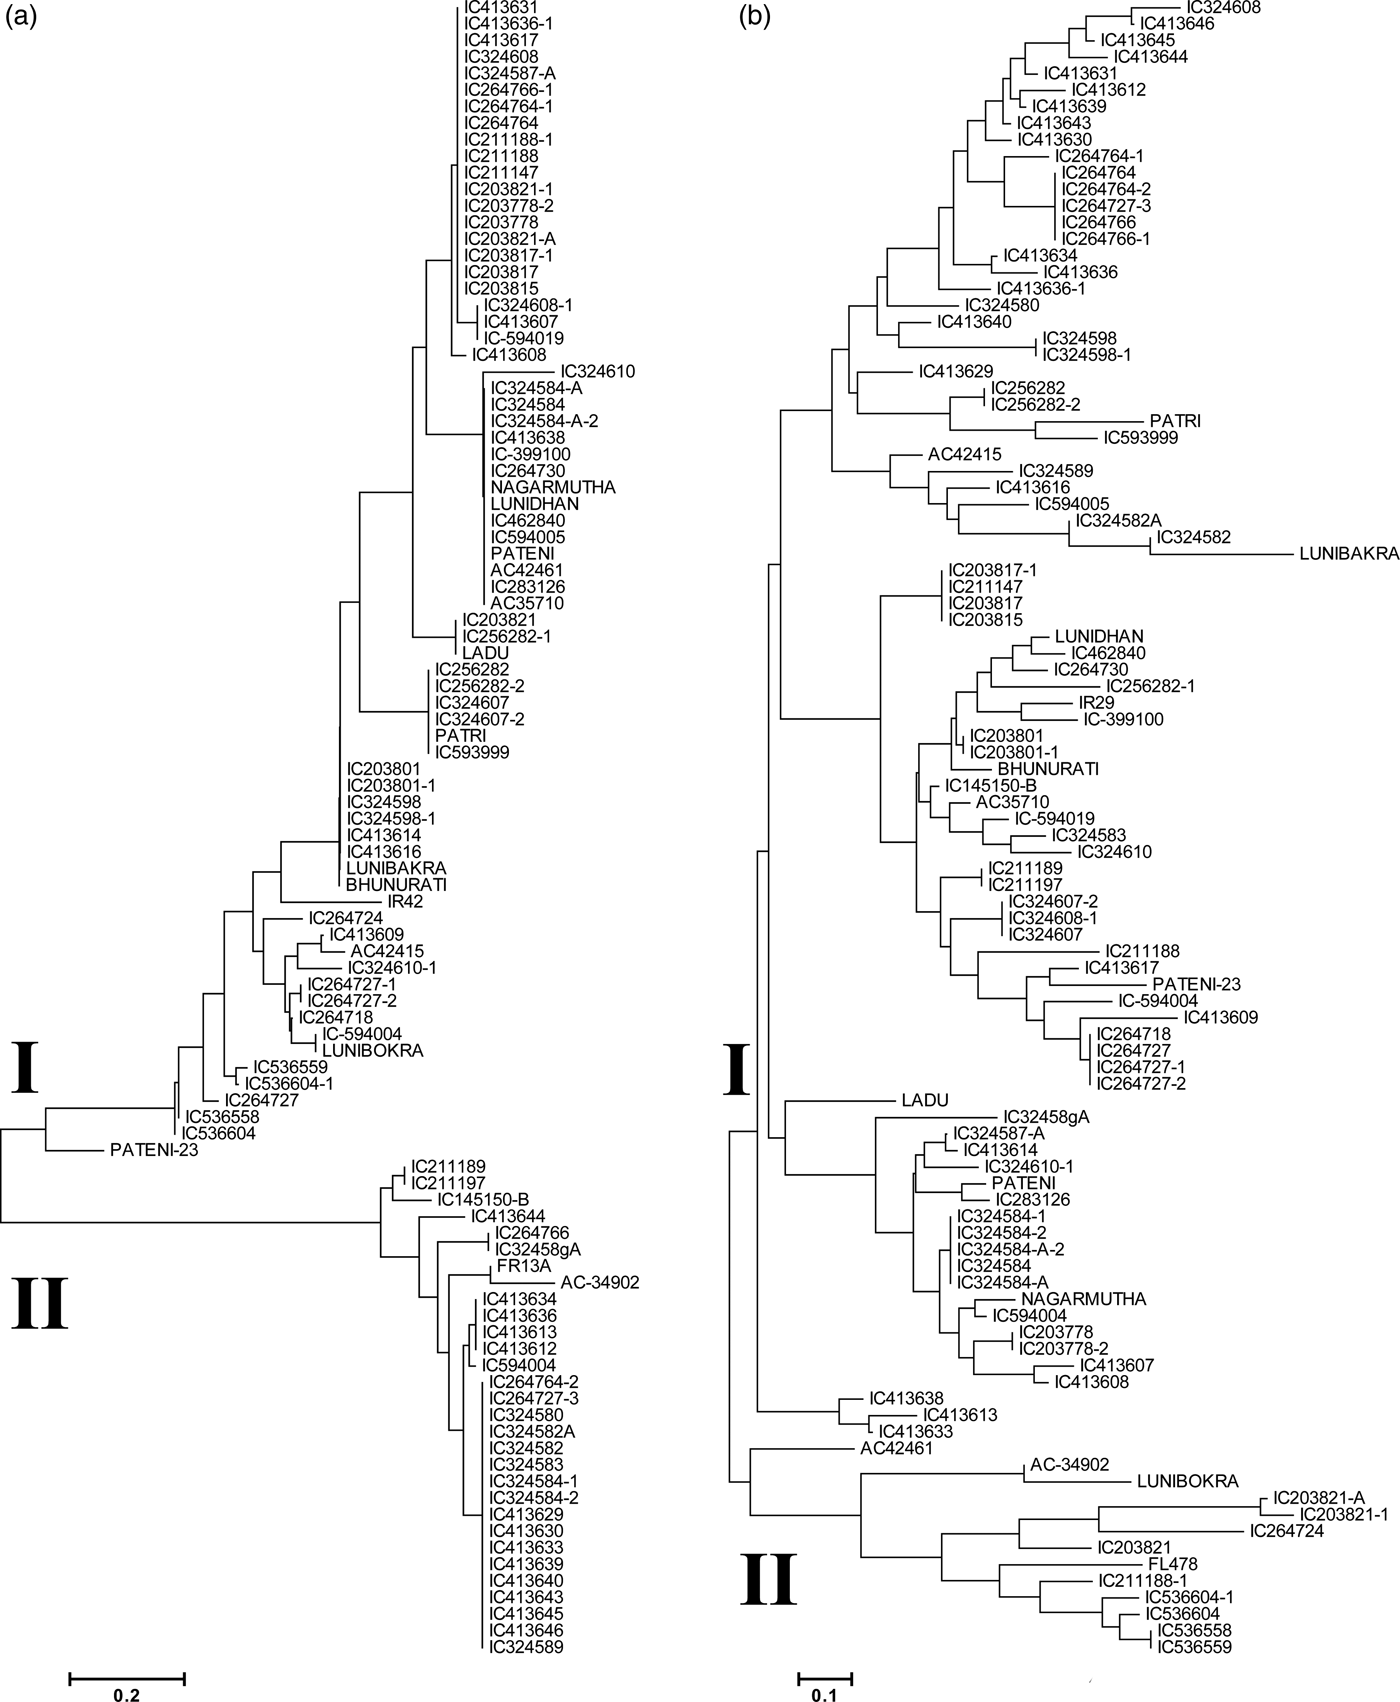
The pairwise genetic distance between genotype pairs was calculated to establish the relationship among individuals. With the Sub1 QTL-linked markers highest variation was detected between IC264766-1 and AC42415 with a genetic distance of 2.393. However, average pairwise genetic distance between the genotypes was 0.801. Similarly, with the markers linked to Saltol QTL the average genetic distance measured was 0.842 where the genotypes IC413607 and FL478 were highly distinct from each other with a genetic distance value of 3.067. The neighbour-joining dendrogram based on Nei's pairwise genetic distance between genotypes with Sub1 QTL-linked markers grouped the genotypes in to two distinct clusters i.e. I and II. A total of 69 genotypes and the negative control (IR42) were grouped in cluster I, while 30 genotypes including the positive control (FR13A) were grouped in cluster II (Fig. 3(a)). Genotypes of cluster II were closely related to each other as compared with the genotypes of cluster I, where distinct sub-clusters were detected. One genotype, AC34902 showed close association with FR13A. Similarly, the Saltol QTL-linked markers separated the genotypes into two major clusters i.e. I and II. In this case also both the controls were clustered separately. Including controls, 66 genotypes were present in cluster I and 34 were grouped in cluster II. Five accessions (IC211188-1, IC536604-1, IC536604, IC536558 and IC536559) were grouped in the same sub-cluster along with FL478 (Fig. 3(b)). From the dendrogram, comparatively high level of variation among the genotypes was detected for Saltol QTL-linked markers than the Sub1 QTL-linked ones.
Neighbour-joining dendrogram showing relationship among the rice genotypes (a) based on Sub1 QTL-linked SSR markers and (b) based on Saltol QTL-linked SSR markers.

Haplotype structure of Sub1 QTL and Saltol QTL in the landraces
Wide haplotype variation present in our germplasm set revealed the presence of high degree of variation within them. Of the 12 markers, three markers (IYT1, AEX and SUB1BC2) were selected to derive the haplotype structure of genotypes for the Sub1 region. A total number of six haplotypes could be detected using FR13A as the reference (Fig. 4(a)). Majority of the genotypes (55) were not detected with any common allele of FR13A for the three markers and were in group 6 along with IR42. For the selected loci, 26 genotypes shared all alleles of FR13A of which 22 genotypes were tolerant and four genotypes IC413612, IC413613, IC413633 and IC413634 were moderately tolerant. In the haplotype groups 2, 3, and 4, genotypes were detected with two of the marker allele similar to FR13A, but in different combinations. Ten genotypes were grouped in haplotype 5 with the only allele for the locus AEX.
Haplotype structure of rice genotypes (a) based on Sub1 QTL-linked SSR markers and (b) based on Saltol QTL-linked SSR markers.

Three markers i.e. RM8094, RM3412 and RM493 were selected for generating haplotype structure for Saltol QTL and eight different groups were detected with these markers among the genotypes. Four genotypes (IC211188-1, IC536558, IC536559 and IC536604) shared the common FL478 (positive control) allele and were grouped in haplotype group 1 along with FL478. Thirty-six genotypes having the marker allele of RM493 similar to the reference were separated in group 7, while groups 6 and 5 contained three genotypes each with a common allele for RM3412 and RM8094, respectively (Fig. 4(b)). Most of the genotypes having tolerance to salinity stress were in haplotype group 1 or 2.
Discussion
Screening for submergence and salinity stress
The existing variation with respect to submergence stress in our set of genotypes revealed their varied response towards the stress. This variation could be of valuable use to understand plants varied response under stress (Ahmadi et al., Reference Ahmadi, Negrao, Katsantonis, Frouin, Ploux, Letourmy, Droc, Babo, Trindade, Bruschi, Greco, Oliveira, Piffanelli and Courtois2011; Negrao et al., Reference Negrao, Almadanim, Pires, Abreu, Maroco, Courtois, Gregorio, McNally and Oliveira2013). Shoot elongation is an important parameter for rice genotypes tolerant to submergence stress (Vergara et al., Reference Vergara, Jackson and De Datta1976). In this study majority of the genotypes having reduced shoot elongation showed a higher survival rate. Two genotypes, Pateni and Lunidhan which the showed highest shoot elongation but with higher shoot elongation could be important to focus on their physiological mechanism (weather survival or escape mechanism) under submergence (Sarkar and Bhattacharjee, Reference Sarkar and Bhattacharjee2011). In rainfed lowlands, which cover both submergence and waterlogging condition, rice landraces have less shoot elongation potential, whereas cultivars having higher elongation ability are preferred in flood prone areas (Chen et al., Reference Chen, Visser, de Kroon, Pierik, Voesenek and Huber2011; Luo et al., Reference Luo, Nagel, Scharr, Zeng, Schurr and Matsubara2011).
For salinity stress also the genotypes express different range of tolerance, from tolerance to highly susceptible. The genetic diversity and allelic variation demonstrated in this study could provide a basic idea that some of the landraces are being genetically adapted/is adapting to different abiotic stress in the course of evolution (Zeng et al., Reference Zeng, Kwon, Liu, Wilson, Grieve and Gregorio2004; Sankar et al., Reference Sankar, Mohamed Selah and Selvaraj2011). Further, the physical injuries in plants due to salinity detected by visual symptoms were directly related to their rate of survival which is in line with earlier reports (Yeo and Flowers, Reference Yeo and Flowers1986; Khatun et al., Reference Khatun, Rizzo and Flowers1995; Lutts et al., Reference Lutts, Kinet and Bouharmont1995; Huda et al., Reference Huda, Ferdausi, Hassan and Hossain2017).
In this study, significant variation was observed for both the traits which is in agreement with the earlier report (Singh et al., Reference Singh, Mackill and Ismail2009; Afrin et al., Reference Afrin, Nafis, Hossain, Islam and Hossain2018). In total, 32 and 14 tolerant genotypes were identified for submergence and salinity stress which could be utilized for breeding purpose after successful evaluation for agronomic traits. The cumulative result, for instance, showed that four accessions collected from Kerala i.e. IC264724, IC413608, IC413629 and IC41340 were tolerant or moderately tolerant to submergence vis-à-vis salinity stress of which three were Pokkali collections. Several salt tolerant Pokkali lines have already been reported earlier (Islam et al., Reference Islam, Singh, Salam, Hassan and Gregorio2008). Identification of Pokkali lines having tolerance to submergence and salinity from our study holds enormous importance for further exploitation and large scale evaluation of these lines to understand their physiological mechanism under both the stresses. Moreover, four genotypes collected from Kerala (IC536558, IC536559, IC536604 and IC536004-1) and two genotypes from West Bengal (AC34902 and IC324589) were tolerant and showed high-survival rate under both stress. Genetic enhancement and yield improvement of these lines could play important role in development of new rice variety for rainfed and shallow lowland areas of coastal India.
Genetic diversity at the molecular level
Since the advent of PCR, molecular markers have proved to be the best approaches to access genetic diversity and characterization of crop plants (Ren et al., Reference Ren, Lu, Li, Huang and Zhu2003; Garris et al., Reference Garris, Tai, Coburn, Kresovich and McCouch2005; Shishido et al., Reference Shishido, Kikuchi, Nomura and Ikehashi2006). However, trait-specific genetic diversity assessment employing molecular markers is of potential use to unlock the allelic diversity in different genotypes and to understand their association with varied response for a particular trait (Roy et al., Reference Roy, Dash, Subudhi, Rao and Rao2014). Mining of allelic variation within genes/QTLs such as Sub1 and Saltol could be significantly useful for characterizing large set of germplasm for identification of superior alleles and their precise introgression in suitable backgrounds for the development of high yielding rice varieties having tolerance to submergence and salinity (Akbar et al., Reference Akbar, Yabuno and Nakao1972; Flowers and Yeo, Reference Flowers and Yeo1981).
Allelic variation of Sub1A leading to varied response of plants tolerance to submergence has been studied earlier (Li et al., Reference Li, Septiningsih, Quilloy-Mercado, McNally and Mackill2011), while potential of Sub1B and C and their allelic variation responsible for submergence tolerance in rice cannot be ignored (Bailey-Serres et al., Reference Bailey-Serres, Fukao, Ronald, Ismail, Heuer and Mackill2010). Though the significance of Sub1B and C for submergence tolerance of rice is not well established yet, but genetic diversity in landraces for these two regions is detected in this study. Similarly, Saltol, the major QTL for seedling stage salinity tolerance is important to isolate the novel allelic variants to understand their association for salinity tolerance in different rice genotypes. In our study, high PIC value of 0.824 and 0.820 were recorded with the markers related to Sub1 QTL and Saltol QTL, respectively which is higher than the earlier reports (Panaud et al., Reference Panaud, Chen and McCouch1996; Akagi et al., Reference Akagi, Yokozeki and Inagaki1997; Garland et al., Reference Garland, Lewin, Abedinia, Henry and Blakeney1999) where genetic diversity was assessed throughout 12 chromosomes of rice. This showed the discriminating power of these QTL-linked markers and the allelic richness of these landraces present in Sub1 and Saltol region. The genetic diversity value for both the QTL-related markers were also high. These results also support the genetic evolution and adaptation of rice landraces to various agro-climatic conditions (Hanamaratti et al., Reference Hanamaratti, Prashanthi, Salimath, Hanchinal, Mohankumar, Parameshwarappa and Raikar2008; Lisa et al., Reference Lisa, Elias, Rahman, Shahid, Iwasaki, Hasan, Kosuge, Fukami and Seraj2011; Zhao et al., Reference Zhao, Chung, Lee, Ma, Kim, Kim, Chung, Lee, Kim, Kim and Park2011). Further, the genotype AC34902 seems to be closely related to FR13A and genotypes such as IC211188-1, IC536604-1, IC536604, IC536558 and IC536559, which were in the same cluster with FL478, identified from the dendrogram, could be further exploited to understand their in-depth genetic relationship with both the tolerant controls.
Haplotyping/microsatellite profiling is a feasible approach for easy and visual discrimination of a large set of germplasm based on best suitable markers and their allelic combinations (Ravi et al., Reference Ravi, Geethanjali, Sameeyafarheen and Maheswaran2003; Singh et al., Reference Singh, Sharma, Singh, Singh, Singh, Tiwari and Mohapatra2004; Sundaram et al., Reference Sundaram, Naveenkumar, Biradar, Balachandran, Mishra, Ahmed, Viraktamath, Ramesha and Sarma2008; Girija et al., Reference Girija Rani, Adilakshmi, Suryanarayana, Satyanarayana and Reddy2010). Similar to our study, Fukao and Bailey-Serres (Reference Fukao and Bailey-Serres2008) also used IYT1, AEX and SUB1BC2 markers of Sub1 region to generate the haplotype structure and could generate different haplotype groups. For instance, five genotypes i.e. IC203801, IC203778, IC324584, IC413608 and IC413638 which were tolerant to submergence without having any common allele of FR13A could be due to Sub1A1 independent mechanisms for submergence tolerance of rice (Niroula et al., Reference Niroula, Pucciariello, Ho, Novi, Fukao and Perata2012). Thus, these genotypes could be ideal source for identification of genes and/or QTLs other than Sub1A1 for submergence tolerance. Further, the genotypes having all the similar allele of FR13A for the selected markers but showing both tolerance and moderate tolerance to submergence, demonstrates the possible involvement of physiological and environmental factors for plants’ abiotic stress tolerance mechanism (Xiong et al., Reference Xiong, Yang and Li2012).
Though the markers i.e. RM8094 and RM3412 are mainly used for marker-assisted backcrossing for salinity tolerance in rice, an additional marker i.e. RM493 was added to differentiate the genotypes in haplotype groups at Saltol QTL region and eight groups were detected. Islam et al. (Reference Islam, Gregorio, Salam, Collard, Singh and Hassan2012) also used the same set of markers to generate haplotypes for Saltol QTL. Genotypes of groups 2, 3 and 4 were detected with two of the common alleles in different combinations indicating partial conservation of Saltol QTL leading to varied degree of tolerance to salt stress (Sahi et al., Reference Sahi, Singh, Kumar, Blumwald and Grover2006). Similar type of haplotype structure was detected in 115 diverse rice accessions (Islam et al., Reference Islam, Gregorio, Salam, Collard, Singh and Hassan2012). In fact, the presence of marker alleles in different combinations would have happened possibly due to difference in domestication pattern at different points of time (Londo et al., Reference Londo, Chiang, Hung, Chiang and Schaal2006; Kovach et al., Reference Kovach, Sweeney and McCouch2007). Most of the genotypes having tolerance to salinity stress were in haplotype group 1 or 2 suggest that the markers RM8094 and RM3412 could be efficient for the selection of Saltol introgressed lines in marker-assisted breeding. Further, eight of the genotypes from haplotype group 8 which did not contain any of the marker alleles of FL478 still were showing moderate tolerance to salinity. These could be the key materials for identification of new sources of genes/alleles other than Saltol for salt tolerance of rice (Singh et al., Reference Singh, Dang, Vergara, Pandey, Sanchez, Neeraja, Septiningsih, Mendioro, Tecson-Mendoza, Ismail, Mackill and Heuer2010).
Since rice landraces are more diverse group than their improved counterparts, these are the most suitable materials for mining of uncharacterized genes/alleles (Wang et al., Reference Wang, Zhang, Gao, Li and Li2007; Ray et al., Reference Ray, Deb, Ray and Chattopadhayay2013). In our study, it was validated that these sources once characterized could serve as valuable material for their utilization in crop improvement. However, genotypes identified with allelic variation at Sub1 and Saltol region holds enormous potential for their more precise study to relate genetic makeup and physiological behaviour with their submergence and/or salinity tolerance. Trait-specific characterization of these resources will lead to their conservation and successful utilization. Local landraces are widely preferred by farmers, therefore yield enhancement of the identified lines having tolerance to multiple abiotic stresses will help in increased rice production and higher economic gain for poor farmers of coastal India.
Acknowledgements
The authors are highly grateful to the Director, National Rice Research Institute, Cuttack for providing all the necessary facilities.
Supplementary material
The supplementary material for this article can be found at https://doi.org/10.1017/S1479262118000436