Introduction
Due to the gradual reduction of fossil fuel and also increase the demand for energy on the basis of the current economic model, humans are faced with the problem of global energy. Use of renewable and clean energy sources are important due to environmental pollution problem that human is faced with them. In the renewable energy sources, solar energy is considered the most promising renewable resource. Everyday, the sun shines on the earth, thus providing about 3 × 1024 J green energy/year.[ Reference Bella, Gerbaldi, Barolo and Grätzel 1 ]
Today's solar cells are made mainly of semiconductor materials. Therefore, research on the characteristics of the semiconductors used in solar cells plays a prominent role. Tin (II) sulfide (SnS) is an amazing, favorite material that has recently received great attention as a potential for the material of photovoltaic cells as a result of its near-optimal energy band gap and high optical absorption coefficient.[ Reference Li, Ji, Zheng, Ma, Jin and Ji 2 – Reference Li, Zhang, Wang, Xue, Liang, Jiang, Liu and Zhu 5 ] SnS is stable in the presence of water and oxygen in the atmosphere, where it is found as a mineral herzenbergite. Thus, SnS has better prospects for long-term stability in comparison with organic solar cells and lead iodide perovskites, which are destroyed by oxygen and water. Furthermore, SnS contains only non-toxic elements, whereas other cells require toxic elements such as cadmium, tellurium, selenium, and/or lead. Although theory predicts that the maximum energy conversion efficiency of single-junction SnS-based solar cells is 32%, the existing SnS solar cells have only reached 2% efficiency, which is a value far too low to compete with silicon solar cells with over 20% efficiency.[ Reference Sinsermsuksakul, Sun, Lee, Park, Kim, Yang and Gordon 6 ] Consequently, a much wider choice of the buffer layer and dopant can be utilized so as to achieve a higher efficiency. Moreover, solar cell based on nanostructured SnS is rather a new research field in photovoltaic applications.[ Reference Li, Xue, Wang, Jiang, Liu and Zhu 7 – Reference Steinmann, Jaramillo, Hartman, Chakraborty, Brandt, Poindexter, Lee, Sun, Polizzotti, Park, Gordon and Buonassisi 11 ]
Using dopants to improve the optical efficiency of semiconductors is a conventional method. By creating a new level in the electronic band structure of SnS, dopants enhance the optical efficiency. Although different dopants were used for altering the physical properties of SnS nanostructures,[ Reference Yue, Lin, Wen, Wang and Peng 12 – Reference Niknia, Jamali-Sheini and Yousefi 16 ] but our aim was the synthesis different concentration of indium as a dopant in SnS nanoscale. For evaluating the effects of this dopant on the optical and photovoltaic properties, recently different research papers were published. For example, Chaki et al. synthesized un- and In-doped SnS crystals by a direct vapor transport technique.[ Reference Chaki, Chaudhary and Deshpande 17 ] They observed that indium decreased optical band gap energy of SnS crystals. Another attempt was made by Santhosh et al. to synthesize In-doped SnS thin films that were deposited on a glass substrate.[ Reference Santhosh, Manoharan, Dhanapandian, Gowri Manohari and Mahalingam 18 ] In-doped thin films show lower optical band gap energy. Un- and In-doped SnS thin films have been successfully prepared on Pyrex substrates, using a low-cost chemical bath deposition technique with different indium concentrations by Reghima et al. and the photovoltaic performances are investigated.[ Reference Reghima, Akkari, Guasch and Kamoun-Turki 19 ] The results suggest that indium can improve the photovoltaic quality parameter of SnS-based solar cells.
To the best of our knowledge, the synthesis and study of In-SnS NPs properties by ultrasonication methods have not been reported yet. Therefore, in the current study, we investigate and present the optical and photovoltaic properties of single layer made by In-doped SnS NPs. The enhanced photovoltaic performance was observed.
Experimental details
Synthesis
The mixed solution for the synthesis of tin sulfide NPs was prepared by adding 40 mL of 0.1 m CH3COONH4 to 40 mL of 0.1 m SnCl2. Then 20 mL of 0.3 m Na2S2O3 was added to the solution. Finally, the solution pH was adjusted to five with the addition of drops of ammonia. The mixed solution was stirred for 1 min. All these processes were carried out at room temperature without any specific conditions. In order to make the electrolyte for doping, an aqueous solution of InCl2 at a concentration of ~1 × 10⁻³ m was prepared in a separate beaker. By adding different quantities of this solution (1, 3, and 5 cm3) to different beakers, separate experiments were carried out. The samples were called In(0), In(1), In(2), and In(3) for the undoped and doped samples with different amounts of the solution, respectively. Ultrasonic waves were introduced at frequencies of 20 kHz using titanium probe (diameter ~12 mm) (Top Sonics UPH-400, 20 kHz–400 W, Ultrasonic Technology Development Co., Iran). For the synthesis, the probe was kept 1 cm inside the solution, and the sonicator was turned on for 6 s and off for 3 s, with this procedure repeated 100 times for all samples. After the deposition, each solution was removed from the beaker, using the filtering paper gently, and several times washed by distilled water, and dried in air.
Characterization
The NPs were crystalline characterized using an x-ray diffractometer (XRD, PAN Analytica) with a monochromatized Cu Kα radiation source (1.5406 Å). A field-emission scanning electron microscope (FESEM, TeScan, Mira 3-XMU) was used for morphological studies. The elemental composition was obtained with an energy-dispersive x-ray spectrometer (EDS) attached to the same FESEM. The optical properties were investigated by means of the UV–vis analysis at room temperature. The UV–vis spectra were recorded by a UV–vis spectrometer (Hatch DR 5000 UV–Vis Spectrometer) over a wavelength range of 300–1000 nm.
Electrical and solar cell experiment
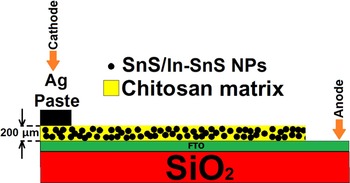
The tin sulfide NPs were deposited in the form of film on a fluorine doped tin oxide (FTO) glass substrate using the chitosan binder. For this purpose, 1 × 2 cm2 FTO substrates were ultrasonically cleaned by acetone, ethanol, and distilled water for 10 min in each solution at ultrasonic bath and finally dried in air. The 0.6 mL chitosan binder with 10 mg NPs mixed and on the FTO substrate at a 0.5 × 0.5 cm2 window that created by parafilm and dried in air for 24 h. Ag paste was used as a cathode electrode according to Fig. 1 for solar characterization. The effective surface of the samples exposed to the light is 0.25 cm2. The Mott–Schottky characteristics was obtained according to our previous report.[ Reference Jamali-Sheini, Cheraghizade and Yousefi 20 ] The solar cell measurement and external quantum efficiency (EQE) were carried out under 100 mW/cm2 (1.5 Air Mass) illumination from a solar simulator (Solar cell simulator IIIS-200+, Nanosat Co., Iran). A 100 W xenon lamp served as a light source, and the intensity of the light was calibrated using a standard silicon solar cell. Photocurrent measurements were carried out by a potentiostat (Autolab, A3ut71167, Netherlands) for plot of J–V and EQE.
Schematic representation of fabricated solar cells.

Results and discussions
Crystalline and morphological properties
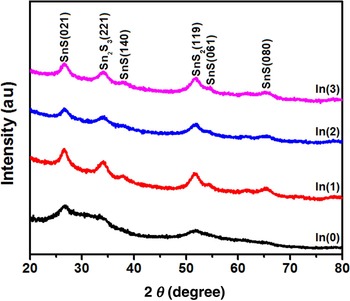
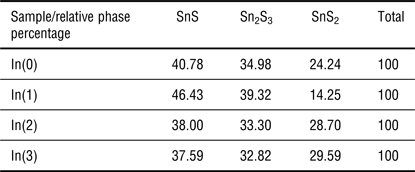
XRD patterns of the tin sulfide NPs are shown in Fig. 2. All the samples were crystalline and of the orthorhombic phase of SnS and Sn2S3 (JCPDS card Nos 14-0620 and 14-0619) as well as the hexagonal phase of SnS2 (JCPDS card No. 83-170).[ 21 ] The existence of broad peaks in all XRD diffractogram of samples indicated the formation of nano-sized particles. The volume percent of different phases present in the samples was determined from the integrated intensities of the diffraction peaks and using the following expressions reported in the literature.[ Reference Wang, Zhao, Xu, Fu and Wang 22 , Reference Basahel, Ali, Narasimharao, Bagabas and Mokhtar 23 ] The result was obtained for all samples and summarized in Table I. Therefore, it can be observed that the main phase is SnS in the crystal structure.
XRD patterns of samples.

The relative percent of different phases at tin sulfide NPs.

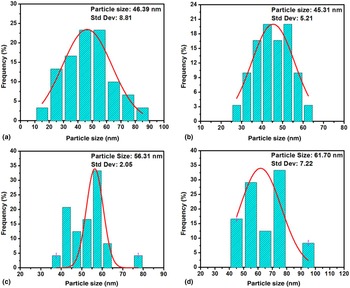
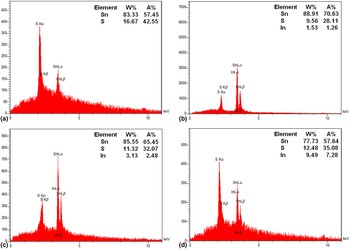
The FESEM images of the tin sulfide NPs are demonstrated in Fig. 3. The NPs show a flower-like morphology. To estimate NPs’ size, a particle size histogram has been calculated and plotted. Figure 4 reveals the particle size histogram of tin sulfide NPs. These graphs represent a particle size <100 nm for all samples. First, by adding In(1), the particle size decreases, and then by increasing indium percentage to In(2) and In(3), the particle size increases, too. An elemental purity of the tin sulfide NPs was tested by the EDS technique, and the typical spectrum of all samples is presented in Fig. 5. It is evident that In percentage rises according to our expectation.
FESEM images of (a) In(0), (b) In(1), (c) In(2), and (d) In(3) samples.

Particle size histogram of (a) In(0), (b) In(1), (c) In(2), and (d) In(3) samples.

EDS spectra of (a) In(0), (b) In(1), (c) In(2), and (d) In(3) samples.

Sonochemical mechanism growth of tin sulfide NPs begin by providing Sn2+ and S2− cations and anions that dissociation in SnCl2 and Na2S2O3, respectively. CH3COONH4 can be hydrolyzed in aqueous solution to produce NH3 and generates hydroxide anions. Finally, the formation of SnS nuclei could occur. In the presence of sonication energy, these processes can be accelerated and have a tendency to produce flower-like particles. In the presence of InCl2 as dopant source, In2+ cations also dissociate in solution and incorporated with sulfur anions.
Optical properties
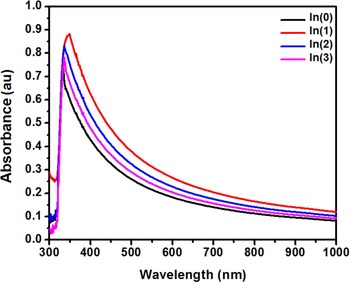
The UV–vis absorbance spectra of the tin sulfide NPs appear in Fig. 6. Tin sulfide NPs have high absorbance in the range of UV, and the absorbance is about 74%, 88%, 84%, and 78% for In(0), In(1), In(2), and In(3) SnS NPs, respectively. The absorbance raise rapidly, using indium dopants. In(1) NPs have relatively stronger absorbance intensity in the UV and visible regions compared with the other samples. This could be due to the fact that these NPs have the smallest size in comparison with the other samples.
UV–vis spectra of the samples.

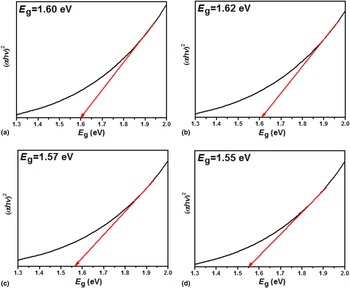
The optical band gaps of the tin sulfide NPs could be evaluated via Kubelka–Munk equation.[ Reference Jamali-Sheini, Yousefi, Ali Bakr, Cheraghizade, Sookhakian and Huang 24 ] Figure 7 shows the curves of (αhν)2 versus hν (Tauc plots) of the tin sulfide NPs. The curves have a good straight-line fit with higher-energy range above the absorbance edge, indicating a direct optical transition near the absorbance edge. In addition, form the Tauc plots and considering the energy band gap values of SnS (1–2 eV) and SnS2 (1.9–2.4 eV), we believe that the dominate phase could be SnS.
Tauc plot of (a) In(0), (b) In(1), (c) In(2), and (d) In(3) samples.

Based on Fig. 7, the direct E g of the tin sulfide NPs have been first a blue shift and then show a red shift, for In(2) and In(3) samples. According to the literature survey in doped semiconductors, optical energy band gaps of In-doped tin sulfide NPs can be achieved by the following relation[ Reference Dezfuly, Yousefi and Jamali-Sheini 25 , Reference Jagadish 26 ]:
 $$E_{\rm g}\;({\rm S}{\rm n}_{1 - x}{\rm I}{\rm n}_x{\rm S}) = (1 - x) \times E_{\rm g}({\rm SnS}) + x \times E_{\rm g}{\rm I}{\rm n}_x{\rm S}{\rm.} $$
Thus, knowing that the optical band gap energy of In-SnS NPs is bigger than that of SnS and considering that the particle size is smaller, a blue shift for In(1) SnS NPs is reasonable. However, the red shift in optical energy band gaps of In(2) and In(3) samples is probably due to the merging of indium level with host bands or the band shrinkage by the presence of dopant ions. This increase with indium dopant has also been observed and reported in other works.[ Reference Chaki, Chaudhary and Deshpande 17 , Reference Reghima, Akkari, Guasch and Kamoun-Turki 19 ]
Electrical and photovoltaic performances
The Mott–Schottky method, is useful way to check the electrical characteristic of the samples such as doping concentration, flat-band potential, etc by measuring the capacitance of the cell containing the semiconductor as a function of applied voltage.[ Reference Jamali-Sheini, Cheraghizade and Yousefi 20 ] In addition, the Mott–Schottky equation has an essential role in estimating the type of conductivity (i.e., n- or p-type). Using the equations from our previous publication,[ Reference Jamali-Sheini, Cheraghizade and Yousefi 20 ] the calculations show all samples exhibit p-type conductivity with different values of majority charge carrier (Table II). It is important to note that In-doped NPs have higher charge carrier concentration, showing that indium as cationic dopants for SnS NPs.
Hole concentration of samples.

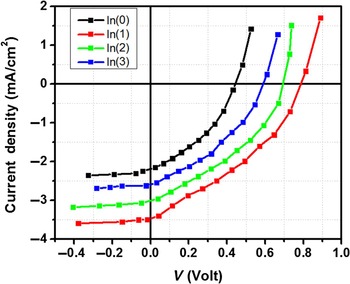
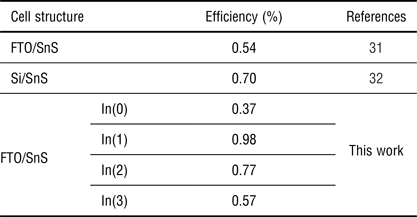
Figure 8 shows the J–V curves of solar cells fabricated from the tin sulfide NPs. The results (Table III) show that the solar cell with In(1) has higher efficiency and power efficiency conversion. In-doped tin sulfide NP-based solar cells have a relatively high open-circuit voltage. In the present case, doping level and size of particles have key parameters for obtaining the high open-circuit voltage. For comparing our result with other works, that use a thin film for fabrication of SnS-based solar cells, we collected a number of other works that have been shown in Table IV. The enhanced results were obtained for In-doped tin sulfide NPs among them. In addition, other solar cell parameters such as the series and shunt resistance (Rss & Rsh) were calculated for solar cell, which was fabricated from the tin sulfide NPs[ Reference Jamali-Sheini, Cheraghizade and Yousefi 20 ] and are shown in Table III. It can be observed that the series resistance increases, whereas the shunt resistance first increases by using a minimum concentration of indium dopants and then decreases by using higher concentration of indium dopant. The series resistance is closely related to the intrinsic resistance, morphology, and size of the semiconductor NPs. Furthermore, the shunt resistance is correlated with the amount and the character of the impurities and defects in the active semiconductor layer because impurities and defects cause charge recombination and leakage current.[ Reference Kim, Kim and Kim 27 ] These improvements in photovoltaic performance of In-doped SnS-based solar cells are due to the increases in the charge carrier and effective reductions in the charge recombination.[ Reference Wang, Qu, Zeng, Liu, Zhang, Tan and Jin 28 ]
J–V curves of the tin sulfide NP-based solar cells.

Photovoltaic parameters of tin sulfide NPs as solar cells.

Reported experimental efficiencies of single-layer SnS-based solar cells.

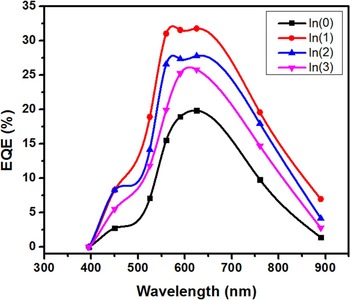
Figure 9 shows the EQE as a function of excitation wavelength for un- and In-doped SnS NP-based solar cells. A maximum and minimum of 32.5% and 20% EQE achieved for In(1) and In(0) samples, respectively. Improving in EQE of In-doped samples is due to reducing recombination by decreasing the number of defects such as tin vacancy.[ Reference Steinmann, Jaramillo, Hartman, Chakraborty, Brandt, Poindexter, Lee, Sun, Polizzotti, Park, Gordon and Buonassisi 11 ] Generally, other parameters that can improve the efficiency and EQE of SnS-based solar cells are including band alignment, absence of secondary phases, short minority carrier lifetime and diffusion length, solar cell configuration, recombination at the junction, doping level, back contact barrier and front contact/buffer, thickness of film, size of particles/structures, band gap, electron affinity, crystal structure, electrical nature, doping, and deposition technique.[ Reference Reddy, Gedi, Park, Miles and Kt 29 , Reference Andrade-Arvizu, Courel-Piedrahita and Vigil-Galán 30 ]
EQE spectra of the SnS NP-based solar cells.

Conclusions
In summary, influences of indium with different concentrations as a dopant on optical and photovoltaic performance of tin sulfide NPs were investigated in this research. Optical studies showed that the size of NPs has an important role on the optical properties of In-doped NPs. Photovoltaic measurements show that the doping level and size of particles have more effective factors in obtaining the highest quality parameter for In-doped SnS NP-based solar cells.
Acknowledgments
F. J.-S. and R. Y. gratefully acknowledge Islamic Azad University, Ahvaz and Masjed-Soleiman Branches, respectively, for their financial supporting in this research work. F. J.-S. also acknowledges Advanced Surface Engineering and Nano Materials Research Center, Islamic Azad University, Ahvaz Branch, Ahvaz, Iran, for their instrumentation support.