INTRODUCTION
Constraining the timing of past loess deposition is essential for understanding the mechanisms controlling loess accumulation and variability in loess accumulation rates. Recent developments in Quaternary geochronology, namely the ability to obtain precise and accurate radiocarbon ages using specific genera of small terrestrial gastropods (Pigati et al., Reference Prospero, Bullard and Hodgkins2010; Pigati et al., Reference Pigati, McGeehin, Muhs, Grimley and Nekola2013; Rech et al., Reference Reimer, Bard, Bayliss, Beck, Blackwell, Ramsey and Buck2011) have improved our ability to precisely and accurately date late glacial loess deposits and consider the relationship between the timing of loess accumulation and the location of regional ice lobes. In Illinois, previous constraints on the timing of Peoria Silt accumulation suggested loess deposition extended well beyond the local last glacial maximum (LGM) into the deglaciation, with reported dates as young as 10,410±650 14C yr BP (12,000±1400 cal yr BP, ISGS-138, Frye et al., Reference Frye, Leonard, Willman, Glass and Follmer1974), 12,990±70 14C yr BP (15,530±140 cal yr BP, Beta 83782, Grimley et al., Reference Grimley, Follmer and McKay1998), and 11,350±100 14C yr BP (13,200±200 cal yr BP, Wang et al., Reference Wang, Hughes, Steele, Lepley and Tian2000) in the Illinois and Mississippi Valley regions. If such ages are accurate, considering extrapolations above these dated zones, loess accumulation would have continued for some time after ice margin recession into the Great Lakes basin (Clark et al., Reference Clark, Dyke, Shakun, Carlson, Clark, Wohlfarth, Mitrovica, Hostetler and McCabe2009; Curry et al., Reference Curry, Hajic, Clark, Befus, Carrell and Brown2014).
Loess in the Central Lowlands is closely tied to glaciation and was thickly deposited adjacent to uplands along major meltwater sluiceways such as the Mississippi, Illinois, Wabash, Ohio, and Missouri Valleys (Follmer, Reference Follmer1996; Bettis et al., Reference Bettis, Muhs, Roberts and Wintle2003). Glacial sediment production during ice lobe advances of the southern Laurentide Ice Sheet was critical in providing tremendous quantities of silt-rich sediment, deposited as outwash in aggrading meltwater river valleys. This outwash periodically dried, was entrained in the atmosphere, and deposited as loess on nearby vegetated uplands. Loess accumulation was not constant: periods of slower loess deposition and paleosol development have been observed within Illinois Valley loess, including the Jules Geosol (Grimley et al., Reference Grimley, Follmer and McKay1998) and other unnamed paleosols (Wang et al., Reference Welp, Lee, Kim, Griffis, Billmark and Baker2003). Such periods have been hypothesized to reflect episodes of warmth, sometimes termed “interstadials,” and glacial retreat (Frye and Willman, Reference Frye and Willman1973; Wang et al., Reference Wang, Hughes, Steele, Lepley and Tian2000). However, given uncertainties in earlier loess age models and limited independent environmental indicators (aside from the paleosols themselves), it remains unclear if such slowdowns in loess accumulation were driven by climate variability—local, regional, or global—or other factors.
Here, we present a new age model of Peoria Silt along the Illinois River Valley. Using improved chronologic constraints, we compare the timing of Illinois River Valley loess accumulation to a detailed time-distance history of the Lake Michigan Lobe (Caron and Curry, Reference Caron and Curry2016; Curry et al., in press) in order to understand the context of loess accumulation with respect to regional ice position. We then discuss the processes and conditions that led to the development of the Jules Geosol, and the paleoenvironmental and paleoclimatic changes recorded within the loess-paleosol sequence. We investigate the influence of climate and environmental variability on past loess accumulation rates using gastropod shells preserved in the Peoria Silt, which permits interpretation of past habitats (e.g., Leonard and Frye, Reference Leonard and Frye1960; Rousseau and Kukla, Reference Schwert, Torpen-Kreft and Hajic1994; Moine et al., Reference Moine, Rousseau, Jolly and Vianey-Liaud2002; Rossignol et al., Reference Rousseau and Kukla2004). We also employ δ18O and δ13C measurements of gastropod shell carbonate to further investigate possible climate or environmental controls (e.g., Yapp, Reference Zaarur, Olack and Affek1979; Goodfriend, Reference Goodfriend1992; Zanchetta et al., Reference Zanchetta, Leone, Fallick and Bonadonna2005; Kehrwald et al., Reference Kehrwald, McCoy, Thibeault, Burns and Oches2010; Yanes et al., Reference Yapp2012) on changing loess accumulation rates. Finally, we use modern analogues of gastropod autecology to quantify the range of mean July temperature during the entire period of Peoria Silt deposition.
LAST GLACIAL LOESS STRATIGRAPHY
The Peoria Silt is a tan to grayish-brown, late Wisconsin Episode loess (typically 10YR hue) that is up to ~15 m thick in Illinois (Willman and Frye, Reference Yanes, Gutierrez-Zugasti and Delgado1970; Hansel and Johnson, Reference Hansel and Johnson1996; Wang et al., Reference Wang, Hughes, Steele, Lepley and Tian2000). The Peoria Silt overlies the slightly pinkish-brown to grayish brown Roxana Silt (7.5YR to 10YR hue), deposited ~55,000 to 33,000 cal yr BP, which, in turn, overlies the last interglacial Sangamon Geosol (Hansel and Johnson, Reference Hansel and Johnson1996; Grimley et al., Reference Grimley, Follmer and McKay1998; Willman and Frye, Reference Yanes, Gutierrez-Zugasti and Delgado1970). In near-bluff areas where loess is thick (typically >7 m) and unleached, the Peoria Silt contains terrestrial gastropod shells (Leonard and Frye, Reference Leonard and Frye1960; Grimley and Oches, Reference Grimley and Oches2015). Many weak A/C horizon paleosols have been recognized within the Peoria Silt of the Central Lowlands (Daniels et al., Reference Daniels, Handy and Simonson1960; Frye et al., Reference Frye, Leonard, Willman, Glass and Follmer1974; Hayward and Lowell, Reference Hayward and Lowell1993; Wang et al., Reference Wang, Hughes, Steele, Lepley and Tian2000). Along the Illinois River Valley southwest of the last glacial margin (Fig. 1), the Jules Geosol, a weakly developed paleosol, is regionally traceable within the upper third of Peoria Silt (Willman and Frye, Reference Yanes, Gutierrez-Zugasti and Delgado1970; Frye et al., Reference Frye, Leonard, Willman, Glass and Follmer1974). Some weak bands or paleosols within thick Peoria loess of southwestern Illinois may also correlate to the Jules Geosol (Frye et al., Reference Frye, Leonard, Willman, Glass and Follmer1974; McKay, Reference McKay1979). Grimley et al. (Reference Grimley, Follmer and McKay1998) used the Jules Geosol, along with magnetic susceptibility trends, to informally delineate upper and middle zones of the Peoria Silt along the Illinois Valley. The lower and middle Peoria zones of Grimley et al. (Reference Grimley, Follmer and McKay1998) were distinguished within Illinois loess based on magnetic susceptibility and mineralogical shifts, associated with the diversion of the Mississippi River to its present course by the advancing Lake Michigan Lobe.
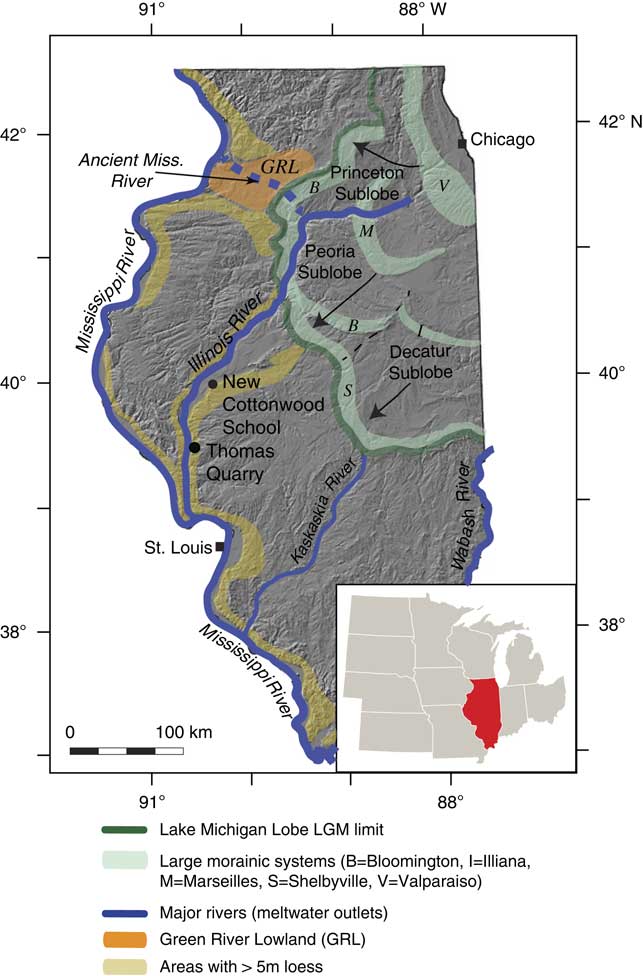
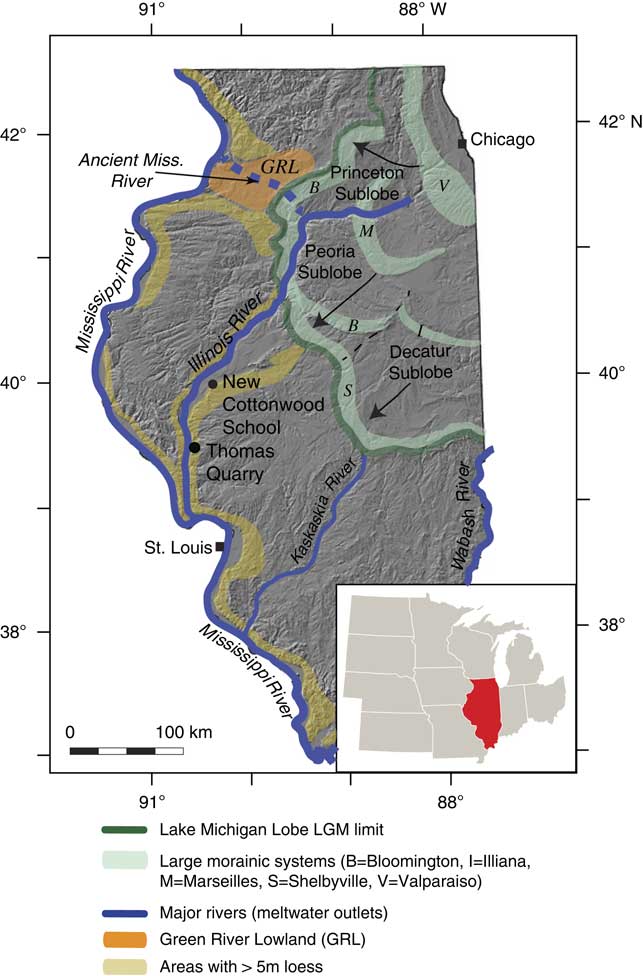
Location of the two study sites, New Cottonwood School and Thomas Quarry, adjacent to the Illinois River valley. The green line traces the maximum extent of the Lake Michigan Lobe. Sublobes are labeled with arrows that describe the direction of ice advance. Large morainic belts (Hansel and Johnson, Reference Hansel and Johnson1996) are delineated in light green; many smaller moraines are not shown. Loess >5 m thick is noted by light brown shading. The former path of the ancient Mississippi River, prior to its diversion to its present course, is shown as a dashed blue line. (For interpretation of the references to color in this figure legend, the reader is referred to the web version of this article.)
STUDY SITES
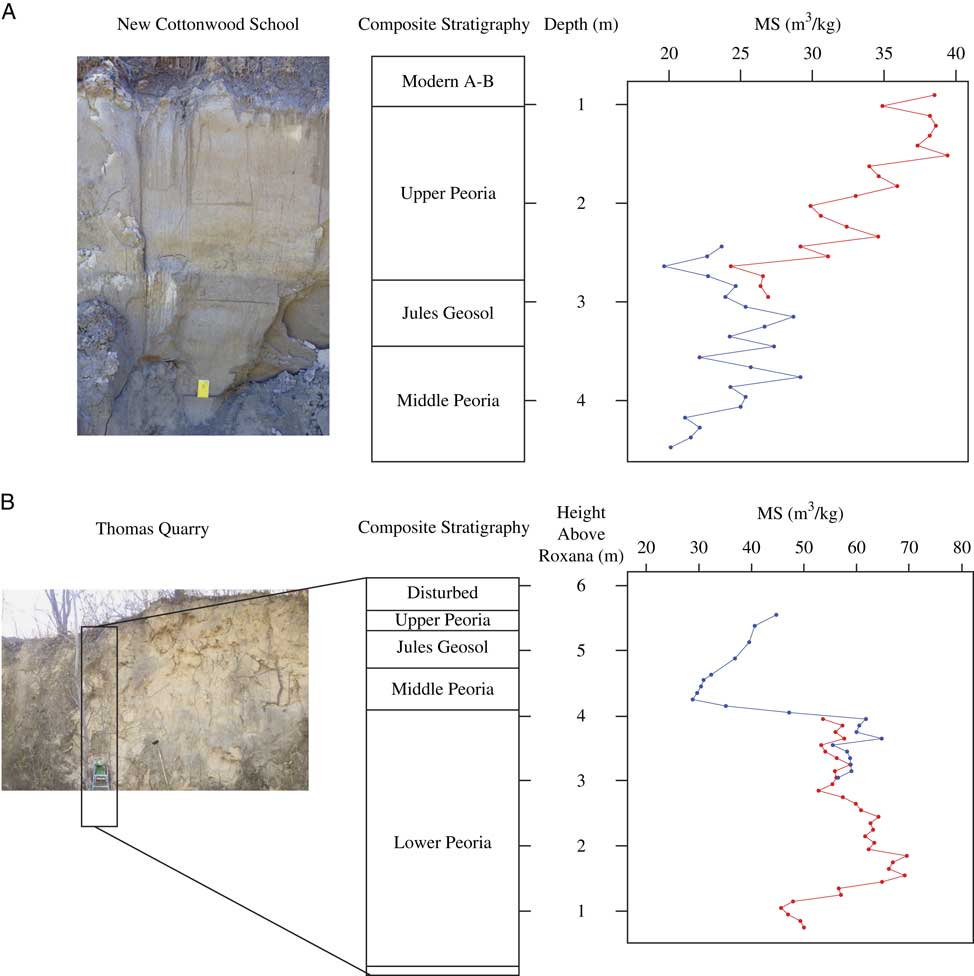
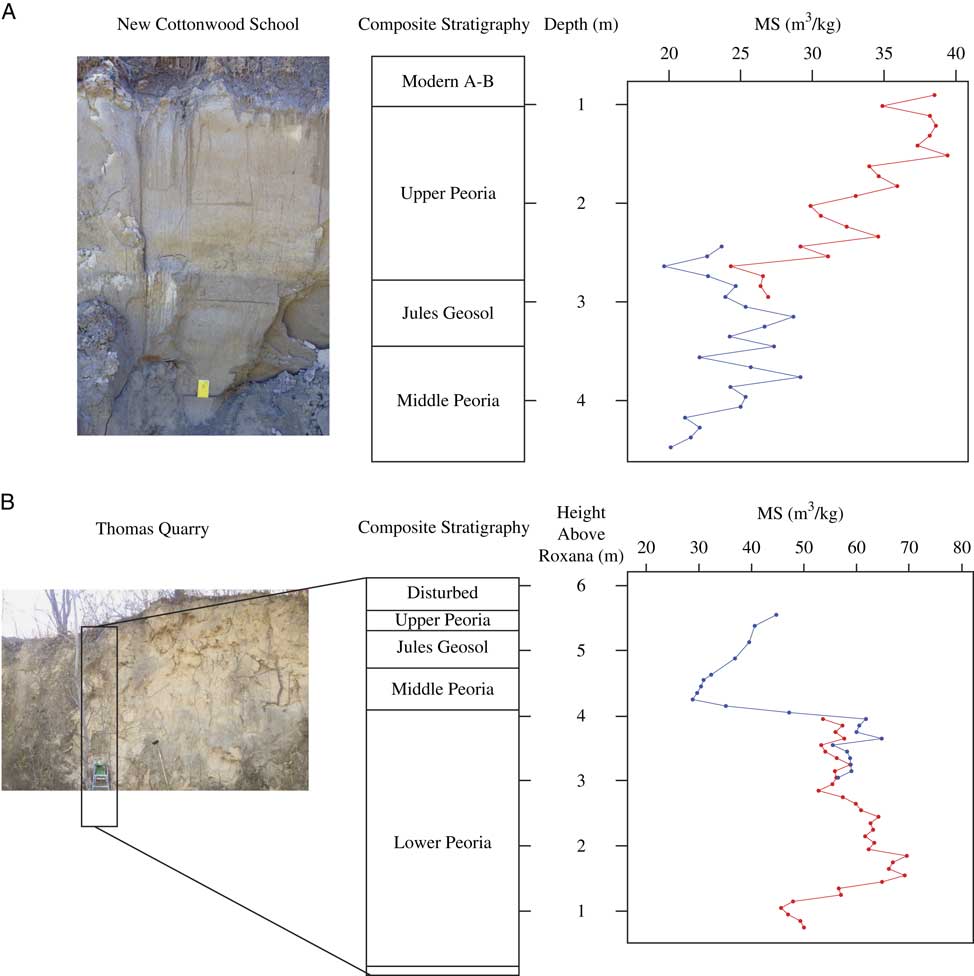
Two sites were selected on uplands adjacent to the Illinois River Valley (Fig. 1) based on the presence of abundant gastropod fossils and the occurrence of the Jules Geosol (Leonard and Frye, Reference Leonard and Frye1960; Frye et al., Reference Frye, Leonard, Willman, Glass and Follmer1974; Grimley et al., Reference Grimley, Follmer and McKay1998). The New Cottonwood School (40.0236°N, 90.2905°W) outcrop is located 150 m east of the original Cottonwood School Section described by Willman and Frye (Reference Yanes, Gutierrez-Zugasti and Delgado1970; Fig. 1). The studied outcrop was split into two subsections, New Cottonwood School A and New Cottonwood School B, due to talus slopes below New Cottonwood School A preventing sampling of in situ loess (Fig. 2). Peoria Silt is ~12.9 m thick at the original, uneroded Cottonwood School section (Willman and Frye, Reference Yanes, Gutierrez-Zugasti and Delgado1970; Grimley et al., Reference Grimley, Follmer and McKay1998). The New Cottonwood School Section is a 20-m-long, 4-m-wide, 5-m-deep gully formed by agricultural tile drain runoff on the edge of a flat upland. The upper 1 m of loess includes the modern soil solum, which is leached of carbonates and is truncated (~0.65 m missing) due to the creation of a sediment control berm. The Jules Geosol has a relatively distinct upper contact ~2.7 m below the ground surface and is ~0.6 m thick. Compared with relatively unaltered loess above and below the paleosol, the Jules Geosol is slightly darker and finer-grained, with better-developed soil structure, more secondary carbonate nodules, and fewer intact gastropods shells. At the original Cottonwood School Section, the Jules Geosol was identified as multiple (up to 5) thin dark bands (A/C horizons) that in places merged together or became indistinguishable within a single paleosol up to 0.6 m thick (Frye et al., Reference Frye, Leonard, Willman, Glass and Follmer1974; Grimley, D., unpublished data).
(A) Composite stratigraphy at the New Cottonwood School site. Magnetic susceptibility measurements were used to correlate between different subsections of the outcrop New Cottonwood School A (red, pictured) and New Cottonwood School B (blue). These subsections are laterally adjacent to each other but are separated by 2 m. (B) Composite stratigraphy at the Thomas Quarry site. Magnetic susceptibility measurements were used to correlate subsections Thomas Quarry A (red) and Thomas Quarry B (pictured; blue). (For interpretation of the references to color in this figure legend, the reader is referred to the web version of this article.)
To confirm the stratigraphic context of the New Cottonwood School outcrops, a sediment core (40.0228°N, 90.2928°W), the Cottonwood School Core, was collected on flat, undisturbed upland, adjacent to a dirt road, ~200 m southwest of the New Cottonwood School exposure. A 21-m-long, 4-cm-diameter core was acquired using direct push drilling methods with an AMS Powerprobe 9600. The Peoria Silt constitutes the upper 13.4 m of the core, with lower 7.4 m consisting of the Roxana Silt (mid-Wisconsin Episode loess). The Roxana Silt gradationally overlies the last interglacial Sangamon Geosol, encountered in the basal 0.2 m of the core. Within the Peoria Silt, the top of the Jules Geosol top occurs at 3.4 m depth in the core, 0.7 m deeper than at the New Cottonwood School outcrop. The modern soil solum (including carbonate-leached upper C horizon) extends to a 1.8 m depth in the core, suggesting the New Cottonwood School section is missing ~0.6 m of the modern soil upper solum.
The Thomas Quarry outcrop (39.5201°N, 90.5157°W) is an active limestone quarry ~60 km south of New Cottonwood School, along the Illinois River Valley (Fig. 1). Previously, 8.5 m of Peoria Silt was exposed here along a westward facing wall of the original pit (Grimley et al., Reference Grimley, Follmer and McKay1998), along with the underlying mid-Wisconsin Episode Roxana Silt, Illinois Episode till, and pre-Illinois Episode alluvium that included interglacial paleosol development. The original section is no longer accessible. Thus, two sections along the northward facing wall of the original pit, ~300 m west of the original section, were sampled (Fig. 2). Subsection Thomas Quarry A had a complete record of the gastropod-bearing lower Peoria Silt. However, a combination of natural or anthropogenic (i.e., mining) erosion, has removed the entire upper Peoria and most of the middle Peoria Silt at Thomas Quarry A, which included the Jules Geosol (Fig. 2). The second subsection (Thomas Quarry B) sampled was 46 m east of the Thomas Quarry A section at a higher topographic point on the bluff. This section provided a more complete exposure of Peoria Silt including both the lower and middle Peoria Silt and extending up through the Jules Geosol (Fig. 2), but the upper Peoria Silt was still partially eroded. Based on magnetic susceptibility correlations to the original Thomas Quarry section (Supplementary Fig. 1), 2.8 m of Peoria Silt is missing. Due to its proximity to the ground surface, the Jules Geosol was less distinctive at the Thomas Quarry section in comparison to the New Cottonwood School section and the original Thomas Quarry section. However, the paleosol could be distinguished by slight changes in the pedologic structure, cohesiveness, and an increase in secondary carbonate and clay.
METHODOLOGY
Sample collection
The New Cottonwood School and Thomas Quarry A sections were measured downwards with the modern surface as 0 m, whereas subsection Thomas Quarry B was measured upwards from an arbitrary datum above the basal contact of the Peoria and Roxana Silt. The Thomas Quarry A and B sections were then combined to create a common vertical scale, using the height above Roxana Silt and verified by magnetic susceptibility trend correlations (Fig. 2 and Supplementary Fig. 1). At each site, approximately 250 g of sediment was collected at 10 cm intervals for sediment analyses. For gastropod fossil surveys, approximately 10 kg of sediment was collected continuously at 25 cm vertical intervals, with samples taken laterally over a width of about 50 cm and up to 30 cm into the section. Additionally, individual gastropod shells protruding from the walls of the loess exposures were collected for radiocarbon dating and isotopic measurements. Their individual depths were recorded at 5 cm resolution at the time of collection.
Radiocarbon dating
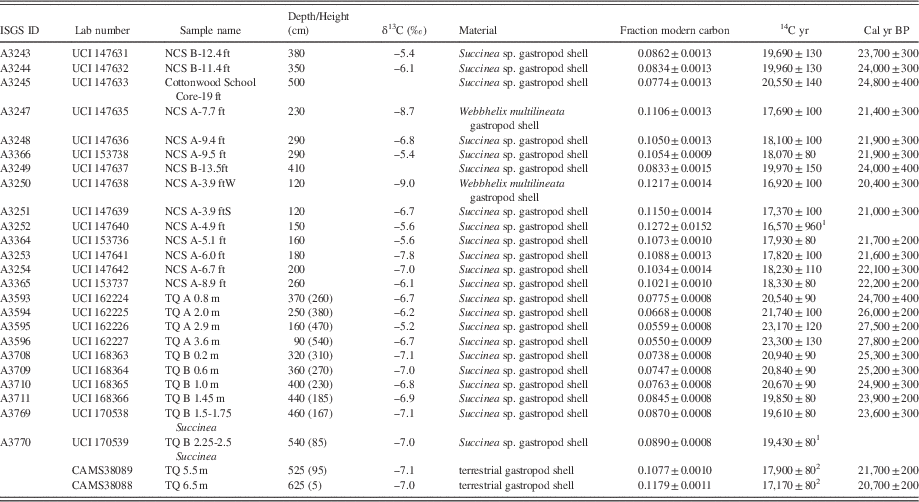
Succinea sp. shells (n=22) and Webbhelix multilineata shells (n=2) were selected from both New Cottonwood School and Thomas Quarry for radiocarbon dating. Two additional Succinea sp. or Anguispira alternata shells from the original Thomas Quarry Section (Grimley, D., unpublished data) were also included to extend the Thomas Quarry age model into the upper Peoria Silt. Anguispira alternata is also reported to give reliable radiocarbon ages (Pigati et al., Reference Pigati, Rech and Nekola2015). Depths for these ages are based on magnetic susceptibility correlations with Thomas Quarry A and Thomas Quarry B (Supplementary Fig. 1). Shells were pretreated by an initial cleaning with deionized water in an ultrasonic bath. Shells were then broken to remove sediment trapped within the whorls, followed by etching with 10% HCl, which removed secondary carbonate, a procedure modified from Pigati et al. (Reference Prospero, Bullard and Hodgkins2010). Shell fragments were resonified and inspected under a microscope to ensure samples were free of detrital grains and secondary carbonate. Dried shell fragments were pretreated and reacted in vacuo with phosphoric acid at the Illinois State Geological Survey (ISGS) Radiocarbon Laboratory. Radiocarbon measurements were made at the University of California-Irvine using a NEC 0.5MV 1.5SDH-2 accelerator mass spectrometer. Age models were produced in the Bacon 2.2 age model program (Blaauw and Christen, Reference Blaauw and Christen2011), using 24 radiocarbon ages (Table 1, New Cottonwood School n=13, Thomas Quarry n=11) and the IntCal13 calibration curve (Reimer et al., Reference Riddle2013). We discuss calibrated ages and error rounded to the nearest century.
Radiocarbon ages (±1-sigma) and calibrated ages (2-sigma), rounded to nearest century, from New Cottonwood School (NCS) and Thomas Quarry (TQ) samples. Depths are in cm below ground surface for New Cottonwood School samples and cm above Roxana for Thomas Quarry. Depths in parentheses for Thomas Quarry represent depths used in Bacon program, which represent depth above ground surface.
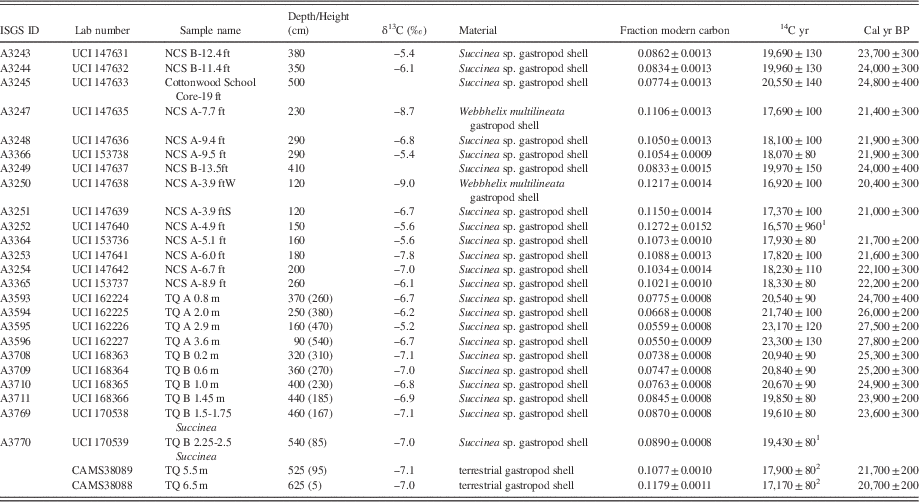
1 Notes: A3252 was excluded from the age model because of a laboratory error, which exposed sample to open air and resulted in a large error. A3770 was excluded due to poor shell quality (staining and fragility) and uncertainty in sampling depth.
2 Succinea sp. or Anguispira alternata ages (Grimley, D., unpublished data). Composite Thomas Quarry shell depths based on MS correlation with Thomas Quarry A and Thomas Quarry B (Supplementary Fig. 1).
Grain size and compositional analyses
For grain size analysis preparation, 5 g of sediment was used from each 10 cm sampling interval. Secondary carbonate nodules were removed mechanically with a 250 μm sieve. Samples were dispersed in a mixture of distilled, deionized water and 0.5% sodium hexametaphosphate [(NaPO3)6] solution for 48 hours prior to measurement. The sediment was mechanically dispersed by vigorously shaking the centrifuge tube for 90 seconds before samples were added to a Hydro MV coupled to a Malvern Mastersizer 3000 laser particle size analyzer. Results are expressed in volume percent abundance of sample particle diameters. In this study, we employ a ratio of coarse and medium silt to fine silt and clay to portray particle size variability.
Magnetic susceptibility measurements were made at 10 cm intervals. Prior to measurement, sediment was lightly crushed using a mortar and pestle and dry sieved to remove particles greater than 2 mm. Magnetic susceptibility measurements were made using a Bartington MS2 magnetic susceptibility meter (Mullins, Reference Mullins1977). The <2 mm sediment was loaded into plastic cubes, weighed, and measured twice. The average measurement was divided by the mass of the sediment and multiplied by 10 to calculate the final measurement in 10−8 m3/kg. Samples for clay mineralogical analysis were analyzed at 30 cm intervals from the New Cottonwood School site. Clay mineralogy procedures followed the methods of Hughes et al. (Reference Hughes, Moore and Glass1994) and Moore and Reynolds (Reference Moore and Reynolds1997). Glycolated, oriented, and aggregated slides of the <2 μm fraction were analyzed at the ISGS using a Scintag X-ray diffractometer (XDS 2000 with a theta-theta goniometer). Mineral peak intensities were quantified using JADE processing software (Materials Data Incorporated). The relative proportions of clay minerals (expandable clays, illite, kaolinite, and chlorite) were calculated from peak intensities as a percentage of total phyllosilicates, using methodology of Hughes et al. (Reference Hughes, Moore and Glass1994).
δ18O and δ13C of gastropod shell carbonate
Small Succinea sp. shells (5–10 mm in length) were selected for stable isotopic analysis. Shell carbonate was pretreated with the same process for radiocarbon dating modified from Pigati et al. (Reference Prospero, Bullard and Hodgkins2010). Shell fragments were then powdered using an agate mortar and pestle. Measurements of oxygen and carbon isotope ratios from 45±5 μg aliquots gastropod shell carbonate were made using a Finnigan Mat 252 isotope ratio mass spectrometer in the Stable Isotope Laboratory at the ISGS. Measured oxygen and carbon isotope ratios were converted to per mil (‰) delta notation, using the Vienna Pee Dee Belemnite (VPDB) standard:
 $$\delta ^{{18}} {\rm O}\,{\equals}\,\left( {{{{ ^{{18}} { O}} \over {{ ^{{16}} { O}}}}sample} \over {{ ^{{18}} { O}} \over {{ ^{{16}} { O}}}}\,standard}}{\minus}1} \right){\times}1000‰{\permil}$$
 $$\delta ^{{13}} {\rm C}\,{\equals}\,\left( {{{{ ^{{13}} { C}} \over {{ ^{{12}} { C}}}}\,sample} \over {{{ ^{{13}} { C}} \over {{ ^{{12}} { C}}}}\,standard}}{\minus}1} \right){\times}1000‰{\permil}$$
Error (precision) is±0.2‰ for δ18O and±0.1‰ for δ13C based on laboratory standards.
Gastropod assemblages and paleotemperature
The processing and identification of gastropod fossil species used methods similar to Rossignol et al. (Reference Rousseau and Kukla2004). For each sample, 10 kg of sediment was wet sieved through a 0.5 mm sieve to separate gastropod shells from sediment. Dried shells were identified to species (or genus) level using the A. Byron Leonard and Frank C. Baker Pleistocene gastropod collections at the ISGS and Illinois Natural History Survey, along with field guides of modern and Pleistocene terrestrial gastropods (Baker, Reference Baker1939; Leonard and Frye, Reference Leonard and Frye1960; Burch and Jung, Reference Burch and Jung1988). Whole adult shells were counted for each species at each sample depth. Succinea were not able to be identified beyond genus level.
Paleotemperature estimates from gastropod assemblages were based on a modified mutual climatic range (MCR) method (Moine et al., Reference Moine, Rousseau, Jolly and Vianey-Liaud2002; Horne et al., Reference Horne, Curry and Mesquita-Joanes2012). MCR uses the overlap of temperature ranges of modern species to estimate the temperature range of fossil assemblages. Modern North American ranges of gastropods from our species assemblages were limited to areas east of 100°W to exclude high elevation sites impacted by orographic thermal effects. Areas south of the continental United States were also excluded. The warmest and coldest locations (with respect to mean July temperatures) for individual gastropod species were estimated from a combination of published range maps (Hubricht, Reference Hubricht1985; Nekola and Coles, Reference Pigati, McGeehin, Muhs and Bettis2010; http://www.discoverlife.org) and a 0.5° × 0.5° gridded mean July temperature dataset from the University of East Anglia Climatic Research Unit (TS3.24.01; Jones and Harris, Reference Jones and Harris2008). The latitude and longitude of the coldest and warmest range limits were input into this dataset to find the present-day range of mean July temperature for each species. We selected July temperature, the warmest summer month, as snails are most active during summer months, when temperature and relative humidity are highest (Riddle, Reference Rossignol, Moine and Rousseau1983). We assume high relative humidity also occurred in summer in the past, as LGM relative humidity is estimated to have been similar to today in the midcontinent of North America (Voelker et al., Reference Wang, Follmer and Liu2015). Similar high relative humidity would have deterred gastropod aestivation.
RESULTS
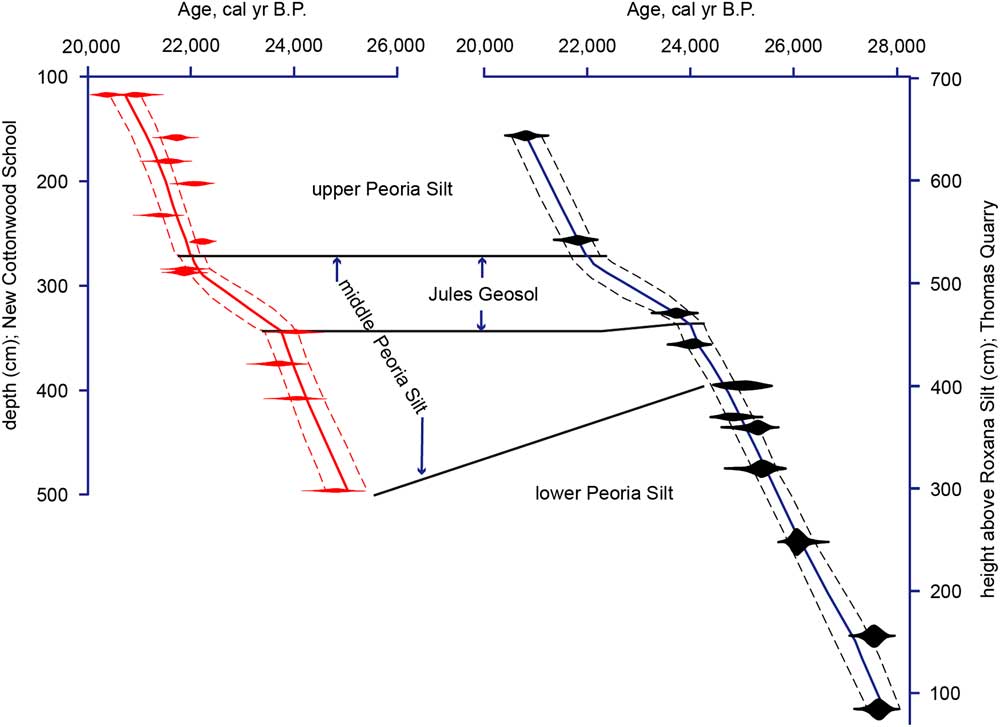
The calibrated ages of gastropod-bearing Peoria Silt range from 27,500 to 20,400 cal yr BP, with the Jules Geosol forming between 23,700±300 and 22,000±200 cal yr BP (Table 1 and Fig. 3). Average sediment accumulation rates (SAR) at New Cottonwood School were 0.4 mm/yr in the Jules Geosol zone and 1.2 mm/yr for the slightly coarser and lighter-colored upper and middle Peoria Silt, above and below the paleosol, respectively. Average accumulation rates at Thomas Quarry were 0.5 mm/yr within the Jules Geosol and ~1.0 mm/yr for the Peoria Silt above and below the paleosol (Fig. 3). An age estimate for the timing of youngest Peoria Silt deposition is determined via interpolation through the upper ~1.8 m of loess (at both sites) that contains the modern soil profile. A linear interpolation using the highest SAR at New Cottonwood School (1.2 mm/yr) would imply loess deposition ceased at 18,800±300 cal yr BP. However, a more conservative interpolation using the slower “Jules” SAR (0.4 mm/yr) would imply loess deposition ceased 16,000±200 cal yr BP (Supplementary Fig. 2). The age for the basal contact of Peoria Silt and Roxana Silt at Thomas Quarry is estimated to be 28,500±200 cal yr BP based on extrapolation of the 1.0 mm/yr lower Peoria SAR.
New Cottonwood School (left, red) and Thomas Quarry (right, blue) age models. Calibrated radiocarbon age ranges are plotted in red and black. Bounding dashed lines on either side of the model indicate the 95% confidence interval. The top of the Jules Geosol was used as a datum for correlation purposes. (For interpretation of the references to color in this figure legend, the reader is referred to the web version of this article.)

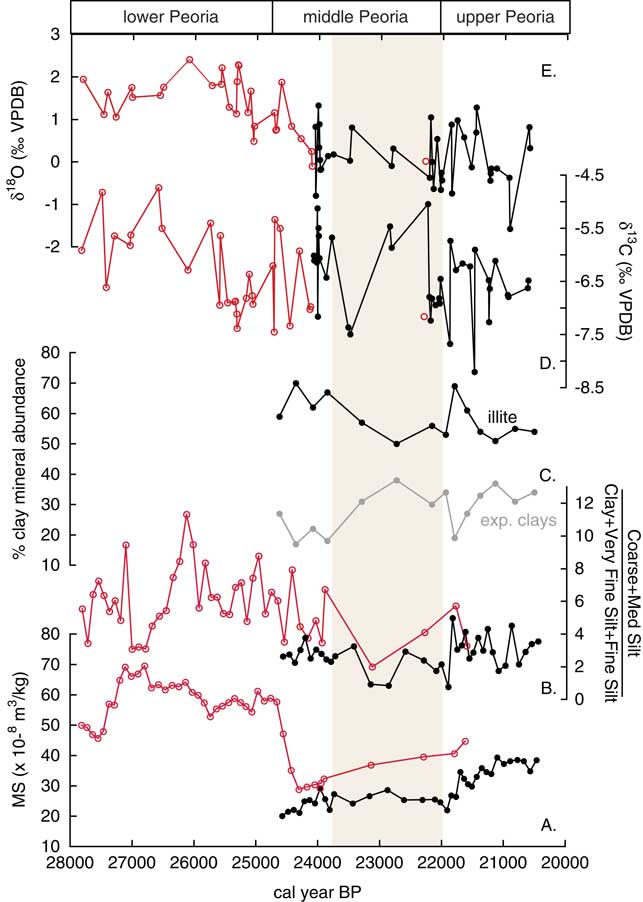
Particle size data indicate relatively finer grain size and higher variance within the Jules Geosol (Fig. 4B). At New Cottonwood School, the upper Peoria Silt, Jules Geosol zone, and the middle Peoria Silt (below Jules Geosol) have average median particle sizes of 29.4±2.5 μm, 22.5±5.5 μm, and 28.1±1.5 μm, respectively (Supplementary Fig. 3A). At Thomas Quarry, the Jules Geosol zone, middle Peoria Silt (below Jules Geosol), and lower Peoria Silt have average median particle sizes of 30.2±5.4 μm, 35.8±3.4 μm, and 36.9±2.9 μm, respectively, combining data from the two sub-sections (Supplementary Fig. 3B). Grain size is also expressed as a ratio of volume percent abundance of medium and coarse silt (16–62 μm diameter) to that of clay, very fine silt, and fine silt (<16 μm diameter; Fig. 4B). At New Cottonwood School, the upper Peoria Silt, Jules Geosol zone, and the middle Peoria Silt (below Jules Geosol) have mean grain size ratios of 3.1±1.0, 2.1±0.9, and 2.5±0.7, respectively. At Thomas Quarry, the Jules Geosol zone, middle Peoria Silt (below Jules Geosol), and lower Peoria Silt have mean grain size ratios of 3.0±1.0, 5.0±1.7, and 6.2±1.9, respectively.
Time series from the New Cottonwood School and Thomas Quarry sections, plotted versus calibrated ages. Black line and solid circles denote data from New Cottonwood School section, red line and open circles denote data from Thomas Quarry section. Brown highlighting represents the Jules Geosol zone. A) Magnetic susceptibility B) Ratio of volume percent abundance coarse and medium silt to clay, very fine silt, and fine silt C) Illite and expandable clay percent abundance (New Cottonwood School only) D) Gastropod carbonate δ13C values E) Gastropod carbonate δ18O values. (For interpretation of the references to color in this figure legend, the reader is referred to the web version of this article.)
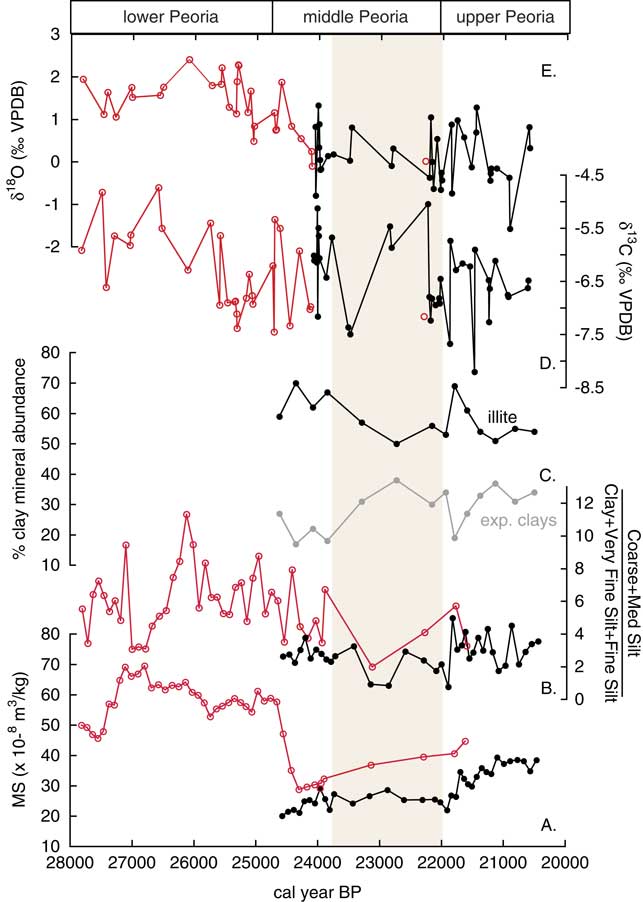
Magnetic susceptibility (MS) and clay mineralogy from the two field sites are also presented as time series data in Figures 4A and 4C. At New Cottonwood School, the upper Peoria Silt and middle Peoria Silt (including Jules Geosol zone) have average MS values of 35±5×10⁻⁸ m3/kg and 25±3×10⁻⁸ m3/kg, respectively. At Thomas Quarry the middle Peoria Silt (including Jules Geosol zone) and lower Peoria Silt have average MS values of 35±5×10⁻⁸ m3/kg and 58±6×10⁻⁸ m3/kg, respectively. MS values for the Jules Geosol and middle Peoria are higher at Thomas Quarry than New Cottonwood School, likely a result of the overall coarser particle size at Thomas Quarry. However, both sites showed a similar trend of decreasing MS from the upper to middle Peoria Silt. MS curves were used to correlate informal stratigraphic zones within the Peoria Silt between the two Thomas Quarry sections (A and B), and the original Thomas Quarry section of Grimley et al. (Reference Grimley, Follmer and McKay1998; Supplementary Fig. 1). The abrupt MS decrease at the lower-middle Peoria Silt contact, representing the Mississippi River diversion, reveals a change in sediment provenance from more northern glacial lobes in Minnesota and Wisconsin to dominantly Lake Michigan Lobe sediment sources (Grimley et al., Reference Grimley, Follmer and McKay1998; Grimley, Reference Grimley2000). The relative abundance of illite, expandable clays, chlorite, and kaolinite are also presented in time series form for the New Cottonwood School Section (Fig. 4C). The most abundant clay mineral in Peoria Silt was illite (mean abundance 58±7%), followed by expandable clays (mean abundance 28±7%). The relative abundance of illite decreases and expandable clays increase within the Jules Geosol, but also higher up stratigraphically in the upper Peoria Silt.
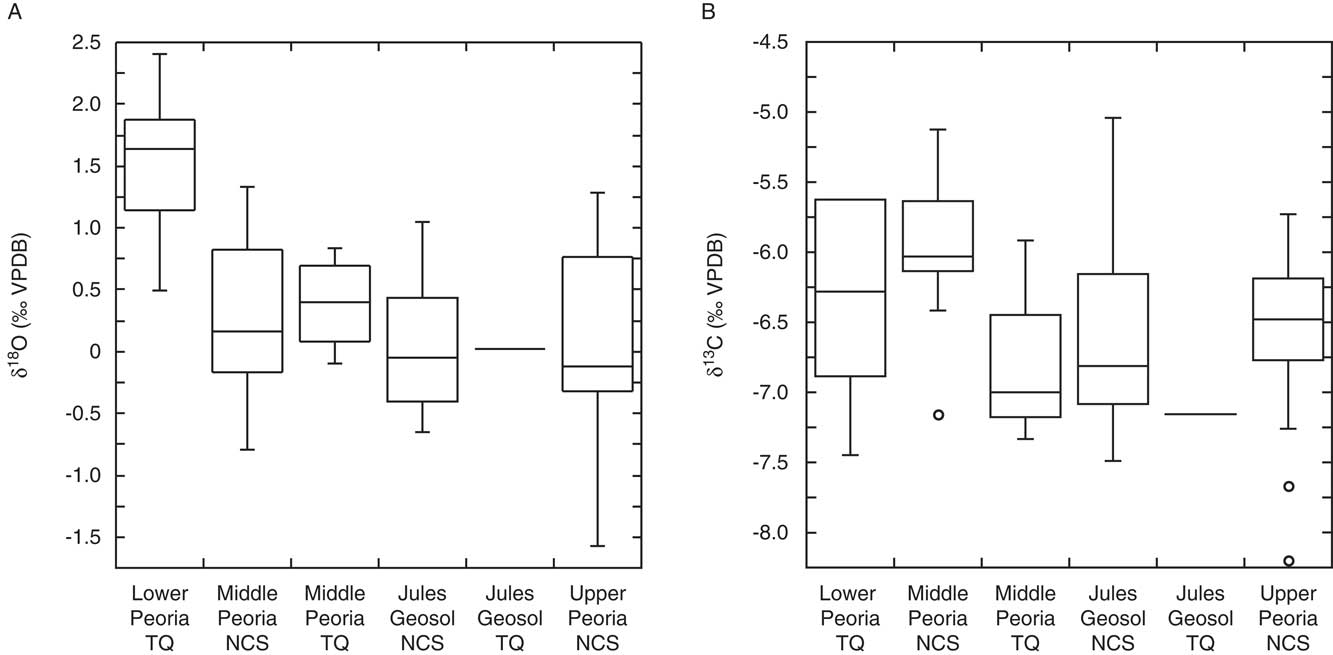
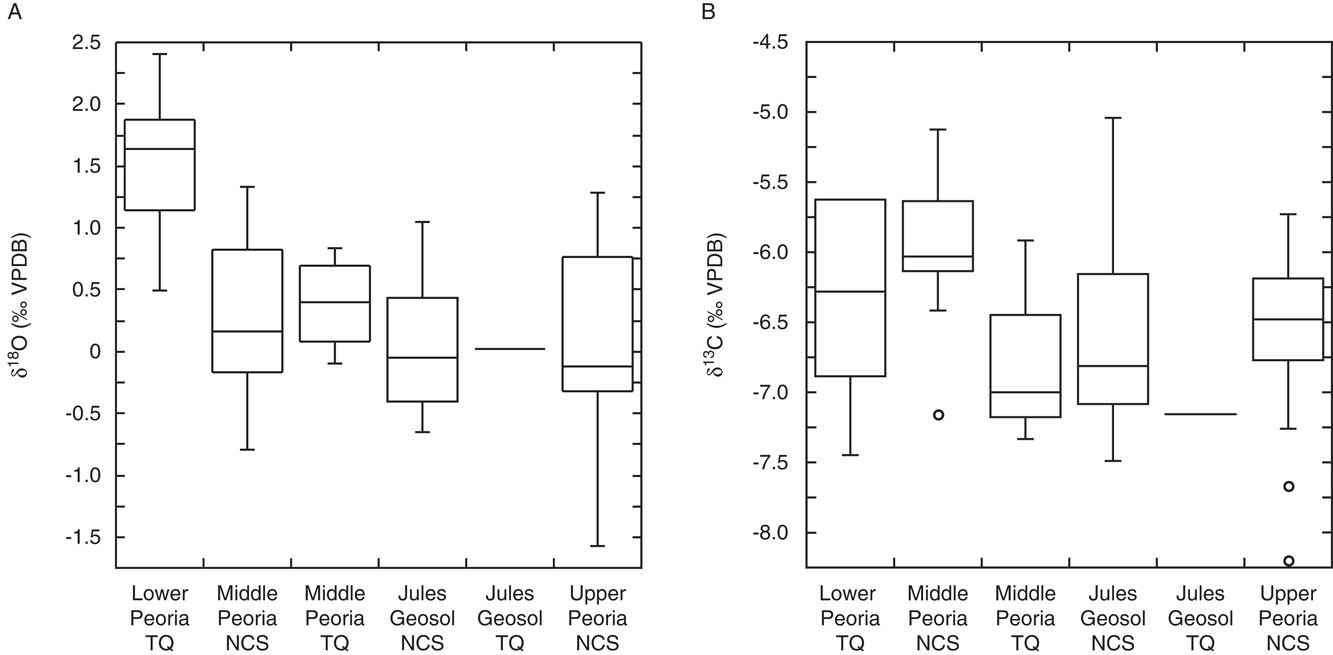
Succinea sp. carbonate δ18O values from New Cottonwood School range between -1.6 and 1.3‰ (Fig. 4E). Shells from the upper Peoria Silt, Jules Geosol zone, and middle Peoria Silt (below Jules) at New Cottonwood School had mean δ18O values of 0.1±0.8‰, 0.0±0.6‰, and 0.3±0.6‰, respectively (Fig. 5A). Shell δ18O values from Thomas Quarry range from -0.1 to 2.4‰, and show a 1.5‰ decrease from 26,000 to 24,000 cal yr BP (Fig. 4E). Lower Peoria Silt δ18O values at Thomas Quarry were relatively high, with a mean δ18O value of 1.5±0.6‰, whereas mean middle Peoria Silt δ18O values (0.4±0.4‰), are similar to middle Peoria δ18O values from New Cottonwood School. The δ13C values of New Cottonwood School Succinea sp. shells ranged from −8.2 to −5.0‰ (Fig. 4D), with mean values of −6.6±0.7‰, −6.6±0.8‰, and −6.0±0.6‰ for the upper Peoria Silt, Jules Geosol zone, and middle Peoria Silt (below Jules), respectively (Fig. 5B). At Thomas Quarry mean δ13C values are −6.2±0.7‰ in the lower Peoria Silt and −6.8±0.6‰ in the middle Peoria Silt.
Box and whisker plots of gastropod carbonate (A) δ18O values and (B) δ13C from New Cottonwood School (NCS) and Thomas Quarry (TQ), grouped by zone. The black line within each box represents the median δ18O or δ13C value. The box boundaries represent±25% of the variable population. Whisker ends represent data minima and maxima, excluding outliers (open circles), defined as values greater (less) than the upper (lower) quartile value plus 1.5 times inner quartile difference.
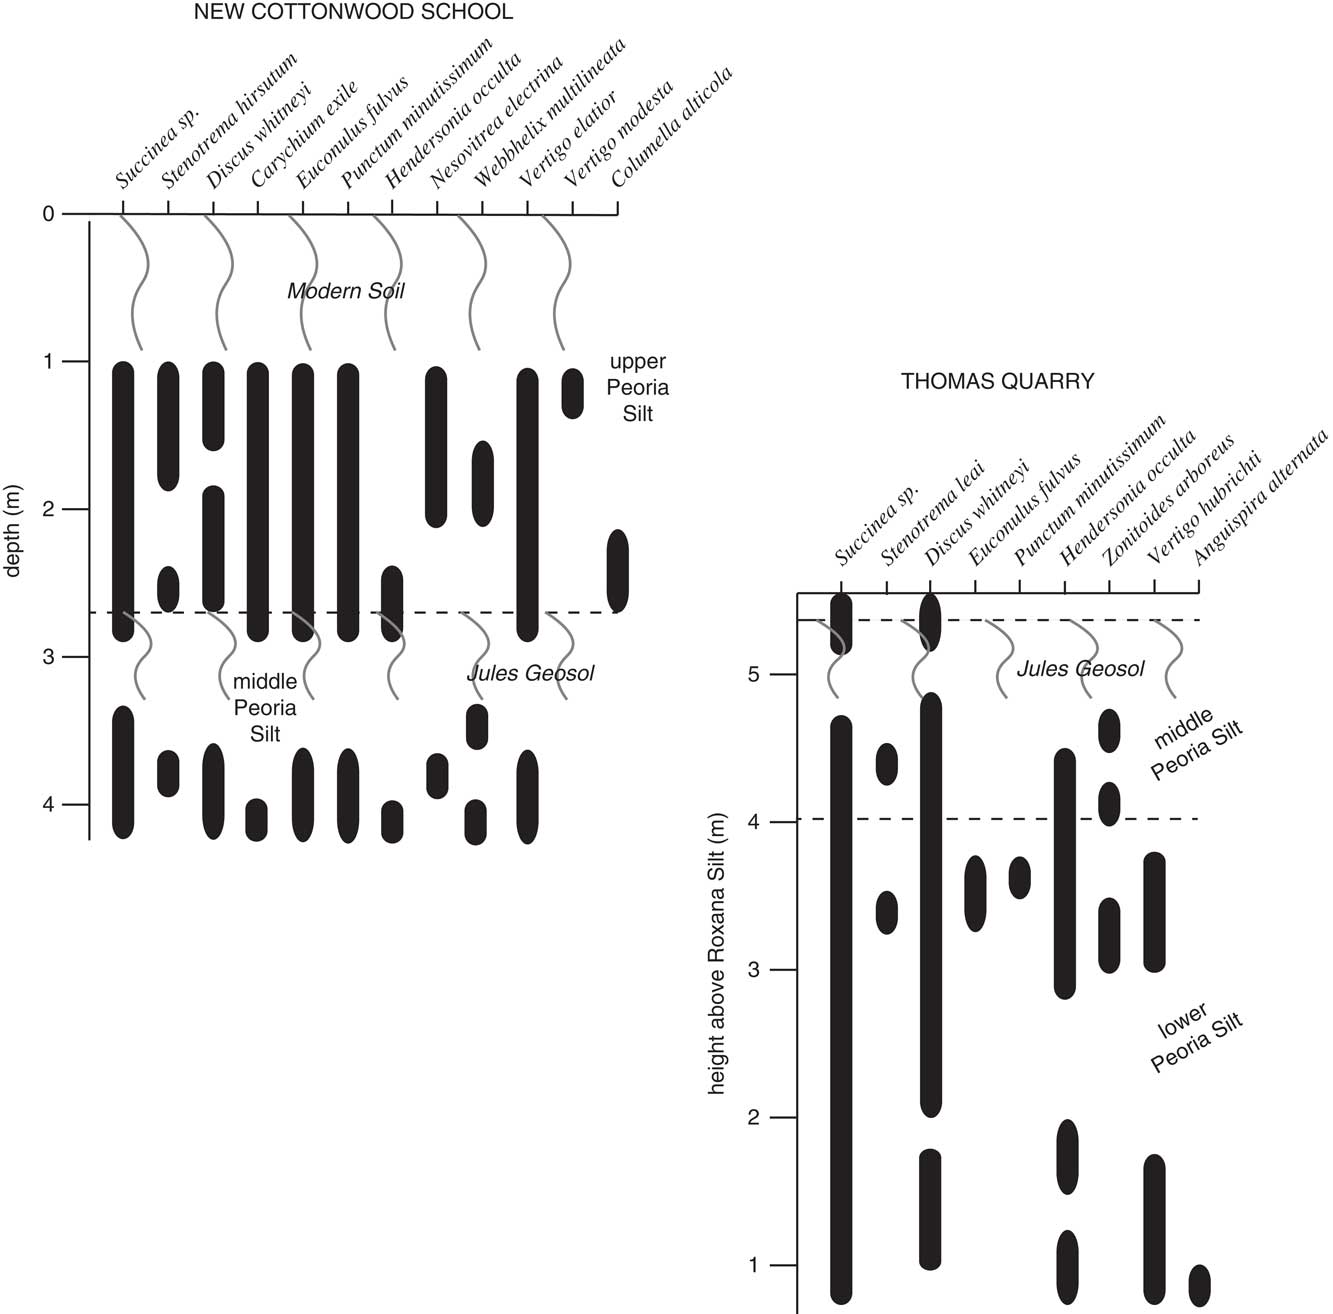
Over 1400 terrestrial gastropod shells were identified from the New Cottonwood School and Thomas Quarry sections (Supplementary Tables 1 and 2, Figure 6). There were a total of 12 and 9 unique species and 585 and 854 individuals identified at New Cottonwood School and Thomas Quarry sections, respectively. The most abundant gastropod species at New Cottonwood School were Punctum minutissimum (n=132), Succinea sp. (n=113), Vertigo elatior (n=111), and Carychium exile (n=83). At Thomas Quarry, the most abundant species were Discus whitneyi (n=406) and Succinea sp. (n=371). Five species occur at both site locations: Succinea sp., Discus whitneyi, Hendersonia occulta, Euconulus fulvus, and Punctum minutissimum. The species Stenotrema hirsutum, Carychium exile, Nesovitrea electrina, Webbhelix multilineata, Vertigo modesta, Vertigo elatior, and Columella alticola are found at New Cottonwood School but not at Thomas Quarry. Zonitoides arboreus, Stenotrema leai, Vertigo hubrichti, and Anguispira alternata are found at Thomas Quarry but not at New Cottonwood School. These differences may partly be temporal—a result of the sampling of lower Peoria Silt at Thomas Quarry and the sampling of the upper Peoria Silt at New Cottonwood School.
Representation of species presence/absence with changes in depth at New Cottonwood School and Thomas Quarry sections. Sinuous vertical lines represent modern soil (at New Cottonwood School) and Jules Geosol. Sampling for shells began below the bottom of the leaching horizon, 1 m below the surface at New Cottonwood School. Black bars represent the presence of that species at each depth.
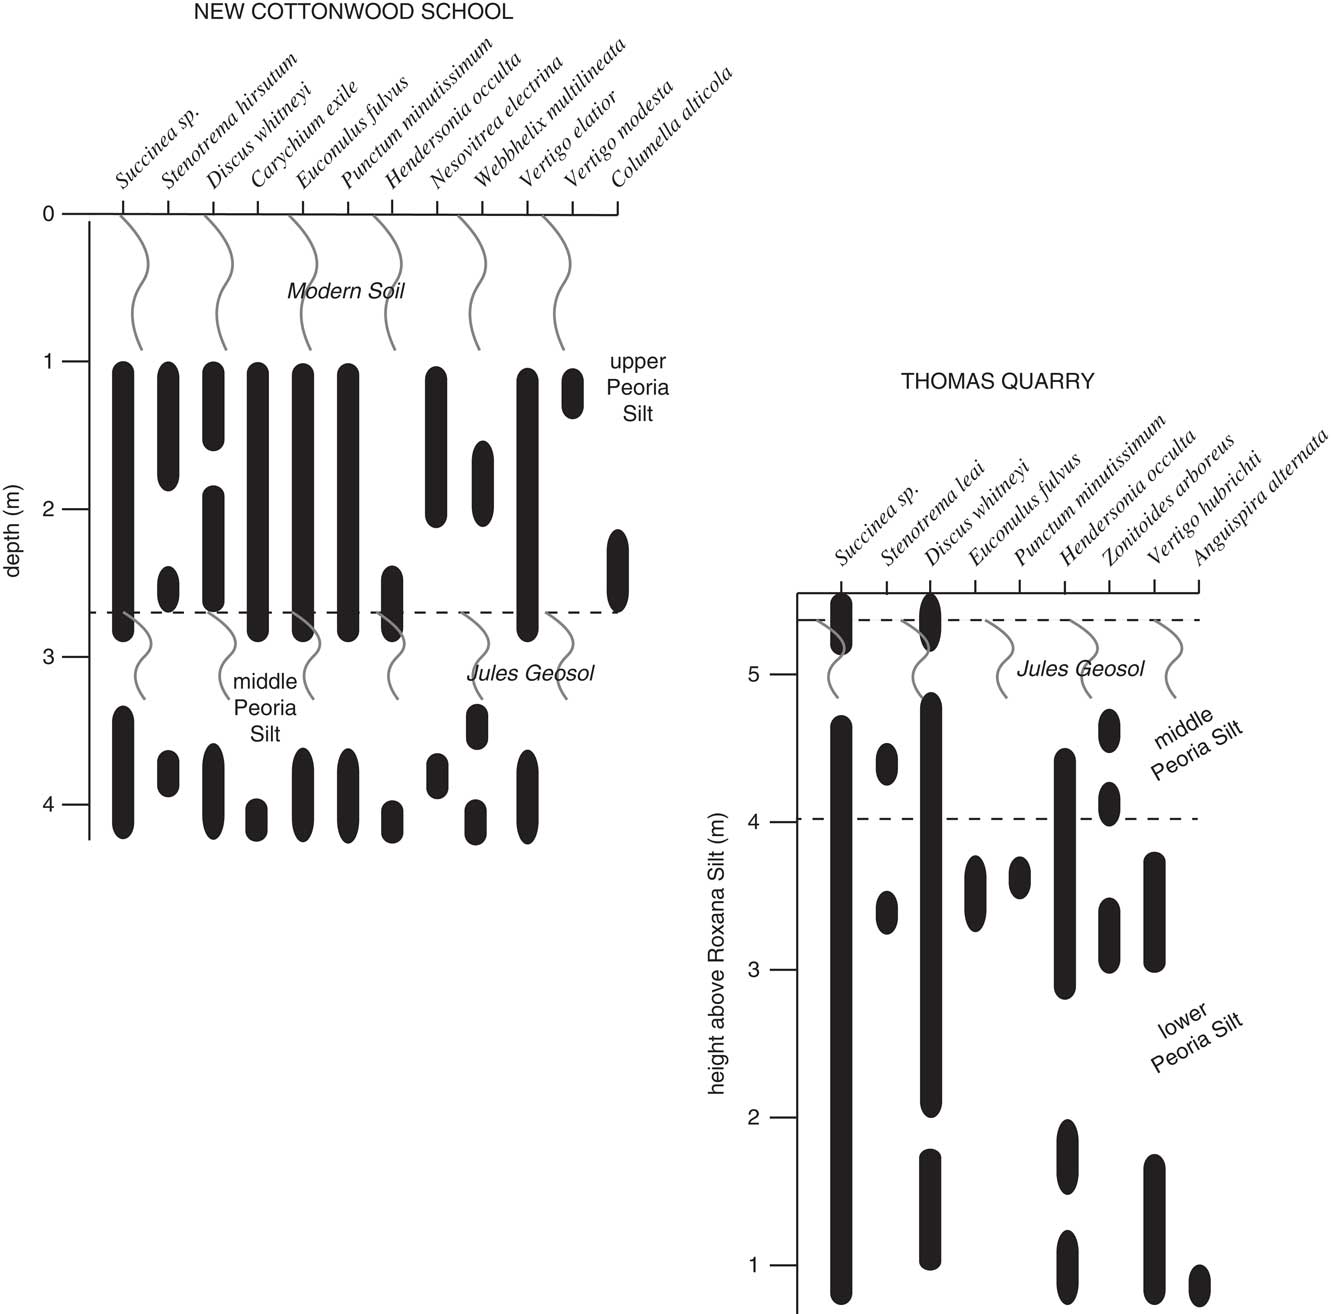
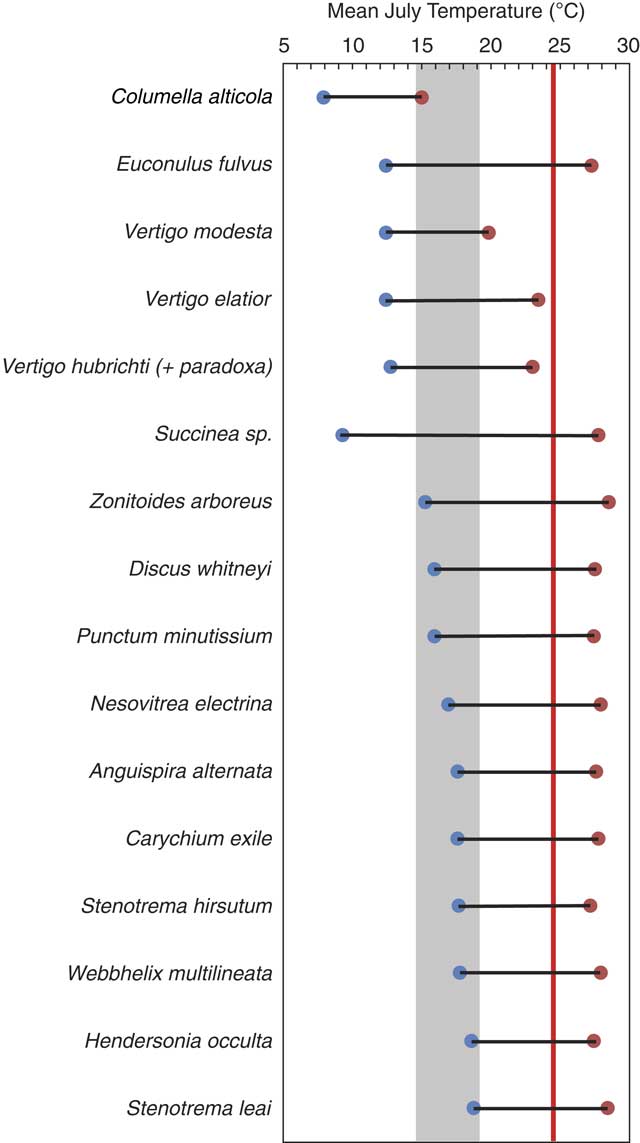
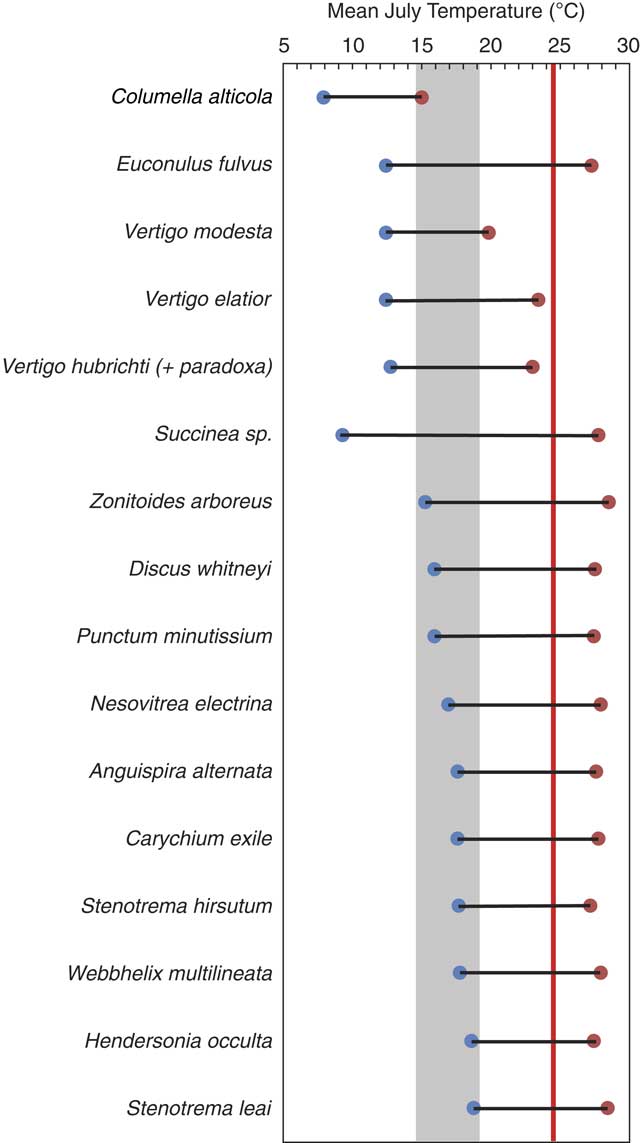
A mean July temperature range was calculated using a modified MCR method at both sites. Mean July temperature is not reconstructed based on assemblages at individual depths, due to the low number of species at some depths (Supplementary Tables 2 and 3). Modern (1901–2015) mean July temperature for the 0.5° × 0.5° grid that contains both New Cottonwood School and Thomas Quarry (40°N, 90°W) is 24.6±1.5°C. We find a mean July temperature range between 15 and 19°C (shaded gray in Fig. 7) would encompass the coolest maximum of a boreal to arctic species, C. alticola, and the warmest minima of H. occulta and S. leai. The co-occurrence of C. alticola and H. occulta, as well as many other species in the upper Peoria Silt above the Jules Geosol at New Cottonwood School, is a no-analog situation, as these species are not known to co-occur today. Some other species ranging southward to the upper Midwest, such as V. hubrichti (likely intergraded with V. paradoxa) are noted in modern surveys to occur in leaf litter pockets that support a cool summer microclimate (Nekola and Coles, Reference Pigati, McGeehin, Muhs and Bettis2010).
(color online) Reconstructed mean July temperature range using gastropod species at New Cottonwood School and Thomas Quarry sections. Gray shaded area represents likely range of late Glacial mean July temperature at our study sites based on coolest maximum and warmest minimum temperatures. Red line represents mean modern July temperature (24.6°C) for region.
DISCUSSION
Chronology of Peoria Silt deposition
Based on the radiocarbon chronologies from two sections, Peoria Silt deposition along the Illinois River Valley occurred in at least two pulses between 28,500 and 18,800–16,000 cal yr BP (younger age assuming slower rate). These new ages (Fig. 3) reveal the middle and upper Peoria Silt, including the Jules Geosol, are 2000–5000 yr older than previously thought in the Illinois Valley (Frye et al., Reference Frye, Leonard, Willman, Glass and Follmer1974; McKay, Reference McKay1979; Follmer, Reference Follmer1996; Grimley et al., Reference Grimley, Follmer and McKay1998). Cessation of loess deposition at 16,000 cal yr BP is coincident with the retreat of the Lake Michigan Lobe out of northeastern Illinois (~16,500 cal yr BP; Caron and Curry, Reference Caron and Curry2016). This time marks the beginning of proglacial Lake Chicago, which would have trapped, and thus drastically reduced, the supply of glacial sediment into the Illinois Valley. The older interpolated end of loess deposition, at 18,800 cal yr BP, approximates the age of the Kankakee Torrent, 18,930±50 cal yr BP, during which a channel was eroded to bedrock (Curry et al., Reference Curry, Hajic, Clark, Befus, Carrell and Brown2014). The Kankakee Torrent significantly modified the floodplain of the Illinois River Valley, which may have impacted local sediment transport, entrainment, and deposition of loess. Although an extrapolated age range of 18,800 to 16,000 cal yr BP for the youngest Peoria Silt (at ground surface) is reasonable, post-depostional carbonate leaching (up to 30% of loess mineralogy) and erosion may have reduced original loess thickness, whereas late glacial or postglacial distal dust additions (Mason and Jacobs, Reference Mason and Jacobs1998) may have had the reverse effect.
At the broad scale, the chronology of loess deposition along the Illinois Valley agrees with the timing of Peoria Silt deposition adjacent to the Missouri Valley in western Iowa, at a site with well-resolved chronologies derived from Succineidae gastropods and luminescence ages (~29,000 to 17,000 cal yr BP; Muhs et al., Reference Muhs, Bettis, Roberts, Harlan, Paces and Reynolds2013; Pigati et al., Reference Pigati, McGeehin, Muhs, Grimley and Nekola2013) and with recent loess chronologies from the Mississippi Valley region (~29,000 to <18,000 cal yr BP; Pigati et al., Reference Pigati, Rech and Nekola2015). Yet it remains unclear if millennial episodes of slow and rapid deposition are in phase among the different glacial meltwater valley sources of loess in the Central Lowlands.
Previous chronologies placed Jules Geosol development between 19,900 and 18,700 cal yr BP, during a period of reduced loess deposition and suggested a connection between the slowdown in loess accumulation and the Kankakee Torrent (Frye et al., Reference Frye, Leonard, Willman, Glass and Follmer1974). Our improved chronology indicates that Jules Geosol development, along with slow distal loess sedimentation, occurred between 23,700±300 and 22,000±200 cal yr BP, during the initial retreat of the Lake Michigan Lobe, following its maximal LGM extent. The new age models presented (Fig. 3) improve upon previous chronologies as they contain more numerous and accurate radiocarbon ages, calibrated and assembled in an age model that rigorously accounts for uncertainty. Prior at age determinations were based on either soil organic carbon, which has well-known reservoir issues (Grimm et al., Reference Grimm, Maher and Nelson2009) or less accurate conventional dating of large quantities of untreated gastropod shells (Frye et al., Reference Frye, Leonard, Willman, Glass and Follmer1974). In some cases, gastropod shells may not have been fully cleaned of secondary carbonate in shell interiors, resulting in younger ages (Rech et al., Reference Reimer, Bard, Bayliss, Beck, Blackwell, Ramsey and Buck2011). Our use of genera known to provide reliable radiocarbon results (Pigati et al., Reference Pigati, Rech and Nekola2010, Reference Pigati, Rech and Nekola2015), along with careful cleaning of shells and detailed stratigraphic sampling has resulted in more robust ages for Illinois River Valley region Peoria Silt.
The new age model of Illinois Valley region Peoria Silt is independently verified by the timing of a mineralogical and MS shift between the lower and middle the Peoria Silt representing the Mississippi River diversion. This diversion has been independently dated to 24,460±120 cal yr BP (Curry, Reference Curry1998), and is recorded as a significant decrease in MS and increase in illite, as glacial sediment supply from the Superior Lobe and Des Moines Lobes was cut off and Lake Michigan Lobe sediment sources increased in abundance (Grimley, Reference Grimley2000). Our age model produces an age of 24,400±200 cal yr BP for this decrease in MS (Fig. 2 and 3), matching the independent estimate of the diversion age by Curry (Reference Curry1998). This chronologic correlation provides additional evidence that the new age model of Peoria Silt is robust.
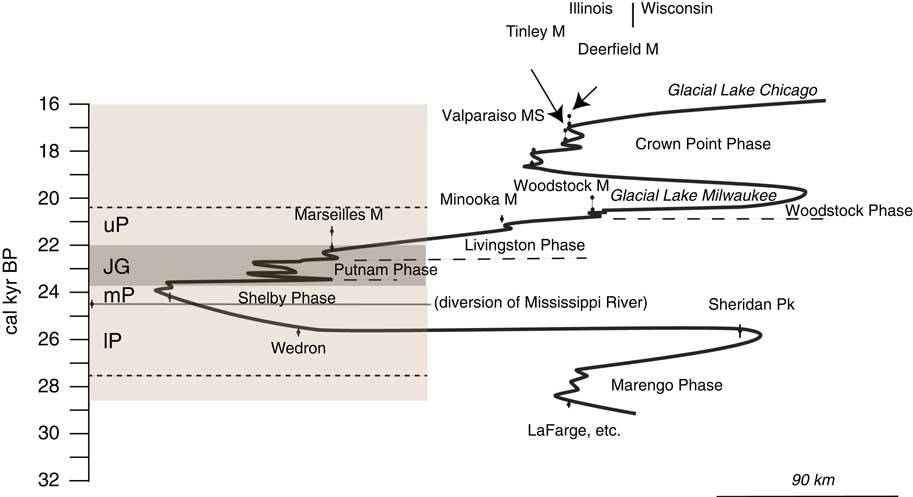
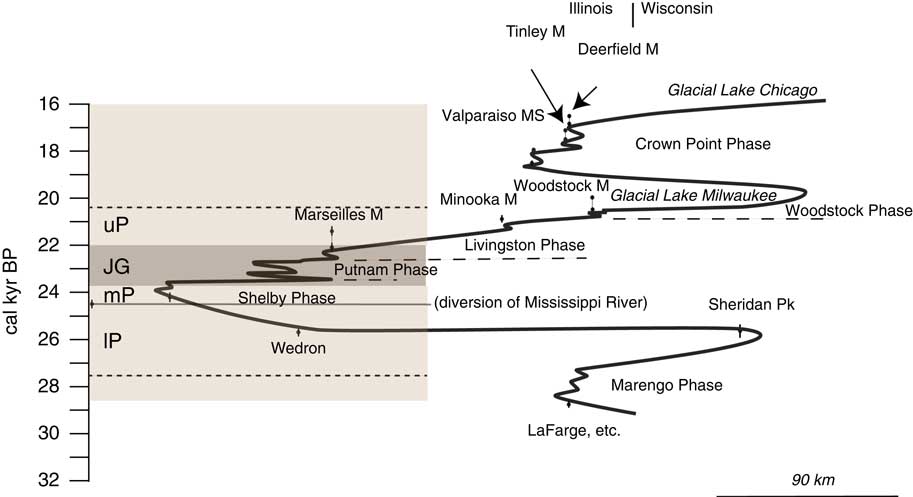
Illinois loess deposits have long been interpreted to primarily represent the presence of glacial ice south of the Great Lakes watershed (Leighton and Willman, Reference Leighton and Willman1950; Willman and Frye, Reference Yanes, Gutierrez-Zugasti and Delgado1970; McKay, Reference McKay1979; Follmer, Reference Follmer1996; Grimley, Reference Grimley2000). However, at the more detailed scale it remains unclear if periods of higher loess deposition rates and ice lobe positions were in phase. That is, did the majority of loess deposition occur when the Lake Michigan Lobe was at its southernmost extent, as hypothesized by Muhs et al. (Reference Muhs, Bettis, Roberts, Harlan, Paces and Reynolds2013)? Our study provides a revised age range for Illinois Valley Peoria Silt, placing the overall timing of its deposition coincident with the local LGM, when the Lake Michigan Lobe was advancing and at or near its southernmost extent (Fig. 8). The local LGM timing of loess deposition supports the notion of loess deposition during times of strong temperature gradients and higher glacial sediment loads, which likely both contributed to increased dustiness in the Illinois Valley during the LGM (McGee et al., Reference McGee, Broecker and Winckler2010).
Modified Lake Michigan Lobe time-distance diagram (Caron and Curry Reference Caron and Curry2016), versus the composite Peoria Silt stratigraphy based on New Cottonwood School and Thomas Quarry age-depth models (left, brown shading). Loess was deposited as the Lake Michigan Lobe advanced and retreated from its maximum southern position. JG, Jules Geosol, UP, upper Peoria Silt, mP, middle Peoria Silt, lP, lower Peoria Silt. Shaded area above dashed lines are interpolated times of loess deposition based on calculated sedimentation rates. (For interpretation of the references to color in this figure legend, the reader is referred to the web version of this article.)
Climate and environmental information archived in Peoria Silt gastropods
Gastropod fossil assemblages within the Peoria Silt provide estimates of environmental conditions near the margin of the Laurentide Ice Sheet in Illinois. The modern habitats of late Pleistocene gastropod assemblages identified from the New Cottonwood School and Thomas Quarry sections suggests these areas were forested at the time of loess deposition (Baker, Reference Baker1939; Leonard and Frye, Reference Leonard and Frye1960; Nekola and Coles, Reference Pigati, McGeehin, Muhs and Bettis2010). For example, H. occulta relies on deep leaf litter in undisturbed woodlands (Lynum et al., Reference Lynum, Amundson, Kuchta, Little, Hyde and Perez2013). The occurrence of boreal to arctic snails, C. alticola and V. modesta, immediately above the Jules Geosol at New Cottonwood School is indicative of relatively colder environments. C. alticola was also noted above and below the Jules Geosol at the original Cottonwood School Section (Frye el al., Reference Frye, Leonard, Willman, Glass and Follmer1974). Today these cold climate species are found between the Great Lakes and Hudson Bay in the Canadian midcontinent (Nekola and Coles, Reference Pigati, McGeehin, Muhs and Bettis2010). More specifically, a semi-open boreal forest, such as found today north of Lake Superior, or a taiga environment, would provide both the temperature and vegetation typical for the gastropod assemblages observed in the Peoria Silt at New Cottonwood School and Thomas Quarry. Modern surveys in the Lake Superior region (Nekola, Reference Nekola and Coles2014) note a family-level biodiversity relatively similar to the Illinois Valley region loess fauna.
Other pollen and plant macrofossil studies imply a gradient from boreal conditions near St. Louis to tundra conditions in northeastern Illinois during the local LGM (Baker et al., Reference Baker, Rhodes, Schwert, Ashworth, Frest, Hallberg and Janssens1986; Schwert et al., Reference Simpkins1997; Curry and Yansa, Reference Curry and Yansa2004; Curry and Petras, Reference Curry and Petras2011). New Cottonwood School and Thomas Quarry were likely just southwest of a narrow periglacial band along the ice margin (Johnson, Reference Johnson1990). From a temporal standpoint, the climate shifted from boreal conditions to borderline tundra conditions ~28,000 to 24,000 cal yr BP in central Illinois (King, Reference King1979; Garry et al., Reference Garry, Schwert, Baker, Kemmis, Horton and Sullivan1990) as the Lake Michigan Lobe moved southward. This interpretation is supported by the paleoecological record from Biggsville, western Illinois (100 km north of study area), which indicates a shift from a closed conifer forest prior to the onset of Peoria Silt deposition, at ~31,000 cal yr BP, to a more open parkland during the time of Peoria Silt deposition (Baker et al., Reference Baker, Sullivan, Hallberg and Horton1989).
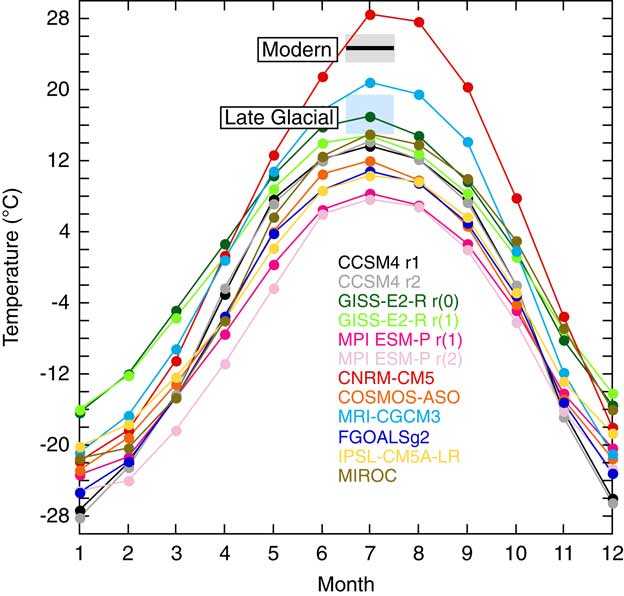
Gastropod-inferred paleotemperature, based on a modified MCR method that captures the coolest maximum and warmest minimum temperature (given the no-analog situation), implies mean July temperature ~6 to 10°C cooler than modern (15-19°C) during the late glacial (Figure 7) in the lower Illinois Valley region. This paleotemperature range overlaps independent temperature estimates from a fossiliferous lacustrine sequence in the St. Louis area, 80 km south. Here ostracode and beetle assemblages suggest the mean July temperature was 17–18°C and 16–19°C, respectively, 23,000–20,000 cal yr BP (Schwert et al., Reference Simpkins1997; Curry and Delorme, Reference Curry and Delorme2003). Pollen and plant macrofossil-derived LGM temperature estimates offer additional constraints on mid-continent summer temperature near the Laurentide ice margin. The Bartlein et al. (Reference Bartlein, Harrison, Brewer, Connor, Davis, Gajewski and Guiot2011) pollen-based dataset of mean LGM (~21,000 cal yr BP) temperature anomalies for the warmest month show LGM temperatures were 4.8±2.0°C cooler at the 2° × 2° grid nearest to our study area (39°N, 89°W). However, to the south, at 37°N, 91°W, the temperature anomaly is -23.5±1.2°C (Supplementary Fig. 4). Collectively, these data suggest warm season temperatures near the margin of the Laurentide ice sheet remain uncertain.
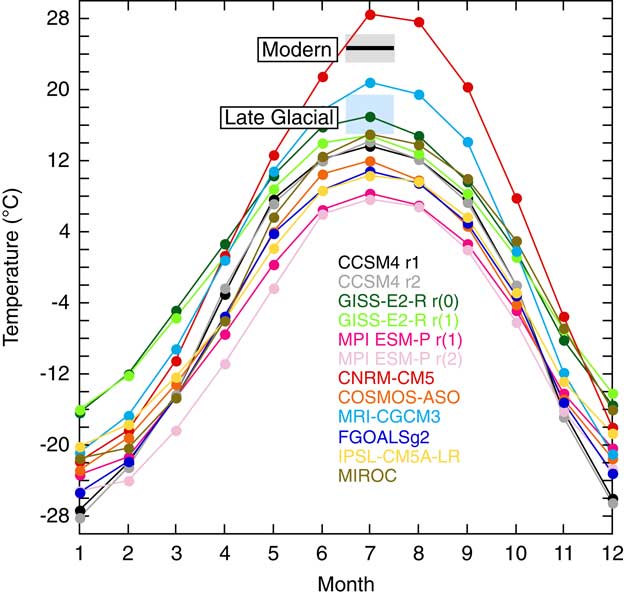
This uncertainty is also observed in simulated summer temperatures for the LGM. Figure 9 shows mean monthly surface air temperature climatologies for 40°N, 90°W in LGM simulations participating in the Paleoclimate Model Intercomparison Project 3 (Braconnot et al., Reference Braconnot, Harrison, Kageyama, Bartlein, Masson-Delmotte, Abe-Ouchi, Otto-Bliesner and Zhao2012). Gastropod-inferred temperature results agree best with July temperature in the Goddard Institute for Space Studies (GISS)-E2-R (0) ensemble member. However, there is a wide temperature range, especially for the summer months, across the simulations. In sum, late glacial, gastropod-inferred mean July temperatures do agree with the nearest pollen-based LGM warm month temperature reconstruction and are within the range of fossil-based temperature and vegetation interpretations for the region. Yet, the large range of reconstructed warm month temperatures in the study area, as well as in model simulations, highlights the need for more late glacial continental temperature reconstructions and rigorous data-model comparisons to reduce data uncertainty and understand potential model biases.
Mean surface air temperature climatology for 40°N, 90°W from PMIP3 LGM simulations. Black horizontal line and gray shading represents modern July temperature and 1σ, blue shading represents gastropod-inferred mean July temperature range. (For interpretation of the references to color in this figure legend, the reader is referred to the web version of this article.)
The δ18O and δ13C values of gastropods preserved in the Peoria Silt can provide additional constraints on past climate and environmental variability. Gastropod δ13C values are often interpreted with respect to diet, although such interpretations can be complicated by respiration and diffusion of CO2 and HCO3 from the body fluid of the snail (Balakrishnan and Yapp, Reference Balakrishnan and Yapp2004). We find that median δ13C values from the lower Peoria Silt, middle Peoria Silt (below Jules), Jules Geosol zone, and upper Peoria Silt are not significantly different (Supplementary Table 3). This indicates no interpretable changes in gastropod diet, reflecting, for example, the ratio of C3 to C4 plants in the environment, during the transition between lower to middle Peoria Silt or during the development of the Jules Geosol.
Temperature and the δ18O value of precipitation, through the δ18O of water consumed by terrestrial gastropods, are the main factors controlling the fractionation of oxygen isotopes during the precipitation of gastropod shell aragonite (Balakrishnan and Yapp, Reference Balakrishnan and Yapp2004). Median δ18O values from New Cottonwood School and Thomas Quarry are similar throughout the upper Peoria and middle Peoria Silt, including the Jules Geosol zone (Fig. 5). Significance testing (Supplementary Table 3) indicates that there is no difference between the δ18O distribution of each loess zone at New Cottonwood School. The only zone with significantly different δ18O distributions occurs at Thomas Quarry in the lower Peoria Silt. Here, δ18O values decrease more than 1.5‰ between 26,000 and 24,000 cal yr BP, approximating the timing of the Mississippi River diversion event (Fig. 4).
The local advance of the Lake Michigan Lobe caused the Mississippi River diversion at 24,400 cal ry BP (Curry, Reference Curry1998), and we hypothesize that the Lake Michigan Lobe advance also influenced the δ18O value of precipitation, manifested as a decrease in gastropod carbonate δ18O values. Carbonate δ18O decreases with increasing temperature (Epstein and Mayeda, Reference Epstein and Mayeda1953), so it is unlikely that this trend is a result of changing temperature, given the negative direction of the trend would imply warming, rather than cooling, as the Lake Michigan Lobe advanced. Rather, lower δ18O values in precipitation likely occurred as the southern advance of ice influenced the nature of regional summer precipitation. Several potential mechanisms may have caused lower δ18O values in summer precipitation. For example, colder atmospheric temperatures could have led to enhanced rainout and subsequent lower δ18O during summer storms (Dansgaard, Reference Dansgaard1964). Or, a change in moisture source, as observed seasonally today, may have led to lower precipitation δ18O values: in the Midwest, mixed Gulf of Mexico-Pacific moisture sources have lower δ18O values than moisture solely derived from the Gulf of Mexico (Simpkins, Reference Voelker, Stambaugh, Guyette, Feng, Grimley, Leavitt, Panyushkina, Grimm, Marsicek and Shuman1995). A high resolution LGM model simulation of summer climate at the Laurentide ice margin shows a strong thermal gradient anchoring the jet stream at the ice margin, which could direct lower δ18O Pacific moisture into the region (Bromwich et al., Reference Bromwich, Toracinta, Oglesby, Fastook and Hughes2005). Another possibility is that the nature of summer precipitation events differed during the late glacial. In one study of individual precipitation events in Iowa, localized convective storms, such as those that mainly occur in the summer months, produced higher precipitation δ18O values, whereas precipitation associated with frontal systems produced lower precipitation δ18O values (Simpkins, Reference Voelker, Stambaugh, Guyette, Feng, Grimley, Leavitt, Panyushkina, Grimm, Marsicek and Shuman1995). Simulated summer precipitation along the ice margin also indicates greater development of cyclonic storms during the LGM (Bromwich et al., Reference Bromwich, Toracinta, Oglesby, Fastook and Hughes2005). Given the strong temperature gradient in this region during summer months as the Lake Michigan Lobe advanced to its southernmost extent, more frontal-type cyclonic storms relative to more localized, convective-type precipitation events may have led to lower precipitation δ18O values, and hence gastropod shell δ18O values.
Relative humidity plays an additional important role in determining gastropod shell δ18O values. Gastropod body water is a function of the δ18O value of precipitation and dew, both assumed to be in equilibrium with vapor (Welp et al., Reference Willman and Frye2008), but modified by evaporation (Zaazur et al., Reference Zaarur, Olack and Affek2011). With lower relative humidity, enhanced evaporation leads to higher body water δ18O, and hence, higher shell δ18O (Yapp et al., Reference Zaarur, Olack and Affek1979; Zaazur et a., Reference Zaarur, Olack and Affek2011; Colonese et al., 2013). Gastropods are most active when relative humidity values are high (>85%), such as in mornings and evenings of rainy days (Balakrishnan and Yapp, Reference Balakrishnan and Yapp2004). A 1% decrease in relative humidity translates to a 0.4‰ increase in gastropod shell δ18O (Balakrishnan and Yapp, Reference Balakrishnan and Yapp2004), necessitating consideration of relative humidity and evaporation as drivers of shell δ18O variability. However, constraints on LGM relative humidity are limited. Voelker et al. (Reference Wang, Follmer and Liu2015) conclude LGM relative humidity was similar to today for the North American midcontinent. The cause of similar relative humidity at the LGM is hypothesized to be enhanced advection of Gulf of Mexico moisture into the midcontinent, due to the high-pressure system over the Laurentide Ice Sheet (Voelker et al., Reference Wang, Follmer and Liu2015). Such increased southerly moisture transport would not have only produced high relative humidity, but would also lead to increased precipitation along the ice margin due to the presence of a strong meridional temperature gradient (Bromwich et al., Reference Bromwich, Toracinta, Oglesby, Fastook and Hughes2005). Thus, an increase in relative humidity, along with an intensification or change in the nature of summer precipitation events may have jointly produced the lower gastropod δ18O values observed, rather than a shift to a more westerly (jet stream) precipitation source. Future comparisons of gastropod δ18O data with precipitation δ18O output from isotope-equipped GCMs simulating the LGM will provide greater insight into the drivers of observed changes in gastropod δ18O values. Additionally, obtaining more δ18O data across geographic gradients will also be useful in order to interpret large-scale changes in past atmospheric circulation (Kehrwald et al., Reference Kehrwald, McCoy, Thibeault, Burns and Oches2010).
Drivers of Jules Geosol development
The Peoria Silt in the Illinois Valley region was deposited in at least two rapid pulses with an intervening period of slow deposition and weak soil formation, manifested as the Jules Geosol. Decreased accumulation rates from 23,700±300 and 22,000±200 cal yr BP occurred during the Putnam Phase (Hansel and Johnson, Reference Hansel and Johnson1996; Caron and Curry, Reference Caron and Curry2016), a period of initial ice margin retreat and restabilization following the southernmost Lake Michigan Lobe extent (Fig. 8). Several mechanisms could possibly explain reduced loess accumulation rates at this time, including (1) reduced wind intensity, (2) changes in valley hydrology, (3) changes in vegetation cover, and (4) reduced glacial sediment supply.
Variability in wind intensity or gustiness, affected by ice margin fluctuations and altered meridional temperature gradients may have led to variability in loess deposition rates and an increase in particle size during gustier periods (McGee et al., Reference McGee, Broecker and Winckler2010; Muhs et al., Reference Muhs, Bettis, Roberts, Harlan, Paces and Reynolds2013). At the Thomas Quarry and New Cottonwood School sections, particle size decreases in the Jules Geosol as the Lake Michigan Lobe ice retreats. However, an increase in grain size is not apparent near the lower-middle Peoria Silt contact (below the Jules Geosol), as glaciers approached their maximal southern extent (Fig. 4). Furthermore, at New Cottonwood School, grain size is similar above and below the Jules Geosol, although the ice margin receded ~100 km from the Shelbyville Moraine to the Marseilles Moraine (Fig. 1). Strong evidence for the gustiness mechanism in driving variability in loess accumulation is thus lacking at our study sites.
Changes in valley hydrology may also affect dustiness, as observed in a modern Alaskan glacial meltwater valley (Crusius et al., Reference Crusius, Schroth, Gasso, Moy, Levy and Gatica2011). Here, dust deflation typically occurs over a series of days in the fall or spring, when valley sediments are not flooded with summer glacial meltwaters nor frozen by winter temperatures. It is unclear to what extent hydrologic controls affected silt deflation from the Illinois Valley, but it is conceivable that extended summer melt seasons during a retreat of the Lake Michigan Lobe ice margin (Putnam Phase) may have limited silt deflation and slowed loess accumulation.
Upland vegetation cover affects dust trapping and thus loess accumulation on soil surfaces. In periglacial areas with open landscapes, rates of loess deposition may be affected by landscape changes from open tundra to closed boreal vegetation (Muhs et al., Reference Muhs, Ager, Bettis, McGeehin, Been, Begét, Pavich, Stafford and De Anne2003). However, fossil gastropod assemblages and carbon isotope ratios from New Cottonwood School and Thomas Quarry do not provide evidence of changing ecological conditions; a continuously forested landscape is indicated at our study sites.
A reduction in glacial sediment supplied by the Lake Michigan Lobe to the Illinois Valley was originally postulated as the cause of Jules Geosol development (Frye et al., Reference Frye, Leonard, Willman, Glass and Follmer1974). In the model of Frye et al. (Reference Frye, Leonard, Willman, Glass and Follmer1974), meltwater sediment was trapped in a proglacial lake as ice retreated into Lake Michigan during the time of Jules Geosol development. Recent improvements in the Lake Michigan Lobe chronology and the older age for the Jules presented here do not support this hypothesis (Fig. 8). A more likely scenario is that glacial sediment production during the Shelby Phase advance to the terminal moraine was reduced during the ice margin retreat or stagnation of the Putnam Phase. Sediment supply and loess accumulation rates were then renewed during the Livingston Phase as the Lake Michigan Lobe re-advanced and formed the ~15 km wide Marseilles Morainic System (Hansel and Johnson, Reference Hansel and Johnson1996; Curry and Petras, Reference Curry and Petras2011). However, high rates of glacial sediment production may relate to periods of glacial advance or glacial margin recession (Leonard, Reference Leonard1997). For example, periods of higher loess accumulation rates could be explained by rapid advance of the Lake Michigan Lobe to its maximal limit (Caron and Curry, Reference Caron and Curry2016), but a modern study in Iceland has also noted enhanced dust storms related to increased proglacial sediment fluxes during the initial years or decades of glacial retreat (Prospero et al., Reference Rech, Pigati, Lehmann, McGimpsey, Grimley and Nekola2012).
Meltwater sediment supply to the Illinois River Valley might have also been temporarily disrupted by a (1) divergence of Illinois Valley meltwaters to other pathways, (2) a frozen glacial bed, or (3) morainal damming of proglacial meltwaters. In the first possibility, following the advance of the Lake Michigan Lobe to the Shelbyville and Bloomington morainic belts, glacial meltwater drainage may have been temporarily diverted. Following maximum ice extent and diversion of the Mississippi River, the more northerly Princeton Sublobe of the Lake Michigan Lobe (Fig. 1) may have drained meltwaters westward through the Green River Lowlands to the newly formed Mississippi River Valley (Curry, Reference Curry1998). Concurrently, the more southerly Decatur Sublobe likely temporarily drained through the Kaskaskia River valley (Grimley and Phillips, Reference Grimley and Phillips2015), leaving only the Peoria Sublobe to drain meltwaters into the Illinois Valley. Reduced outwash sedimentation from this smaller glacial drainage area could have led to reduced loess deposition. A renewed acceleration in sedimentation may have ensued, post-Jules Geosol development, once the ice margin receded far enough to the northeast such that the Kaskaskia and Green River Lowland outlets could not be utilized and the Illinois Valley once again became the primary Lake Michigan Lobe drainage outlet. High-resolution dating of Mississippi Valley loess, south of the Green River Lowlands, could test this hypothesis. The second possibility of reduced glacial meltwater, and thus loess deposition, by a temporarily frozen bed glacier is unlikely because the Lake Michigan Lobe was most likely a wet-based temperate ice lobe (Johnson and Hansel, Reference Johnson and Hansel1999). A third possibility is that formation of the Shelbyville-Bloomington morainic system by the Lake Michigan Lobe near Peoria, Illinois, blocked meltwater from entering the Illinois Valley. This scenario is also unlikely as significant lake deposits have not been observed or mapped on uplands inside the Shelbyville Moraine (McKay et al., Reference McKay, Berg, Stumpf and Weibel2010). Large outwash plains immediately north of New Cottonwood School also provided a drainage network to the Illinois Valley that would have by-passed any dam that formed within the valley (Hansel and Johnson, Reference Hansel and Johnson1996).
Given the above discussion, it is probable that reduced loess deposition from 23,700±300 to 22,000±200 cal yr BP, during which the Jules Geosol formed, was a result of a decrease in glacial sediment supplied to the Illinois River Valley. Reduced sediment supply may have been a response to changing glacial processes (i.e., from a surging advance to stagnancy-recession to renewed advance) and/or a temporary diversion of significant meltwater drainage. Improved dating of outwash and loess along the Mississippi Valley in western Illinois will be required to adequately test these hypotheses.
CONCLUSIONS
Peoria Silt deposition along the Illinois Valley occurred episodically between 28,500 and 18,800–16,000 cal yr BP. This new age model of Peoria Silt deposition has been independently verified by dating of a mineralogical shift that reflects the Mississippi River diversion at 24,400 cal yr BP (Curry, Reference Curry1998). The improved chronology reveals that Illinois Valley-sourced Peoria loess deposition coincided with the presence of the Lake Michigan Lobe in northeastern Illinois (Fig. 8). Our new age models for Peoria loess deposition are similar in range to other recently determined chronologies in the Central Lowlands (e.g., Muhs et al., Reference Muhs, Bettis, Roberts, Harlan, Paces and Reynolds2013). Yet, the details of millennial variability in loess accumulation rates likely differ with regional glacial, valley hydrology, and climatic histories. A period of slower loess deposition in the Illinois Valley region occurred between 23,700±300 and 22,000±200 cal yr BP, represented by the Jules Geosol. This period of lower loess accumulation rate, coincident with the Putnam Phase, a period of ice retreat and subsequent stabilization, is likely related to this ice margin retreat, or an associated temporary diversion of Lake Michigan Lobe glacial meltwater.
Geochemical data (δ18O, δ13C) and gastropod assemblages do not indicate detectable climatic or ecological changes associated with Jules Geosol development, although poor fossil preservation within this zone limits our inferences. Terrestrial gastropod assemblages indicate mean July temperature 6 to 10°C cooler during the local LGM in comparison to modern. A 1.5‰ decrease in gastropod carbonate δ18O values occurred from 26,000 to 24,000 cal yr BP, when the Lake Michigan Lobe rapidly advanced into the region from the Lake Michigan Basin to its maximum southwestern extent at present-day Peoria, Illinois. Lower δ18O values as the Lake Michigan Lobe approached can be explained by (1) enhanced rainout due to colder summer temperatures adjacent to the Lake Michigan Lobe; (2) late glacial summer storms that were more frontal in nature; (3) a greater contribution of remote, distilled Pacific moisture to late glacial summer precipitation due to anchoring of the jet stream over the ice margin (Bromwich, Reference Bromwich, Toracinta, Oglesby, Fastook and Hughes2005); or (4) an increase in relative humidity. The coincident shift in δ18O values, Lake Michigan Lobe position, and glacial sediment sources suggests a tight coupling between regional ice sheet dynamics, loess deposition, and climate in this region during the late glacial period. Variable rates of loess accumulation superimposed on this background climate state of the local LGM suggest fossiliferous loess deposits hold important high-temporal resolution records that can determine the interconnectivity, or lack thereof, of regional ice sheet dynamics, global and local climate change, paleoecology, and sedimentary processes.
Acknowledgments
This work is funded by NSF-GLD 16-37481 to JLC, DAG, and WRG and the Prairie Research Institute Matching Research Awards Program to BBC and DAG. We are grateful to the UIUC Department of Geology for additional funding. We appreciate permission from Bluff Springs Township to drill a borehole in the New Cottonwood School area and from Bruce Callender (Callender Construction Company Inc.) to access Thomas Quarry. Field assistance from Hong Wang, Miao Xiaodong, and Bradford Bates is also appreciated. All data will be archived on the NOAA paleoclimate database and Neotoma database.
Supplementary material
For supplementary material/s referred to in this article, please visit https:/doi.org/10.1017/qua.2017.66