
1. Introduction
Self-excitation of large amplitude periodic pressure oscillations in combustion chambers is a serious cause of concern in rockets and gas turbine engines used in propulsion systems and power generation industries. The phenomenon, known as thermoacoustic instability, is highly undesirable as it leads to severe damage of engine components and even mission failures (Juniper & Sujith Reference Juniper and Sujith2018). Thermoacoustic instability occurs due to the positive coupling between the acoustic field inside the combustion chamber and the unsteady flame dynamics (Rayleigh Reference Rayleigh1878). When the heat release rate oscillations are in phase with the acoustic pressure oscillations, energy is added to the acoustic field. When this acoustic driving provided by combustion overcomes the losses in the system, the combustor dynamics transitions to thermoacoustic instability (Putnam Reference Putnam1971). Even after decades of research, engineers are still trying to obtain an improved understanding of the mechanism behind the emergence of these large amplitude pressure oscillations, their prediction and control.
Researchers have used tools from dynamical systems theory to characterize the transition from a state of stable operation to thermoacoustic instability. Conventionally, this transition was considered as a transition from a fixed point to an oscillatory state (Lieuwen Reference Lieuwen2002; Ananthkrishnan, Deo & Culick Reference Ananthkrishnan, Deo and Culick2005). Some studies modelled the temporal dynamics during the state of stable operation as stochastic fluctuations (Clavin, Kim & Williams Reference Clavin, Kim and Williams1994; Lieuwen & Banaszuk Reference Lieuwen and Banaszuk2005; Noiray & Schuermans Reference Noiray and Schuermans2013). Using tools from nonlinear time series analysis, Nair et al. (Reference Nair, Thampi, Karuppusamy, Gopalan and Sujith2013) and Tony et al. (Reference Tony, Gopalakrishnan, Sreelekha and Sujith2015), observed that the state of stable operation in a turbulent thermoacoustic system is deterministic chaos, which is characterized by low amplitude aperiodic oscillations (also known in the community as combustion noise). More importantly, many studies have recently shown that the transition from a state of stable operation to thermoacoustic instability occurs via an intermediate dynamical state known as intermittency (Gotoda et al. Reference Gotoda, Shinoda, Kobayashi, Okuno and Tachibana2014; Nair, Thampi & Sujith Reference Nair, Thampi and Sujith2014; Pawar et al. Reference Pawar, Vishnu, Vadivukkarasan, Panchagnula and Sujith2016; Sampath & Chakravarthy Reference Sampath and Chakravarthy2016; Kheirkhah et al. Reference Kheirkhah, Cirtwill, Saini, Venkatesan and Steinberg2017; Ebi et al. Reference Ebi, Denisov, Bonciolini, Boujo and Noiray2018; Manikandan & Sujith Reference Manikandan and Sujith2020). Intermittency en route to thermoacoustic instability is characterized by bursts of periodic oscillations distributed amongst epochs of low amplitude aperiodic oscillations in an apparently random manner.
Most of the early studies on spatiotemporal dynamics had focussed on the periodic formation of large-scale vortical structures during thermoacoustic instability (Rogers & Marble Reference Rogers and Marble1956; Smith & Zukoski Reference Smith and Zukoski1985; Poinsot et al. Reference Poinsot, Trouve, Veynante, Candel and Esposito1987; Schadow & Gutmark Reference Schadow and Gutmark1992; Coats Reference Coats1996; Renard et al. Reference Renard, Thevenin, Rolon and Candel2000; Shanbhogue Reference Shanbhogue2008; Sampath, Mathur & Chakravarthy Reference Sampath, Mathur and Chakravarthy2016). Only a few researchers have investigated the spatiotemporal dynamics during the intermittency route to thermoacoustic instability. Unni & Sujith (Reference Unni and Sujith2017) discerned the flame dynamics during the regimes of combustion noise, intermittency and thermoacoustic instability. Recent studies have shown that intermittency is characterized by the simultaneous presence of coherent and incoherent regions of acoustic power sources (Kheirkhah et al. Reference Kheirkhah, Cirtwill, Saini, Venkatesan and Steinberg2017; Mondal, Unni & Sujith Reference Mondal, Unni and Sujith2017). George et al. (Reference George, Unni, Raghunathan and Sujith2018) analysed the size of the vortices during the different states of combustor operation using a vortex detection algorithm (Varun, Balasubramanian & Sujith Reference Varun, Balasubramanian and Sujith2008) performed on the two-component PIV fields in the same experimental set-up used in the present study. They observed that the size of the vortices are the smallest during combustion noise and the largest during thermoacoustic instability. Also, the size of the vortices during the periodic epoch of intermittency is larger compared with the vortices observed during the aperiodic epoch of intermittency. They illustrated that the large-scale vortices observed during the periodic epoch of intermittency and thermoacoustic instability are a result of the phenomenon of collective interaction of small-scale vortices (Ho & Nosseir Reference Ho and Nosseir1981). Recently, from the Mie-scattering images obtained from the same experimental set-up used in the present study, Raghunathan et al. (Reference Raghunathan, George, Unni, Midhun, Reeja and Sujith2020) classified the size of the vortices as small-scale, ( ${\approx }0.08$ times the step size), medium-scale (
 ${\approx }0.24$ times the step size) and large-scale (
 ${\approx }0.6$ times the step size) during combustion noise, intermittency and thermoacoustic instability, respectively.
Recently, the investigation of spatiotemporal dynamics of diverse systems such as the brain, the internet, the climate, the society, to name a few, using complex networks has gained traction (Strogatz Reference Strogatz2001; Barabási Reference Barabási2003; Newman Reference Newman2010; Barthélemy Reference Barthélemy2011). In the twenty-first century, network theory, built upon graph theory and statistical physics, has emerged as a promising field for the investigation of such diverse systems (Barabási Reference Barabási2012). In network theory, the elements of a system are considered as nodes and their interaction as the links between them. Currently, the state-of-the-art research is to try to relate the structure of the network topology with the underlying dynamics of the system (Boccaletti et al. Reference Boccaletti, Latora, Moreno, Chavez and Hwang2006).
Complex networks have found application in different realms of fluid mechanics as well (Tsonis & Roebber Reference Tsonis and Roebber2004; Donges et al. Reference Donges, Zou, Marwan and Kurths2009; Gao & Jin Reference Gao and Jin2009; Malik et al. Reference Malik, Bookhagen, Marwan and Kurths2012; Boers et al. Reference Boers, Bookhagen, Barbosa, Marwan, Kurths and Marengo2014; Charakopoulos et al. Reference Charakopoulos, Karakasidis, Papanicolaou and Liakopoulos2014; Molkenthin et al. Reference Molkenthin, Rehfeld, Marwan and Kurths2014; Tupikina et al. Reference Tupikina, Rehfeld, Molkenthin, Stolbova, Marwan and Kurths2018; Scarsoglio, Iacobello & Ridolfi Reference Scarsoglio, Iacobello and Ridolfi2016; Singh et al. Reference Singh, Belur Vishwanath, Swetaprovo and Sujith2017; Iacobello et al. Reference Iacobello, Scarsoglio, Kuerten and Ridolfi2019; Iacobello, Ridolfi & Scarsoglio Reference Iacobello, Ridolfi and Scarsoglio2020). Complex networks have been successfully used in the area of thermoacoustic instability. Murugesan & Sujith (Reference Murugesan and Sujith2015) used the visibility algorithm (Lacasa et al. Reference Lacasa, Luque, Ballesteros, Luque and Nuno2008) to construct networks from the time series of acoustic pressure. They showed that the network corresponding to the state of combustion noise is scale-free. At the onset of thermoacoustic instability, the topology of the network changes to that of a regular network. Okuno, Small & Gotoda (Reference Okuno, Small and Gotoda2015) used cycle networks and phase space networks to show the high dimensional nature of thermoacoustic instability. Using recurrence network analysis, Godavarthi et al. (Reference Godavarthi, Unni, Gopalakrishnan and Sujith2017) and Gotoda et al. (Reference Gotoda, Kinugawa, Tsujimoto, Domen and Okuno2017) showed that the topology of the recurrence network retains the structure of the reconstructed phase space for the different states of combustor operation. Godavarthi et al. (Reference Godavarthi, Pawar, Unni, Sujith, Marwan and Kurths2018) used measures from recurrence networks to detect the synchronization transitions in a turbulent thermoacoustic system. Using recurrence plots and recurrence networks, Kasthuri et al. (Reference Kasthuri, Pavithran, Krishnan, Pawar, Sujith, Gejji, Anderson, Marwan and Kurths2020) studied the recurrence properties of the slow–fast dynamics in the heat release rate oscillations of a bluff body stabilized combustor and the acoustic pressure oscillations in a model liquid rocket combustor during the occurrence of thermoacoustic instability. Researchers have also been helped by network theory to devise precursors for an impending thermoacoustic instability (Murugesan & Sujith Reference Murugesan and Sujith2016; Murayama et al. Reference Murayama, Kinugawa, Tokuda and Gotoda2018; Kobayashi et al. Reference Kobayashi, Murayama, Hachijo and Gotoda2019).
Recently, we have used spatial network analysis to investigate the spatiotemporal dynamics during the transition to thermoacoustic instability (Krishnan Reference Krishnan2019). Unni et al. (Reference Unni, Krishnan, Manikandan, George, Sujith, Marwan and Kurths2018) unmasked the regions that control the spatiotemporal dynamics during the different dynamical regimes of combustor operation using spatial correlation network analysis. Krishnan et al. (Reference Krishnan, Manikandan, Midhun, Reeja, Unni, Sujith, Marwan and Kurths2019a) used a weighted correlation network analysis to identify an optimal location in the flow field to implement a passive control strategy to mitigate thermoacoustic instability. Recently, we investigated the spatiotemporal dynamics of acoustic power sources by constructing time-varying spatial networks during the different dynamical states of combustor operation (Krishnan et al. Reference Krishnan, Sujith, Marwan and Kurths2019b). We uncovered that as the turbulent combustor transitions from combustion noise to thermoacoustic instability via intermittency, small fragments of acoustic power sources, observed during combustion noise, nucleate, coalesce and grow in size to form large clusters at the onset of thermoacoustic instability.
The purpose of the present study is to characterize the spatiotemporal dynamics of the flow field during the transition from a state of stable operation to thermoacoustic instability via intermittency using complex network theory. We follow the work of Taira, Nair & Brunton (Reference Taira, Nair and Brunton2016) and construct time-varying weighted turbulent networks. Recently, Murayama et al. (Reference Murayama, Kinugawa, Tokuda and Gotoda2018), using the approach developed by Taira et al. (Reference Taira, Nair and Brunton2016), showed that the vorticity interaction during thermoacoustic instability in a swirl stabilized turbulent combustor is weighted scale-free, with the vortical structures at the injector rim acting as the hubs. However, they did not characterize the vorticity interaction during the states of combustion noise and intermittency. In the present study, we characterize the vorticity interactions, along with the local acoustic power fields, during combustion noise, intermittency and thermoacoustic instability in a bluff body stabilized turbulent combustor. Based on the understanding of the network topology during thermoacoustic instability, we inject secondary air jets at appropriate locations to suppress the large amplitude pressure oscillations effectively. The rest of the paper is organized as follows. The details of the experimental set-up and the diagnostic techniques used are provided in § 2. In § 3, we discuss the methodology of network construction. This is followed by results and discussion in § 4. Finally, in § 5, we summarize the major findings.
2. Experimental set-up
We perform experiments in a bluff body stabilized combustor with a rectangular cross-section ( $1100\times 900\times 900\ \textrm {mm}^3$). The experimental set-up is made up of a settling chamber, a burner section and a rectangular duct (figure 1). Air enters the experimental set-up through the settling chamber. The air and the fuel (liquefied petroleum gas) mixes in the burner before entering the combustion chamber. We spark ignite the partially premixed air fuel mixture at the dump plane using a 11 kV ignition transformer. We use a circular disk of thickness 10 mm and diameter 47 mm as the flame holding device. Further details of the experimental set-up can be found in Nair et al. (Reference Nair, Thampi, Karuppusamy, Gopalan and Sujith2013).
Schematic diagram of the experimental set-up (design adapted from Komarek & Polifke (Reference Komarek and Polifke2010)). We simultaneously acquire the acoustic pressure measurement, high-speed flame images and high-speed PIV for the current study. (Reproduced with permission from Krishnan et al. (Reference Krishnan, Sujith, Marwan and Kurths2019b)).

In the experiments, we maintain the fuel flow rate ( $\dot {m}_f=30 \pm 0.44$ standard litre per minute (SLPM)) constant and vary the air flow rate (
 $480 \pm 7.84\leqslant \dot {m}_a\leqslant 780 \pm 10.24$ SLPM). In the current study, the control parameter is the equivalence ratio (
 $\phi ={({\dot m_f}/{\dot m_a})_{actual}}/{({\dot m_f}/{\dot m_a})_{stochiometry}}$), which varies from 0.97 to 0.57. The maximum uncertainty in the calculation of
 $\phi$ is
 $\pm 0.02$. The Reynolds number (calculated based on the flow conditions of the main air at the inlet of the combustor) varies between
 $1.93\times 10^4\leqslant Re\leqslant 3.13\times 10^4$. The maximum uncertainty associated with the estimation of the Reynolds number is
 ${\pm }400$. We inject steady secondary air jets at the dump plane as a passive control strategy to suppress thermoacoustic oscillations. The pressure and temperature of the secondary air is the same as that of the main air that enters the combustion chamber. The details of the location of the injection ports are discussed in § 4. We measure the fuel and air flow rates using mass flow controllers (Alicat Scientific, MCR Series, 100 SLPM model for fuel flow, 4000 SLPM for the main air flow and 100 SLPM model for the secondary air jets; uncertainty is
 $\pm (0.8\,\%\ \text {of reading} + 0.2\,\%\ \text {of full scale})$).
The acoustic pressure ( $p^\prime$) is measured using a piezoelectric pressure transducer (PCB 103B02, with a sensitivity of
 $223.4\ \textrm {mV}\ \textrm {kPa}^{-1}$ and an uncertainty of
 ${\pm }0.15$ Pa) mounted 40 mm downstream of the backward facing step. We acquire the pressure measurement for 3 s with a sampling frequency of 10 kHz and obtain the velocity field from high-speed PIV. We perform high-speed PIV to analyse the flow field both upstream and downstream of the bluff body. The region of interest of high-speed PIV spans a length of 59 mm and a width of 33 mm, covering both upstream and downstream of the bluff body. We seed the flow with
 $\textrm {TiO}_2$ particles of approximately
 $1\ \mu \textrm {m}$ diameter. We use a single cavity double pulsed Nd:YLF laser (with 527 nm and a pulse duration of 10 ns) to illuminate the flow from the top wall of the combustion chamber. The laser beam is directed towards the experimental set-up using a set of right-angle prisms and a pair of convex lenses of focal lengths 500 mm and 50 mm, respectively. The laser beam is then expanded into a laser sheet of 2 mm thickness using 600 mm and
 $-16\ \textrm {mm}$ cylindrical lenses. The laser sheet enters the test section through a narrow slit (
 $400\ \textrm {mm}\ \text {length} \times 5 \ \textrm {mm}\ \textrm {width}$) made up of quartz, located on top of the combustion chamber. We capture the light scattered from the seeding particles through the sidewall of the combustion chamber (made up of quartz windows) with a high-speed CMOS camera (Photron FASTCAM SA4) synchronized with the laser. We acquire the Mie-scattered image pairs at a sampling frequency of 1000 Hz for approximately 1.5 s. Another high-speed CMOS camera (Phantom-v 12.1) is used to capture the OH* chemiluminescence from the flame. The OH* chemiluminescence represents the local heat release rate (
 $\dot {q}(x,y,t)$) as the intensity of light emitted by OH radicals is proportional to the chemical reaction rate (Hardalupas & Orain Reference Hardalupas and Orain2004). We record the flame images at a sampling frequency of 2 kHz, with an exposure time of
 $500\ \mu \textrm {s}$ for 2 s. We perform simultaneous acoustic pressure, high-speed PIV and high-speed chemiluminescence measurements to investigate the flow and flame dynamics during the occurrence of combustion noise, intermittency and thermoacoustic instability. Further, we perform the above mentioned measurements during the state when thermoacoustic oscillations are suppressed with secondary air-jet injection. A detailed description of the high-speed chemiluminescence imaging and the preprocessing and post-processing algorithms used in the analysis of PIV, along with the discussion on velocity uncertainties are given in George et al. (Reference George, Unni, Raghunathan and Sujith2018).
3. Network construction
In most of the studies using complex networks, the systems were investigated via unweighted network analysis. In weighted networks, the links carry a ‘weight’, usually a real number, which indicates the strength of the interaction between a pair of nodes of the network (Boccaletti et al. Reference Boccaletti, Latora, Moreno, Chavez and Hwang2006). For example, in a research collaboration network, two people are connected if they have coauthored a journal paper. If we assign the total number of papers coauthored between two researchers as the weight of the link between them, then, we shall know the depth of the collaboration between them. This crucial information is lost in an unweighted network.
In a recent pioneering study, Taira et al. (Reference Taira, Nair and Brunton2016) used weighted network analysis to characterize the vorticity interaction in a two-dimensional decaying isotropic turbulent flow field obtained from direct numerical simulation. The nodes of the network were fluid elements and the weight of the link was the average velocity induced by these fluid elements upon one another, calculated using the Biot–Savart law (Tietjens & Prandtl Reference Tietjens and Prandtl1957). The strength of the interaction is captured by a network measure called the strength of a node, which is defined as the sum of weights of all the links incident on the node. From the probability distribution of the strength of the nodes, they found that the resulting turbulent network is weighted scale-free, i.e. there is no particular scale characterizing the entire network unlike in the case of a random network, which is characterized by the mean strength of a node. In a weighted scale-free turbulent network, there are many vortical elements, which induce low velocities in the flow field. However, there are a few vortical elements that induce very high velocity. These vortical elements are called the hubs of the network.
In the analysis of high-speed PIV, we divide the turbulent reactive flow field into Cartesian cells and obtain the value of velocity ( $u$) and vorticity (
 $\omega$) at each of these cells from the analysis of PIV (Raffel et al. Reference Raffel, Willert, Scarano, Kähler, Wereley and Kompenhans2007). The velocity induced by the vorticity field is given by the Biot–Savart law. The magnitude of the velocity induced by a fluid element in cell
 $i$ on another fluid element in cell
 $j$ is given by
 \begin{equation} u_{i\rightarrow j}=\frac{|{\gamma_i}|}{2{\rm \pi}|x_i-x_j|}, \end{equation}
where  $\gamma _i = \omega (x_i)\Delta x \Delta y$ is the circulation of the fluid element in cell
 $i$,
 $\Delta x$ and
 $\Delta y$ are the length and the width of the cell, respectively, and
 $|x_i-x_j|$ is the Euclidean distance between the two cells
 $i$ and
 $j$. The sum of the induced velocities from all the fluid elements gives the advection velocity of the fluid element in cell
 $j$.
To quantify the vortical interactions occurring in the turbulent combustor, we perform a time-varying weighted spatial network analysis. For a given dynamical state of combustor operation, we construct weighted spatial networks at each instant of time. The Cartesian cells are the nodes of the network, while the links of the network represent the vortical interactions among the fluid elements at a given instant of time. The weight of the link quantifies the strength of these interactions. Here, we consider the mean of the induced velocities between two fluid elements  $i$ and
 $j$ as the weight of the link between them. Since we are considering only the magnitude of the induced velocities, the resultant network is undirected. The details of network connectivity are mathematically given in the form of a square matrix called the adjacency matrix. An element of the adjacency matrix (
 $A_{ij}$) corresponds to the weight of the link between the nodes
 $i$ and
 $j$. Hence, the adjacency matrix is given as follows:
 \begin{equation} A_{ij}=\left\{ \begin{array}{@{}ll} \tfrac{1}{2}(u_{i\rightarrow j}+u_{j\rightarrow i}) & \textrm{if}\ i \neq j ,\\ 0 & \textrm{if}\ i=j . \end{array}\right. \end{equation}
The diagonal elements of the adjacency matrix are zero as the velocity induced by a fluid element upon itself is zero. Since each fluid element is connected to all other elements, the vorticity network is a complete graph. The strength of interaction among the nodes is captured by the network measure called the node strength ( $s$), which is given by
 \begin{equation} s_i=\sum_{j=1}^{N}A_{ij}, \end{equation}
where,  $N$ is the total number of nodes in the network (Boccaletti et al. Reference Boccaletti, Latora, Moreno, Chavez and Hwang2006). The number of nodes (
 $N$) during the states of combustion noise, intermittency and thermoacoustic instability are 3843, 3843 and 3720, respectively (refer to George et al. (Reference George, Unni, Raghunathan and Sujith2018) for further details on the preprocessing and post-processing algorithms used in the analysis of PIV).
If the magnitude of the vorticity at the spatial location  $i$ is higher than that at the spatial location
 $j$, the outgoing-induced velocity (
 $u_{i\rightarrow j}$) contributes the maximum to the node strength (
 $s_i$) compared with the incoming-induced velocity (
 $u_{j\rightarrow i}$). This has been explicitly shown before (refer to figure 2 in Taira et al. (Reference Taira, Nair and Brunton2016)). Hence, due to the flow physics, we can say that the higher the value of
 $s_i$, the higher the velocity induced by the fluid element at node
 $i$ on all other fluid elements.
The topology of the weighted network is understood from the histogram of the node strength distribution ( $P(s)$ versus
 $s$, where
 $P(s)$ is the probability of a node having a given node strength
 $s$). Traditionally, the networks that have a power law relationship between
 $P(s)$ and
 $s$ (
 $P(s)=s^{-\gamma }$ with
 $2\leqslant \gamma \leqslant 3$) are called scale-free networks (Barrat, Barthélemy & Vespignani Reference Barrat, Barthélemy and Vespignani2004a,Reference Barrat, Barthélemy and Vespignanib; Barthélemy et al. Reference Barthélemy, Barrat, Pastor-Satorras and Vespignani2005). Scale-free networks have a highly inhomogeneous weight distribution. While most of the nodes have only a small node strength, there are a few nodes (known as hubs), which have enormous node strength. Due to the coexistence of nodes with widely different node strengths, these networks lack a characteristic ‘scale’ and hence are known as scale-free networks. Next, using the node strength distribution, we shall quantify the vorticity interactions during the different dynamical states of combustor operation.
4. Results and discussion
Even though the geometry of the combustor is three-dimensional, the flow field is predominantly two-dimensional due to the symmetric bluff body and the uniform cross-section. Hence, the two-dimensional velocity field satisfactorily explains the spatiotemporal dynamics in the present experimental set-up. In this section, we examine the spatiotemporal evolution of the vorticity dynamics during the dynamical states of combustion noise, intermittency and thermoacoustic instability. To that end, we construct time-varying weighted turbulent networks at each of the time instants during these different dynamical states of combustor operation. Additionally, we qualitatively compare the flow field with the corresponding local acoustic power generated in the combustion chamber ( $p^\prime \dot {q}^\prime$ (McManus, Poinsot & Candel Reference McManus, Poinsot and Candel1993)) due to the interaction of the acoustic field and the unsteady flame. We multiply the acoustic pressure (
 $p^\prime (t)$) with the local heat release rate fluctuations (
 $\dot {q}^\prime (x,y,t)=\dot {q} (x,y,t)- \bar {\dot {q}} (x,y)$) to obtain the local acoustic power (
 $p^\prime \dot {q}^\prime$) fields. First, we examine the vorticity interaction during the stable state of combustor operation.
4.1. Turbulent networks during combustion noise
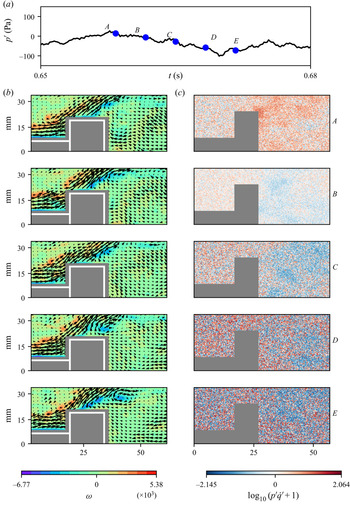
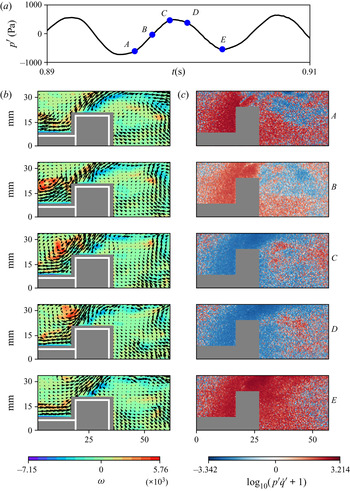
Low amplitude aperiodic acoustic pressure oscillations characterize the state of combustion noise. In figure 2, we examine the velocity field (see panel (b)) and the local acoustic power ( $p^\prime \dot q^\prime$) field (see panel ((c)) at some arbitrary time instances (
 $A$–
 $E$) marked on (see panel (a)) the time series of acoustic pressure fluctuations. The black arrows in panel (b) represent the velocity vectors and the contour plot represents the vorticity (
 $\omega$) field. The white colour rectangles represent the outline of the bluff body shaft and the bluff body. The grey colour rectangles represent the mask used in the analysis of PIV. The colour bar at the bottom left side represents the range of
 $\omega$. Positive values of
 $\omega$ correspond to anticlockwise vorticity and negative values correspond to clockwise vorticity, respectively. High values of positive and negative vorticity correspond to the small discrete vortices present along the outer and inner shear layers, respectively. The colour bar at the bottom right-hand side represents the range of
 $p^\prime \dot {q}^\prime$. We have represented the magnitude of the local acoustic power in the logarithmic scale (
 $\pm \log _{10}(|p^\prime \dot {q}^\prime |+1)$). Red colour regions represent acoustic power sources (
 $p^\prime \dot {q}^\prime >0$) and blue colour regions represent the acoustic power sinks (
 $p^\prime \dot {q}^\prime \leqslant 0$). The grainy pattern in the
 $p^\prime \dot {q}^\prime$ field reveals that acoustic power production happens in an incoherent manner during the occurrence of combustion noise. We can infer that the presence of many small-scale vortices in the flow field would induce a disorganized and chaotic flow dynamics leading to an incoherent acoustic power production.
(b) The local velocity and (c) the local acoustic power fields (in the logarithmic scale) at time instants  $A, B, C, D$ and
 $E$ marked on the time series of acoustic pressure during combustion noise (
 $\phi =0.97$) in (a). The contour plots in panel (b) are the corresponding vorticity (
 $\omega$) fields. We observe small-scale vortices in the outer shear layer as well as in the inner shear layers. The local acoustic power production happens in an incoherent manner.

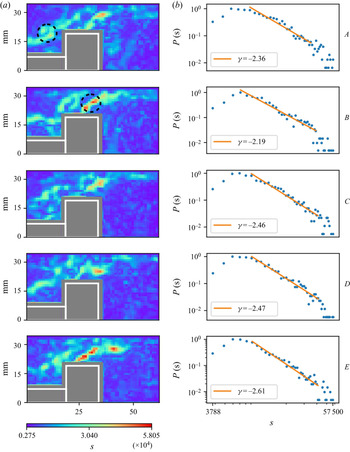
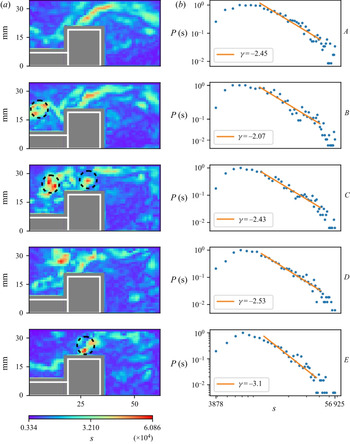
In figure 3, we examine the spatial distribution of the node strength ( $s$) at the corresponding time instances marked in figure 2(a). The colour bar at the bottom left-hand side indicates the range of
 $s$. Since we are considering only the magnitude of the induced velocity for the network construction,
 $s$ is positive throughout the flow field. Comparing the spatial distribution of
 $\omega$ (figure 2b) with that of
 $s$ (figure 3a), we observe that regions with high value of
 $\omega$ coincide with regions with high value of
 $s$. The maximum value of
 $s$ corresponds to the vortices being shed from the tip of the bluff body (figure 2b at time instances D and E). We plot the probability distribution of
 $s$ in figure 3(b). Here,
 $P(s)$ is the probability that a given node has a strength
 $s$. We observe power laws with an exponent
 $2\leqslant \gamma \leqslant 3$, thus unravelling the weighted scale-free nature of the vorticity dynamics during the occurrence of combustion noise (figure 3b). We analysed 100 turbulent networks during the occurrence of combustion noise and observed the weighted scale-free topology in 81 networks (refer to appendix A in the supplementary material available at https://doi.org/10.1017/jfm.2021.166). Thus, the weighted scale-free topology appears, disappears and reappears during the state of combustion noise.
(a) The spatial variation of the node strength,  $s$, during the state of combustion noise, at the corresponding time instants shown in figure 2. Regions with high values of
 $s$ coincide with regions of high
 $\omega$ at the tip of the bluff body. (b) The probability distribution of
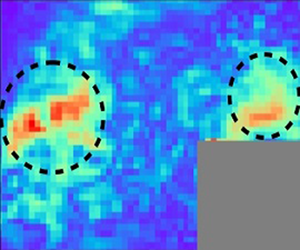
 $s$ in the log–log scale. The power law exponents show that the vorticity dynamics is weighted scale-free during combustion noise with the vortices shed from the tip of the bluff body acting as the primary hubs of the networks. One primary (red) and one secondary (green) hub is encircled.

The weighted scale-free nature of the vorticity dynamics has two implications. First, there are many vortices with weak interaction strength, i.e. they induce low velocities. Second, there are a few vortices with very high interaction strength (seen as red in figure 3a); these vortices induce very high velocities. Such vortices are called the ‘hubs’ of the network. The vortices that are shed from the tip of the bluff body, which has the highest node strength, are the primary hubs of the network (one of them is encircled in figure 3a, panel B). The vortices present in the outer shear layer (seen as green in figure 3a) have node strength values lower than the that for the vortices shed from the tip of the bluff body. These vortices are the secondary hubs of the network (one of them is encircled in figure 3a, panel A). They are not as dominant as the primary hubs. The primary hubs (fluid elements with very high vorticity) have stronger influence on all other fluid elements compared with the secondary hubs (fluid elements with moderately high vorticity). There are many smaller, weaker eddies (represented by blue in figure 3a), which have an influence only in their local vicinity. Thus, we can say that the vortices shed from the tip of the bluff body play a vital role in determining the spatiotemporal dynamics of the flow field during the occurrence of combustion noise. To obtain the power-law fit, we ensure that the coefficient of determinism  $R^2 \geqslant 0.90$ (Taira et al. Reference Taira, Nair and Brunton2016; Murayama et al. Reference Murayama, Kinugawa, Tokuda and Gotoda2018). Also, we ensure that at least
 $50\,\%$ of the total data points are used for curve fitting. The same procedure is followed for all the plots reported in the present study.
4.2. Turbulent networks during intermittency
Bursts of periodic oscillations embedded randomly amidst low amplitude aperiodic oscillations characterize the acoustic pressure during the state of intermittency. Here, we examine the vorticity interaction during an aperiodic epoch and a periodic epoch of acoustic pressure oscillations, respectively. In figure 4, we examine the flow field (see panel (b)) and the local  $p^\prime \dot {q}^\prime$ field (see panel (c)) during the aperiodic epoch of intermittency (see panel (a)). We observe small-scale vortices present along the outer shear layer downstream of the dump plane as well as in the inner shear layer at the bluff body tip (figure 4b), as found during the state of combustion noise. The grainy structure in the
 $p^\prime \dot {q}^\prime$ field (figure 4c) shows that acoustic power production happens in an incoherent manner as observed during the state of combustion noise.
(b) The local velocity and (c) the local acoustic power fields, in the logarithmic scale, at different time instants  $A, B, C, D$ and
 $E$ marked on the time series of acoustic pressure during an aperiodic epoch of intermittency (
 $\phi =0.81$) in (a). We observe small-scale vortices in the outer shear layer as well as in the inner shear layer. The local acoustic power production happens in an incoherent manner as observed during the state of combustion noise.

In figure 5(b), we find that the vorticity dynamics during the aperiodic epoch of intermittency is weighted scale-free, as observed during the state of combustion noise. Further, the primary hubs of the network are the vortices shed from the tip of the bluff body (figure 5a, at time instants  $A$,
 $D$ and
 $E$). However, in contrast to the case of combustion noise, at certain time instances (figure 5a, at time instants
 $A$ and
 $D$), we observe primary hubs in the outer shear layer as well. This implies that these vortices also have strong influence over the entire network. Hence, the vortices in the outer and inner shear layers influence the spatiotemporal dynamics during the aperiodic epoch of intermittency. Thus, we discern that the vortices in the outer shear layer play a stronger role during the aperiodic epoch of intermittency when compared with that during combustion noise. This is not apparent when we compare only the flow fields in figures 2(b) and 4(b), respectively.
(a) The spatial variation of the node strength,  $s$, during the aperiodic epoch of intermittency, at the corresponding time instants shown in figure 4. Regions with high values of
 $s$ coincide with regions of high
 $\omega$ at the tip of the bluff body as well as in the outer shear layer. (b) The power law exponents show that the vorticity dynamics is weighted scale-free during the aperiodic epoch of intermittency. The primary hubs in the outer and inner shear layers are encircled.

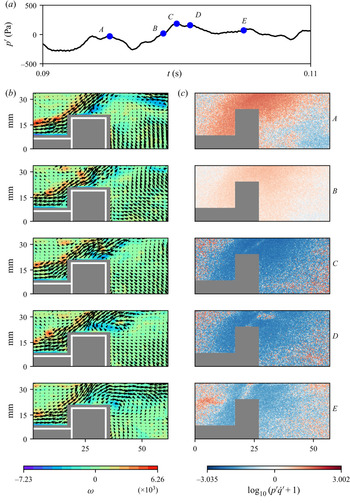
Next, we examine the periodic epoch of intermittency (figure 6a). During this regime, we observe the periodic formation of large-scale vortical structures downstream of the dump plane. These vortical structures begin to form at the local minima of  $p^\prime$ (figure 6b, at time instant
 $A$). The large-scale vortical structure then convects towards the bluff body (figure 6b at time instants
 $B$ and
 $C$). Recently, Krishnan et al. (Reference Krishnan, Sujith, Marwan and Kurths2019b) have shown that the formation of large-scale vortical structure leads to the conglomeration of acoustic power sources in the flow field. Hence, we observe a coherent acoustic power production during the formation of the vortical structure (figure 6c at time instants
 $A$ and
 $B$). During the periodic bursts, the flame moves back and forth, in sync with the periodic formation of the large-scale vortical structures. Hence, the presence of acoustic sinks upstream of the bluff body could be due to the absence of flame upstream of the bluff body (at time instants
 $C$ and
 $D$). Further, we observe the shedding of a bigger vortex at the tip of the bluff body compared with the states of combustion noise and aperiodic epoch of intermittency (at time instant
 $B$).
(b) The local velocity and (c) the local acoustic power fields, in the logarithmic scale, at different time instants  $A, B, C, D$ and
 $E$ marked on the time series of acoustic pressure during a periodic epoch of intermittency (
 $\phi =0.81$) in (a). We observe large-scale vortical structures downstream of the dump plane. The local acoustic power production happens in a coherent manner during the formation of the large-scale vortical structure.

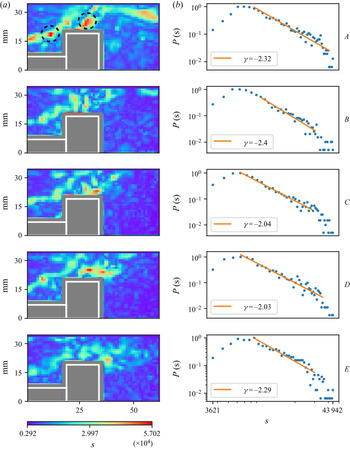
In figure 7(b), we observe that the node strength distributions display a weighted scale-free behaviour ( $2 \leqslant \gamma \leqslant 3$). This implies that the fluid elements with high vorticity behave as the hubs of the network (figure 7a at time instants
 $B$ and
 $C$) and hence have strong influence over the entire network. This weighted scale-free behaviour is consistently observed during the high amplitude bursts. We note that the vortices shed from the tip of the bluff body also act as hubs of the network (at time instants
 $B$,
 $C$ and
 $E$). Thus, the vorticity interactions during both the aperiodic and periodic epochs of intermittency have a weighted scale-free behaviour. We note that the magnitude of
 $\omega$ during both the aperiodic and periodic regimes of intermittency is of the same order as that observed during the state of combustion noise. However, the magnitude of
 $p^\prime \dot {q}^\prime$ is one order higher than that observed during the state of combustion noise. We observe that the weighted scale-free network topology during the aperiodic and periodic regimes of intermittency is intermittent in nature, i.e. the weighted scale-free topology appears, disappears and reappears (refer to appendix A in the supplementary material). Out of the 100 networks analysed each during the aperiodic and periodic regimes of intermittency, we observed weighted scale-free behaviour in only 52 and 43 networks, respectively. Thus, the weighted scale-free network topology is not as dominant as that observed during the state of combustion noise.
(a) The spatial variation of the node strength,  $s$, during the periodic epoch of intermittency, at the corresponding time instants shown in figure 6. Regions with high values of
 $s$ coincide with regions of high
 $\omega$ at the tip of the bluff body as well as in the outer shear layer. (b) The power law exponents suggest that the vorticity dynamics during the high-amplitude periodic burst is weighted scale-free. The vortical structures present downstream of the dump plane and at the tip of the bluff body are the primary hubs (encircled).

4.3. Turbulent networks during thermoacoustic instability
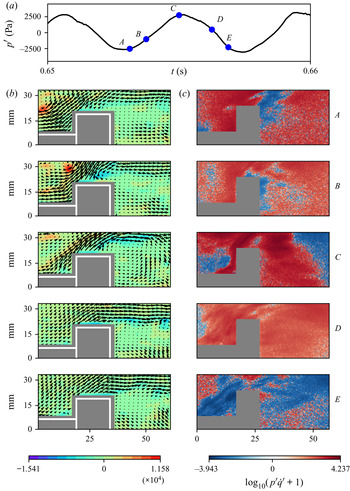
Large amplitude periodic acoustic pressure oscillations mark the onset of thermoacoustic instability. Figure 8 shows the flow field (see panel (b)) and the  $p^\prime \dot {q}^\prime$ field (see panel (c)) at five different time instants (see panel (a)) during one acoustic cycle of thermoacoustic oscillations. During thermoacoustic instability, we observe the periodic formation of large-scale vortical structures downstream of the dump plane (figure 8b, at time instants
 $A$ and
 $B$). The strength and the size of these vortical structures are higher than those observed during the periodic epoch of intermittency (George et al. Reference George, Unni, Raghunathan and Sujith2018). The formation of these large-scale vortical structures leads to the coherent production of acoustic power sources over large clusters (Krishnan et al. Reference Krishnan, Sujith, Marwan and Kurths2019b), as observed in figure 8(c). A large vortex is also shed from the tip of the bluff body (figure 8b, at time instant
 $C$).
(b) The local velocity and (c) the local acoustic power fields, in logarithmic scale, at time instants  $A, B, C, D$ and
 $E$ marked on the time series of acoustic pressure during one acoustic cycle of thermoacoustic instability (
 $\phi =0.62$) in (a). We observe formation of large-scale vortical structures downstream of the dump plane and shedding of large vortices from the tip of the bluff body. The acoustic power production happens over large clusters.

The frequency of the formation of the large-scale vortical structure as well as the shedding of the large vortex from the bluff body tip equals the acoustic frequency during thermoacoustic instability (142 Hz). The impingement of the large-scale vortical structures on the top wall of the combustor occurs when the pressure is at local maxima (figure 8b, at time instants  $C$). This leads to a sudden increase in the heat release rate. Consequently, we observe the maximum acoustic power production at the local maxima of
 $p^\prime$ (figure 8c, at time instant
 $C$). The maximum value of
 $s$ coincides with the maximum value of
 $\omega$ in the vortical structure ( figure 9a, at time instant
 $B$). The power-law distribution shows that the vorticity dynamics is weighted scale-free during the presence of large-scale vortical structures downstream of the dump plane and the large vortex downstream of the bluff body (figure 9b). These two large-scale vortical structures thus act as the hubs of the turbulent network and control the spatiotemporal dynamics during thermoacoustic instability. Here also, the weighted scale-free topology appears, disappears and reappears (refer to appendix A in the supplementary material). Out of the 100 turbulent networks analysed, we observed weighted scale-free topology in only 46 networks. Thus, we note that the occurrence of weighted scale-free turbulent network topology observed during the state of thermoacoustic instability is not as dominant as observed during the state of combustion noise. We note that the magnitudes of
 $\omega$ during the occurrence of thermoacoustic instability is one order of magnitude higher than that during the state of combustion noise. However, the magnitude of
 $p^\prime \dot {q}^\prime$ is two orders of magnitude higher than that during the occurrence of combustion noise.
(a) The spatial variation of the node strength,  $s$, during the occurrence of thermoacoustic instability, at the corresponding time instants shown in figure 8. Regions with high values of
 $s$ coincide with regions with high values of
 $\omega$ in the vortical structures. (b) The power law exponents suggest that the vorticity dynamics during thermoacoustic oscillations is weighted scale-free. The primary (red) and secondary (green) hubs are encircled.

To focus on the formation of the large-scale vortical structure downstream of the dump plane better, we perform high-speed PIV just downstream of the dump plane (refer to § 1 in supplementary material). Again, we observe that these large-scale vortical structures act as the hubs of the weighted scale-free networks (figure 1c, at time instant  $A$, in § 1 of the supplementary material).
Thus, during thermoacoustic instability, there are two primary hubs. One just downstream of the dump plane and the other at the tip of the bluff body. The large-scale vortical structure that is formed downstream of the dump plane at the local minima of  $p^\prime$, convects upwards to the top of the bluff body as
 $p^\prime$ grows in amplitude. As the large-scale vortex convects towards the top combustor wall, its size as well as circulation increases. Hence, the vortex remains as the primary hub during its convection towards the top combustor wall (at time instant
 $B$ in figure 9a). Near the local maxima of
 $p^\prime$, the large-scale vortical structure impinges upon the combustor wall near the top of the bluff body. At the same time instant, a vortex is shed from the tip of the bluff body due to the separation of the inner shear layer. As
 $p^\prime$ decreases in amplitude, this vortex convects downstream of the bluff body. During this period, it increases in size but the circulation decreases. Hence, the large-scale vortex acts as a primary hub at the tip of the bluff body (at time instant
 $B$ in figure 9a) but changes to a secondary hub as it convects downstream of the bluff body (at time instants
 $C$,
 $D$ and
 $E$ in figure 9a). Now, we ask the following question: Can we suppress thermoacoustic oscillations, if we target these hubs?
4.4. Control of thermoacoustic oscillations by disturbing the hubs
There are mainly two approaches to control thermoacoustic instability namely, (i) active control and (ii) passive control. Active control measures include the use of actuators such as loudspeakers or solenoid valves and oscillatory air/fuel injection to suppress the oscillatory instabilities (McManus et al. Reference McManus, Poinsot and Candel1993). Even though active control approaches are successful over a wide range of frequencies, the practical implementation of these methods adds complexity to the system as they involve the use of electro-mechanical components. Passive control, on the other hand, includes simple geometrical modifications such as the use of acoustic liners, baffles and Helmholtz or quarter-wave resonators, or modification of the injector geometry, injector location or the use of microjet injection or fuel staging to suppress thermoacoustic oscillations (Schadow & Gutmark Reference Schadow and Gutmark1992; Huang & Yang Reference Huang and Yang2009). Since passive control approaches are simple and robust, they find applications in real practical systems.
In the present study, we mitigate thermoacoustic oscillations by disturbing the hubs. We use a steady air-jet injection to disturb the hubs. The injection locations are shown in figure 10. Each of the ports is of 5 mm diameter. The injection location marked as 1 is at  $60^{\circ }$ with respect to the dump plane. The injection locations marked as 2 is at a distance of 15 mm from the dump plane. The distance between each of the ports at the top and bottom walls is 10 mm. We investigate the effect of eight different cases of steady air-jet injection, namely through a pair of ports at the dump plane marked as 1 and through two pairs of ports at the top and bottom walls.
The schematic diagram of the cross-section of the combustion chamber with the spatial location of the secondary steady air-jet injection ports marked as 1, 2, 3, 4, 5, 6, 7 and 8. All the dimensions are in mm.

In figure 11, we show the variation of  $p^\prime _{rms}$ with respect to the total momentum flux ratio,
 $({v_j}/{v_a})^2$, of the secondary air-jet injection for the eight different cases. Here,
 ${v_j}$ represents the velocity of the secondary air jet through a single port and
 ${v_a}$ represents the velocity of the main air at the combustor inlet. The normalization factor
 $p^\prime _{rms ({\rm baseline})}$ corresponds to
 $p^\prime _{rms}$ during thermoacoustic instability in the absence of a secondary air-jet injection into the combustion chamber (
 $({v_j}/{v_a})^2=0$). We increase the air flow rate through each of the ports in steps of 5 SLPM to a maximum of
 $25\pm 1.2$ SLPM.
The variation of  $p\prime _{rms}$ (normalized) of thermoacoustic oscillations due to a secondary air-jet injection at different locations with respect to the total momentum flux ratio
 $({v_j}/{v_a})^2$. The vertical error bars represent the standard deviation. The regions below (i) ports 2 and 3 and (ii) ports 4 and 5 correspond to the location of formation of primary hubs during thermoacoustic instability.

We obtain a suppression of 86.4 %, 82.2 % and 79.7 % in  $p^\prime _{rms}$ for an air jet injection at (i) the dump plane through port 1, (ii) ports 2 and 3 and (iii) ports 4 and 5, respectively. The optimum total momentum flux ratio at which we observe the suppression of thermoacoustic oscillations for dump plane injection is exactly half of that observed for the other two cases. Even though we observe a maximum suppression of thermoacoustic oscillations at the same total momentum flux ratio, the decrease in
 $p^\prime _{rms}$ is rather sudden for the secondary air-jet injection at ports 4 and 5 when compared with the injection at ports 2 and 3. The
 $p^\prime _{rms}$ (
 ${\approx }200$ Pa) after suppression, for all three cases of secondary air-jet injection, is close to the value observed during the state of combustion noise (
 $p^\prime _{rms}\approx 100$ Pa).
The location of ports 2 and 3 coincide with the region downstream of the dump plane where the large-scale vortical structures are formed. The region below ports 4 and 5 is the location where the large-scale vortical structure impinges, resulting in the sudden spike in the heat release rate. Also, another large-scale vortical structure forms below the ports 4 and 5, at the tip of the bluff body. It should be noted that we did not obtain any suppression of the thermoacoustic oscillations when we injected steady air jets individually through ports 2, 3, 4 and 5 (refer to figure 2 in appendix B in the supplementary material for the effect of steady air jets through each of the seven ports along the length of the combustor). This could be due to the fact that the size of the large-scale vortical structures that form during thermoacoustic instability span a considerable area. So, to successfully prevent the formation of the large-scale vortices downstream of the dump plane and at the tip of the bluff body, we may require the injection of the air jets through a pair of ports instead of a single port.
Even though the region below ports 3 and 4 lies in the convection path of the large-scale vortical structure, the suppression is not that effective (41.68 %). Also, we do not obtain any suppression of thermoacoustic oscillations when we inject air jets downstream of the bluff body (through (i) ports 5 and 6, (ii) ports 6 and 7 and (iii) ports 7 and 8). It should be noted that the secondary hubs during thermoacoustic instability are formed below the regions of ports 6, 7 and 8 (figure 9a at time instants  $C$ and
 $D$). This shows that it is imperative to distinguish between the primary and secondary hubs for the control strategy to be successful. Hence, we clearly see that the regions where the two large-scale vortical structures form periodically during thermoacoustic instability – the one downstream of the dump plane and the one at the tip of the bluff body – are indeed the two optimal locations to implement passive control strategies to mitigate thermoacoustic instability.
Next, we examine the vorticity interaction during the secondary air-jet injection at the dump plane and compare it with that observed during the state of combustion noise. In figure 12(a), we observe that the magnitude of  $p^\prime$ is comparable to that observed during combustion noise. Figure 12(b) shows the spatial distribution of the node strength distribution when thermoacoustic oscillations are suppressed (at
 $(v_j/v_a)^2=6.41$). We still observe small-scale vortices in the outer and inner shear layers. We find that the spatiotemporal dynamics of the turbulent network during the stable state obtained with the injection of steady air jets is also intermittently weighted scale-free. Out of 100 turbulent networks, only 36 networks were weighted scale-free during the stable state obtained with the injection of steady air jets as compared with 81 networks during the occurrence of combustion noise (refer to appendix A in the supplementary material). Thus, the weighted scale-free property observed during the stable state obtained with the injection of steady air jets is not as dominant as observed during the state of combustion noise.
(b) The spatial distribution of the node strength,  $s$, and (c) its probability distribution during the time instants
 $A-E$ marked on the time series of acoustic pressure with steady secondary air injection at the dump plane in (a). The total momentum flux ratio between the secondary air jets and the main air flow rate is 6.41.

Recently, we have used network theory to identify the optimal location to implement a passive control strategy (Krishnan et al. Reference Krishnan, Manikandan, Midhun, Reeja, Unni, Sujith, Marwan and Kurths2019a). We constructed weighted spatial correlation networks from the velocity field and used network measures to identify the optimal location for secondary air-jet injection. We referred to this optimal location as the ‘critical region’, i.e. the region that controls the spatiotemporal dynamics during thermoacoustic instability on an average sense. The critical region corresponds to the region on top of the bluff body shaft, just downstream of the dump plane, where the fluid parcels exhibit coherent periodic motion. It is this coherent pumping action of the flow at the combustor inlet that leads to the periodic formation of large-scale vortical structures downstream of the dump plane at the onset of thermoacoustic instability. The secondary air injection through port 1 at the dump plane as well as through ports 2 and 3 at the top and bottom walls of the combustor target this critical region. When the critical region is disturbed by the steady air jets, the periodic coherent motion is disrupted.
During the state of combustion noise, the acoustic power production happens over small fragmented islands in an ocean of acoustic sinks. At the onset of thermoacoustic instability, the acoustic power production happens over large islands or clusters (Krishnan et al. Reference Krishnan, Sujith, Marwan and Kurths2019b). The secondary air-jet injections during thermoacoustic instability, targeting the critical region over the bluff body shaft, break apart these large clusters of acoustic power sources at an optimal total momentum flux ratio (Krishnan et al. Reference Krishnan, Manikandan, Midhun, Reeja, Unni, Sujith, Marwan and Kurths2019a). Hence, the secondary air-jet injections through (i) port 1 and (ii) ports 2 and 3 prevent the formation of the large-scale vortical structures downstream of the dump plane, which eventually stop the coherent production of acoustic power sources over large clusters or islands in the turbulent reactive flow field. As the coherent acoustic power production ceases, the acoustic damping outweighs the acoustic driving leading to the suppression of large amplitude thermoacoustic oscillations.
To examine whether the hub of the turbulent network, identified in the current study, coincides with the critical region identified by Krishnan et al. (Reference Krishnan, Manikandan, Midhun, Reeja, Unni, Sujith, Marwan and Kurths2019a), we compare the two networks in figure 13. In figure 13(a), we plot the spatial distribution of the node strength of the weighted correlation network during thermoacoustic instability obtained from weighted correlation network analysis. The region above the bluff body shaft, just downstream of the dump plane, where the node strength is the maximum is the critical region. In figure 13(b), we plot the spatial distribution of the node strength of the turbulent network constructed from the phase averaged vorticity field. The phase averaging is performed over 10 cycles of thermoacoustic instability at the local pressure minima (the phase at which the formation of the large-scale vortical structure happens downstream of the dump plane). We plot the probability distribution of the node strength of the phase-averaged turbulent network in figure 13(c). The power-law exponent suggests that the phase-averaged turbulent network is weighted scale-free with the primary hubs of the network coinciding with the phase-averaged vorticity at the lip of the dump plane and the tip of the bluff body. Thus, the spatial location of the primary hubs of the phase averaged turbulent networks during the occurrence of thermoacoustic instability are indeed the two optimal locations for implementing passive control strategies. Clearly, we note that the hub of the turbulent network is above the critical region obtained from the weighted spatial correlation network analysis. However, the steady secondary air jets through (i) port 1 and (ii) ports 2 and 3 target both the hub (at the lip of the dump plane) as well as the critical region obtained from the weighted spatial correlation network analysis.
(a) The spatial distribution of the node strength during thermoacoustic instability from the weighted correlation network analysis performed in Krishnan et al. (Reference Krishnan, Manikandan, Midhun, Reeja, Unni, Sujith, Marwan and Kurths2019a). (b) The spatial distribution of the node strength of the phase averaged turbulent network during thermoacoustic instability and (c) the probability distribution of the node strength of the phase averaged turbulent network. The phase averaged turbulent network is weighted scale-free and the primary hubs of the phase averaged turbulent networks (encircled) are the two optimal locations for implementing passive control strategies.

Next, we examine a plausible mechanism of suppression of thermoacoustic instability with secondary air-jet injection through ports 4 and 5. During thermoacoustic instability, the maximum acoustic power production occurs above the bluff body at the local maximum of the acoustic pressure oscillations (Krishnan et al. Reference Krishnan, Sujith, Marwan and Kurths2019b). At the local maxima of  $p^\prime$, the sudden spike in the acoustic power happens due to the impingement of the large-scale vortical structures against the walls of the combustor. The secondary air-jet injections through ports 4 and 5 suppress this sudden increase in heat release (as observed in the high-speed chemiluminescence images, not shown here). The suppression of the sudden spike in heat release, in turn, could be reducing the acoustic driving leading to the decrease in the amplitude of
 $p\prime$. Also, we can argue that the secondary air injection at ports 4 and 5 would prevent the shear layer separation from the tip of the bluff body, thus preventing the formation of large vortices downstream of the bluff body.
Now, we highlight the novelty of the current study. Since the large clusters of acoustic power sources, which are observed during thermoacoustic instability, span a considerable area, we may have to inject microjets at multiple locations to suppress thermoacoustic oscillations. Such an approach cannot be considered as smart and efficient. More importantly, occasionally there are instances during the state of stable operation when we observe the acoustic power production occurring in large clusters (Krishnan et al. Reference Krishnan, Sujith, Marwan and Kurths2019b). However, the magnitude of the acoustic power production is two orders of magnitude lower than that during thermoacoustic instability. Hence, a passive control strategy based only on the spatial distribution of acoustic power sources is very inefficient. Further, the heat release rate is not easy to measure for many conditions even with a perfectly accessible combustor. Also, it must be noted that chemiluminescence is a surrogate and works only in certain cases.
In contrast to chemiluminescence, PIV measurements are less ambiguous. Using spatial network analysis based only on the physics of the flow field inside the combustion chamber, we are able to identify two optimal locations for implementing passive control strategies. This shows that the control strategy using network analysis based on the velocity field is more robust compared with the one based on the spatial distribution of local acoustic power sources.
Further, we note that we are able to identify two optimal locations based on the vorticity network analysis as compared with the single optimal location, which we had identified using the velocity correlation network analysis (Krishnan et al. Reference Krishnan, Manikandan, Midhun, Reeja, Unni, Sujith, Marwan and Kurths2019a; Unni et al. Reference Unni, Nair, Krishnan, Marwan and Kurths2021). Hence, we can say that the vorticity network analysis used in the current study is better compared with the correlation network analysis performed by us in our earlier study (Krishnan et al. Reference Krishnan, Manikandan, Midhun, Reeja, Unni, Sujith, Marwan and Kurths2019a).
Earlier, Murayama et al. (Reference Murayama, Kinugawa, Tokuda and Gotoda2018) had constructed turbulent networks during thermoacoustic instability in a swirl stabilized combustor. They reported the presence of scale-free behaviour in the vorticity dynamics with the ring vortices near the injector exit acting as the hubs of the turbulent network. However, they did not characterize the vorticity dynamics during the states of combustion noise and intermittency. Later, Murayama & Gotoda (Reference Murayama and Gotoda2019) studied the suppression of thermoacoustic oscillations using steady air-jet injection in the same swirl stabilized combustor that was used in Murayama et al. (Reference Murayama, Kinugawa, Tokuda and Gotoda2018), from the viewpoint of complex networks and synchronization. They proposed a measure called the synchronization index, based on the phase synchronization parameter and the joint probability of recurrence plots, to capture the mutual coupling between the pressure and the heat release rate oscillations. With a steady secondary air-jet injection through the centre body of the axial swirler, they showed that the periodicity of noisy periodic oscillations in the flow velocity field is lost. This decrease in the periodicity significantly affects the mutual coupling between the pressure and heat release rate oscillations, resulting in the suppression of thermoacoustic oscillations. In light of our analysis, we can interpret their result as follows: the suppression of thermoacoustic instability occurs due to the prevention of the formation of the ring vortices (hubs of the turbulent network) by the air injection through the centre body of the axial swirler.
In network theory, researchers have shown that the scale-free networks are highly resilient to random node removal, but vulnerable to targeted attack (Barabási & Bonabeau Reference Barabási and Bonabeau2003). Thus, a scale-free network disintegrates when we target the hubs. Due to this feature, the hub of a scale-free network is also known as the Achilles heel. Similarly, here, we can argue that the large-scale vortical structures are the Achilles heel of the turbulent network during thermoacoustic instability as we are able to ‘kill’ thermoacoustic oscillations by targeting the large-scale vortical structures with secondary air injections.
5. Conclusions
In the present study, we characterize the vorticity interactions during the occurrence of different states of combustion noise, intermittency and thermoacoustic instability by constructing time-varying weighted spatial turbulent networks, based on the Biot–Savart law. We uncover that the turbulent networks intermittently display a weighted scale-free topology during all the three states of combustor operation with the fluid elements having high vorticity acting as the hubs of the turbulent networks. The fluid elements with very high vorticity (known as primary hubs) have stronger influence over the entire network compared with the ones with moderately high vorticity (known as secondary hubs). During the occurrence of thermoacoustic instability, the large-scale vortical structures that form downstream of the dump plane as well as at the tip of the bluff body act as the primary hubs of the turbulent networks. We successfully suppress thermoacoustic instability by preventing the formation of these primary hubs using steady secondary air jets and thus suppress thermoacoustic oscillations. We note that it is imperative to distinguish between the primary and secondary hubs for the control strategy to be successful, thus making the primary hubs the Achilles heel of the turbulent networks during thermoacoustic instability. Further, we find that the vorticity network analysis based on the Biot–Savart law is better compared with the network analysis based on the correlation of velocity (Krishnan et al. Reference Krishnan, Manikandan, Midhun, Reeja, Unni, Sujith, Marwan and Kurths2019a) in identifying the optimal locations for implementing passive control strategies. The approach presented in this study could pave way for the control of oscillatory instability in turbulent flows.
Supplementary material
Supplementary material is available at https://doi.org/10.1017/jfm.2021.166.
Acknowledgements
We thank R. Midhun, K.V. Reeja, R. Manikandan, N.B. George, Dr V.R. Unni, S. Thilagaraj and S. Anand for the help in performing the experiments. We thank V. Godavathi, Dr V.R. Unni and P. Kasthuri for the fruitful discussions. We thank Dr T. Komrek and Professor W. Polifke, TU Munich, Germany, for sharing the design of the combustor.
Funding
R.I.S. thanks the Science and Engineering Research Board (SERB) of the Department of Science and Technology (DST) for financial support in the form of J. C. Bose Fellowship (JCB/2018/000034/SSC).
Declaration of interests
The authors report no conflict of interest.