1. Introduction
Learning a second language (L2) during childhood, compared to learning the L2 in adulthood, typically leads to superior L2 speech perception (Hisagi, Garrido-Nag, Datta & Shafer, Reference Hisagi, Garrido-Nag, Datta and Shafer2015) and production skills (Baker, Trofimovich, Flege, Mack & Halter, Reference Baker, Trofimovich, Flege, Mack and Halter2008; Piske, Flege, MacKay & Meador, Reference Piske, Flege, MacKay and Meador2002; Yeni-Komshian, Flege & Liu, Reference Yeni-Komshian, Flege and Liu2000). Perception is the listener's experience of the stimulus and is measured using behavior, such as phoneme-category identification or discrimination tasks. It is uncertain whether the neural processes that support speech perception differ between early bilinguals and monolingual listeners. The current study addresses this question.
Three alternative models have been proposed for how bilinguals perceive speech in their two languages (Hisagi et al., Reference Hisagi, Garrido-Nag, Datta and Shafer2015). The first model suggests that bilinguals favor one phonology over the other (Cutler, Norris & Williams, Reference Cutler, Norris and Williams1987; Snijders, Kooijman, Cutler & Hagoort, Reference Snijders, Kooijman, Cutler and Hagoort2007). The second model proposes that bilinguals compromise between the phonological systems of the two languages (Williams, Reference Williams1977). The third model is that bilingual listeners adjust their phonological categories based on linguistic context (Elman, Diehl & Buchwald, Reference Elman, Diehl and Buchwald1977; Gonzales & Lotto, Reference Gonzales and Lotto2013).
Studies of adult bilinguals generally rely on self-reports of early language experience, which is likely to be imperfect, and, thus, could account for disparate findings in L2 speech perception across studies. However, language history of children reported by parents/guardians is more immediate and likely to be more accurate. Previous studies indicate that adult and child bilinguals do not necessarily show the same pattern of processing compared to monolingual age-matched participants (Baker et al., Reference Baker, Trofimovich, Flege, Mack and Halter2008; Brice, Gorman & Leung, Reference Brice, Gorman and Leung2013; Rinker, Shafer, Kiefer, Vidal & Yu, Reference Rinker, Shafer, Kiefer, Vidal and Yu2017; Tong, Lee, Lee & Burnham, Reference Tong, Lee, Lee and Burnham2015). For example, children who begin learning the L2 before five years of age may still demonstrate differences from monolinguals and these differences may be related to insufficient input. In addition, few studies have examined neural measures of speech processing in typically-developing children and only a few have focused on bilingual children (Kuipers & Thierry, Reference Kuipers and Thierry2015; Rinker, Alku, Brosch & Kiefer, Reference Rinker, Alku, Brosch and Kiefer2010; Rinker et al., Reference Rinker, Shafer, Kiefer, Vidal and Yu2017). Thus, there is a clear need for investigations of speech processing in both monolingual and bilingual children.
1.1 Development of speech perception in monolingual and bilingual children
Monolingual children in the grade-school years generally show good phonological skills, but these skills are not yet fully developed (Nittrouer, Reference Nittrouer2006). Specifically, in speech perception, grade-school children rely more heavily on global cues (e.g., spectral formant transitions) than more fine-grained spectral cues (Nittrouer, Reference Nittrouer2002). Child learners who begin learning English as an L2 after three years of age generally show good English-language skills within four and half to six and half years of exposure in school (Paradis & Jia, Reference Paradis and Jia2017). However, a language gap may persist into middle school, even for children learning English before six years of age (Farnia & Geva, Reference Farnia and Geva2011), if they speak a different language at home consistently. Socio-economic status (SES) and language background factors (e.g., language use in the home) may account for some of the differences in English language performance (Jia & Fuse, Reference Jia and Fuse2007). L2 performance can also vary across different aspects of the L2 (Paradis & Jia, Reference Paradis and Jia2017). For example, lexical knowledge may fall within the typical range, whereas phonology will continue to lag behind.
To date, only a few studies have closely examined L2 speech processing in bilingual, grade-school children. Perception studies indicate that there is some influence of the L1 on the L2, at least at younger ages. For example, a study of Korean–English children showed poorer perception of English vowels than monolingual English-speaking 2- to 5-year-old children, but better perception than adult late-learners of English (Tsukada, Birdsong, Bialystok, Mack, Sung & Flege, Reference Tsukada, Birdsong, Bialystok, Mack, Sung and Flege2005). Immersion in the L2 at school leads to native-like perception of L2 vowels (McCarthy, Mahon, Rosen & Evans, Reference McCarthy, Mahon, Rosen and Evans2014), but there can still be lingering differences at older ages (Darcy & Krüger, Reference Darcy and Krüger2012). Speech and language skills in the L2 of early bilinguals, however, can be comparable to those of monolinguals by about 10 years of age, for children who attend schools in which the L2 is the dominant language (Paradis & Jia, Reference Paradis and Jia2017).
1.2 Neurophysiological measures of speech discrimination
Several neurophysiological studies of L2 speech processing have found differences between monolinguals and early bilinguals that are not apparent at the behavioral level (Hisagi et al., Reference Hisagi, Garrido-Nag, Datta and Shafer2015; Sebastian-Gallés, Rodríguez-Fornells, de Diego-Balaguer & Díaz, Reference Sebastian-Gallés, Rodríguez-Fornells, de Diego-Balaguer and Díaz2006). Event Related Potentials (ERPs) reflect information processing that precedes the behavioral response. Specifically, the Mismatch Negativity (MMN) component indexes speech sound discrimination under conditions where attention is directed away from the stimulus of interest, thereby revealing more automatic processes. MMN is elicited in an oddball paradigm where one stimulus is repeated frequently (the standard) and a second stimulus is presented infrequently (the deviant) and computed as the difference between the response to these two conditions. The MMN is seen as increased negativity at fronto-central sites to the deviant compared to the standard, generally peaking between 100 and 300 ms following onset of the stimulus (Näätänen, Paavilainen, Rinne & Alho, Reference Näätänen, Paavilainen, Rinne and Alho2007; Näätänen, Sussman, Salisbury & Shafer, Reference Näätänen, Sussman, Salisbury and Shafer2014).
Many MMN studies have found that early bilingual experience results in differences from monolinguals (Molnar, Polka, Baum & Steinhauer, Reference Molnar, Polka, Baum and Steinhauer2014; Peltola, Tuomainen, Koskinen & Aaltonen, Reference Peltola, Tuomainen, Koskinen and Aaltonen2007; Sebastian-Gallés et al., Reference Sebastian-Gallés, Rodríguez-Fornells, de Diego-Balaguer and Díaz2006; Shafer, Yu & Datta, Reference Shafer, Yu and Datta2011; Tamminen, Peltola, Toivonen, Kujala & Näätänen, Reference Tamminen, Peltola, Toivonen, Kujala and Näätänen2013). It is unclear which of the three models presented above better fits the results from various studies. Some studies of bilingual adults suggest that their sensitivity to L2 phonological contrasts is influenced by linguistic context (Garcia-Sierra, Ramirez-Esparza, Silva-Pereyra, Siard & Champlin, Reference Garcia-Sierra, Ramirez-Esparza, Silva-Pereyra, Siard and Champlin2012; Masapollo & Polka, Reference Masapollo and Polka2014). Other studies support the claim that bilinguals have compromised between two phonological systems (Peltola et al., Reference Peltola, Kuntola, Tamminen, Hämäläinen and Aaltonen2005, Reference Peltola, Tuomainen, Koskinen and Aaltonen2007; Tamminen et al., Reference Tamminen, Peltola, Toivonen, Kujala and Näätänen2013), or support the claim that bilinguals favor one system over another (Hisagi et al., Reference Hisagi, Garrido-Nag, Datta and Shafer2015).
Hisagi et al. (Reference Hisagi, Garrido-Nag, Datta and Shafer2015) found that adults with early bilingual experience showed accurate behavioral categorization and discrimination of an L2 vowel contrast, similar to the monolingual listeners; this finding is inconsistent with the model suggesting that bilinguals ‘compromise’. In contrast, for the neural measure, MMN was smaller in early bilinguals (as well as in late bilinguals) than monolinguals; this pattern initially appears to be inconsistent with the model suggesting that bilinguals have flexibility to adjust to linguistic context. Taken together, these findings may indicate that at an attention-independent level, early bilinguals favor the L1, but that, with attention, they show flexibility, which allowed native-like behavioral judgments. Thus, it is of particular interest to understand how attention influences the MMN index of speech discrimination.
Speech perception studies using an oddball design may also elicit a late negativity (LN) response (Cheour, Korpilahti, Martynova & Lang, Reference Cheour, Korpilahti, Martynova and Lang2001; Wetzel & Schröger, Reference Wetzel and Schröger2014). Several studies with children have observed LN following the MMN (Datta, Shafer, Morr, Kurtzberg & Schwartz, Reference Datta, Shafer, Morr, Kurtzberg and Schwartz2010; Hestvik & Durvasula, Reference Hestvik and Durvasula2016; Moreno & Lee, Reference Moreno and Lee2015; Putkinen, Niinikuru, Lipsanen, Tervaniemi & Huotilainen, Reference Putkinen, Niinikuru, Lipsanen, Tervaniemi and Huotilainen2012; Shafer, Morr, Datta, Kurtzberg & Schwartz, Reference Shafer, Morr, Datta, Kurtzberg and Schwartz2005; Shestakova, Huotilainen, Ceponiene & Cheour, Reference Shestakova, Huotilainen, Ceponiene and Cheour2003). The LN may be an index of re-orienting attention (Ceponiene, Lepistö, Soininen, Aronen, Alku & Näätänen, Reference Ceponiene, Lepistö, Soininen, Aronen, Alku and Näätänen2004). This response is of interest because it might serve as an index of attentional resource allocation during speech discrimination and allow testing of differences between monolinguals and bilinguals.
1.3 ERP measures of speech processing in children
ERP studies suggest that speech processing may not be adult-like until well past puberty (Shafer, Yu & Datta, Reference Shafer, Yu and Datta2010; Shafer, Yu & Wagner, Reference Shafer, Yu and Wagner2015). This immature system may allow increased plasticity in learning an L2 (Kuhl, Conboy, Coffey-Corina, Padden, Rivera-Gaxiola & Nelson, Reference Kuhl, Conboy, Coffey-Corina, Padden, Rivera-Gaxiola and Nelson2008). In addition, some studies suggest that early learning of speech depends on implicit processes, which allows for native-like speech perception (Archila-Suerte, Zevin, Bunta & Hernandez, Reference Archila-Suerte, Zevin, Bunta and Hernandez2012). Most ERP studies of child speech processing focus on disorders (Kujala & Leminen, Reference Kujala and Leminen2017). The few that focus on speech processing in child L2 acquisition have largely examined children between three and seven years of age.
The first ERP studies of child L2 learners suggested differences from age-matched monolingual controls. In several studies, experience with an L2 in a daycare or school setting led to a larger MMN to an L2 speech contrast compared to non-native child listeners (Cheour, Shestakova, Alku, Ceponiene & Näätänen, Reference Cheour, Shestakova, Alku, Ceponiene and Näätänen2002; Peltola et al., Reference Peltola, Kuntola, Tamminen, Hämäläinen and Aaltonen2005; Shestakova et al., Reference Shestakova, Huotilainen, Ceponiene and Cheour2003). For example, three- to six-year-old Finnish children exposed to French in pre-school showed an increased MMN to the French vowel contrast /e/ and /ε/ versus standard /i/ after six months of experience (Cheour et al., Reference Cheour, Shestakova, Alku, Ceponiene and Näätänen2002). The P3a and LN also increased from pre- to post-exposure. Cheour et al. (Reference Cheour, Shestakova, Alku, Ceponiene and Näätänen2002) suggested that the LN indicated involuntary attention shifts to the deviant sounds and that this was more apparent as time of L2 exposure increased. The P3a is an index of involuntary attention orienting to non-target deviant stimuli (Polich, Reference Polich, Kappenman and Luck2012).
Other studies of child L2 learning have failed to observe an increase in MMN amplitude to an L2 speech contrast as L2 experience increases. For example, Peltola et al. (Reference Peltola, Tuomainen, Koskinen and Aaltonen2007) did not observed increased MMN for eight-year-old Finnish children immersed in learning English compared to Finnish controls. Interestingly, the Finnish children learning English did not show robust MMNs to native Finnish contrasts either. The authors suggested that neural circuitry was not committed to native sounds at this age. In another study, five- to six-year old children from Turkish–German-speaking homes with two to three years of German exposure exhibited smaller MMN to German vowel contrasts compared to German monolingual children (Rinker et al., Reference Rinker, Alku, Brosch and Kiefer2010). The authors suggest that inadequate L2 input beginning after three years of age may account for the small MMN to the L2 contrast.
ERP studies of L2 speech in children have not reported whether an LN or P3a is modulated by language experience. In our previous studies of children, the LN was not modulated by attention (Shafer et al., Reference Shafer, Morr, Datta, Kurtzberg and Schwartz2005; Datta et al., Reference Datta, Shafer, Morr, Kurtzberg and Schwartz2010), but it was present in both children with specific language impairment (SLI) and their typically developing peers. In addition, for a more salient vowel contrast (longer 250-ms /ε/ versus /ɪ/), children with typical development showed a P3a, indicating that the stimulus difference was sufficiently great to lead to an orienting response (Datta et al., Reference Datta, Shafer, Morr, Kurtzberg and Schwartz2010). Thus, it is of interest to examine whether bilingual experience modulates neural indices of attention orienting in children.
1.4 Effects of attention on speech perception in adults and children
Attention plays a role in the development of speech perception. Differences in maturation of attentional skills and in how attention is employed during speech processing tasks could influence the pattern of results observed in studies of bilingual children and adults. Several developmental models suggest that infants initially direct attention to relevant cues in the ambient language to acquire a weighting scheme, or selective perception routines (SPRs) for the native language phonology (Jusczyk, Cutler & Redanz, Reference Jusczyk, Cutler and Redanz1993; Kuhl et al., Reference Kuhl, Conboy, Coffey-Corina, Padden, Rivera-Gaxiola and Nelson2008; Strange, Reference Strange2011; Werker & Curtin, Reference Werker and Curtin2005). Over the first four years of life, SPRs are hypothesized to become automatized to allow for efficient recovery of the phonological form from the acoustic-phonetic information (Shafer et al., Reference Shafer, Yu and Datta2010, Reference Shafer, Yu and Datta2011). Late L2 learners often do not exhibit automaticity of L2 speech perception but use their L1 SPRs instead. This leads to poorer perception under conditions of high cognitive load, such as perception in background noise (Strange, Reference Strange2011).
The time course for developing automaticity of speech perception in an L1 or L2 is unknown. We have suggested elsewhere that monolingual American-English children do not show automaticity in processing a contrast between the vowel /ɪ/ in “bid” and /ε/ in “bed” until after four years of age (Shafer et al., Reference Shafer, Yu and Datta2010, Reference Shafer, Yu and Datta2011), based on the finding that MMN was not observed in the majority of children until after four years of age (also see Lee et al., Reference Lee, Yen, Yeh, Lin, Cheng, Tzeng and Wu2012). The latency of the MMN was also later for children compared to adults, suggesting that children's processing at this stage of development is less automatic.
In two previous studies which examined speech perception in 8-10 year-old children (Shafer et al., Reference Shafer, Morr, Datta, Kurtzberg and Schwartz2005, Datta et al., Reference Datta, Shafer, Morr, Kurtzberg and Schwartz2010) and one of which used the same stimuli as in the current study (Shafer et al., Reference Shafer, Morr, Datta, Kurtzberg and Schwartz2005), little effect of attention was found on the MMN to the /ɪ/ vs. /ε/ contrast. In these studies, the children were asked to attend to a tone occurring infrequently among the vowel stimuli in one condition and ignore the auditory stimuli and watch a video in the other condition. The only difference in the MMN was that the response began earlier when attending, but only for the long-vowel contrast (Datta et al., Reference Datta, Shafer, Morr, Kurtzberg and Schwartz2010). These studies suggest that by 8-10 years of age, children are sufficiently automatic in L1 speech perception and, like adults, attention has little effect on neural discrimination.
In the studies with the tone target (Shafer et al., Reference Shafer, Morr, Datta, Kurtzberg and Schwartz2005; Datta et al., Reference Datta, Shafer, Morr, Kurtzberg and Schwartz2010), there was evidence of greater attention to the auditory modality, seen as a P3a response following the MMN to the long vowels in a condition requiring attention to the stimuli (compared to ignoring the stimuli). In addition, the “processing negativity” (PN), which indexes attention orienting and is seen as a negative shift in the ERP (Näätänen, Reference Näätänen1982), was observed in the attention task (Shafer et al., Reference Shafer, Ponton, Datta, Morr and Schwartz2007). An interesting question is whether children and adults who are bilingual from an early age would show a similar pattern of neural responses in processing speech under different attention conditions as monolinguals. This is the central question that we address in the current study.
1.5 The present study
Our first aim was to investigate whether early Spanish–English bilingual speakers exhibit different neural processing of the contrast between /ɪ/ and /ε/ in American English – a contrast that is not phonemic in the Spanish L1 of these speakers – in comparison to monolingual native speakers. Our earlier study revealed a smaller MMN in a passive task to this contrast in bilinguals compared to monolinguals, even when the bilinguals learned English before five years of age (Hisagi et al., Reference Hisagi, Garrido-Nag, Datta and Shafer2015). This smaller MMN was attributed to reliance on SPRs (Strange, Reference Strange2011) tailored to Spanish vowels rather than to American English vowels. This previous study did not fully examine the amount of language input received in English vs. Spanish by the participants. Thus, the current study includes more language background information, and aims to replicate the MMN difference observed in our previous study, and at the same time establish the relationship between MMN and language use measures.
Our second aim focused on whether 8-10 year-old bilingual children, who began learning English no later than five years of age, would show maturational differences and/or show similar language group differences observed between adult early bilinguals and monolinguals. The L2 is becoming well-established between four and a half to six and a half years of experience in the school system (Paradis & Jia, Reference Paradis and Jia2017), but there may still be subtle differences in phonological processing that are not apparent in behavior. In addition, auditory maturation is incomplete (Shafer et al., Reference Shafer, Morr, Kreuzer and Kurtzberg2000). We hypothesized that bilingual children would show smaller MMN than their monolingual peers in a passive task (watching a muted movie) than when paying attention to the auditory stimuli. Specifically, the bilinguals might rely on their L1 speech perception routines. In addition, we predicted that both groups would show a late negativity (LN) discriminative response, because this response is robustly present even in children with weak language skills (Shafer et al., Reference Shafer, Morr, Datta, Kurtzberg and Schwartz2005).
Our third aim was to examine whether early bilingual experience affected automaticity of processing of this vowel contrast, as indexed by the MMN and LN discriminative responses. We hypothesized that monolingual English-speaking adults would show no modulation of MMN to this contrast, as a function of attention directed to versus away from the stimulus stream; Spanish–English bilinguals, however, might show enhanced MMN amplitude when attending to the speech stream, because they are less automatic. This prediction follows from the claim that L1 speech perception is highly automatic, and thus, not influenced by attention, whereas L2 speech perception is more effortful (Hisagi et al., Reference Hisagi, Garrido-Nag, Datta and Shafer2015). With regards to the LN, we predicted that bilingual listeners would show a larger LN (Ortiz-Mantilla, Choudhury, Alvarez & Benasich, Reference Ortiz-Mantilla, Choudhury, Alvarez and Benasich2010). In addition, we hypothesized that both child groups would show increased MMN and LN when attending to the speech signal as compared to ignoring the speech sounds because their speech processing skills are still developing, and thus are less automatic.
To manipulate attention, we instructed participants to carry out two different attention-related tasks. One condition drew attention to the auditory stream via a speech target (participants had to identify an infrequent /ba/ target interspersed among the vowels and an infrequent /da/). A second condition drew attention to the auditory stream via a non-speech target (identify a high tone target among the vowels and an infrequent low tone). The third condition drew attention away from the auditory events via a muted video. We predicted that the PN to the vowels would be larger in the conditions where attention was drawn to the auditory modality for all participants (Hansen & Hillyard, Reference Hansen and Hillyard1980; Näätänen, Reference Näätänen1990). Some studies suggest that bilingual experience enhances executive functions, including attentional control (Bialystok, Craik & Luk, Reference Bialystok, Craik and Luk2012). In this case, bilinguals and monolinguals would differ in the PN effect; however, it is unclear whether better attentional control would result in a larger or a smaller effect (but see Astheimer, Berkes & Bialystok, Reference Astheimer, Berkes and Bialystok2016).
2. Experiment I: Monolingual vs. bilingual adults
2.1 Methods
Participants
All participants were recruited from the New York metropolitan area through public postings on the internet or via letters sent to the homes (addresses obtained using Experian). After a telephone screening to determine eligibility based on language background, participants were scheduled to visit the lab, where they signed consent forms. Participants were screened for any history of speech-language, attention or neurological problems through interview and questionnaire. Hearing was screened at 25 dB hearing level from 500 to 4000 Hz; one monolingual adult was excluded because of a failed hearing screening.
Twenty-five adults were monolingual speakers of American English and 15 adults were bilingual Spanish–English speakers. The bilingual adults met the inclusion criteria of either being born in the US, or having arrived before five years of age, and having acquired both English and Spanish at this age or earlier.
The monolingual group consisted of 14 women and 11 men (mean age = 29.9, range = 19 to 40; SD = 7), and the bilingual group consisted of 11 women and 4 men (mean age = 28.6, range= 19 to 40; SD = 6.3). Participants completed a language background questionnaire (LBQ), the results of which are summarized in Table 1. Adult bilinguals’ mean reported age of first words in English was 36.5 months (SD = 20.2, range = 12-60), and first words in Spanish was 25.1 months (SD = 16.5, range = 12-60). Most participants indicated that English acquisition began later than Spanish acquisition.
Language background for adults calculated from 7-point scale. The number of questions used to calculate the response is shown in the column labeled “No. Questions”. The number of participants who responded in the range is provided (Mostly Spanish= 1 or 2; Equal = 3, 4, or 5; Mostly English = 6 or 7). Participants’ origin country: Puerto Rico (N = 4); Dominican Republic (N = 2), Colombia, Peru, Venezuela, Cuba, Spain, Guatemala (N = 1 each). Three did not report country of origin. Only one participant reported hearing more English than Spanish in the home. The mean self-rating for which language was spoken at home was 3.4, and the mean self-rating for which language was spoken in the community was 4.7. Literacy skills, however, favored English (5.8), which is consistent with participants growing up in New York City and attending public schools.

Participants rated amount of input in various contexts (e.g., home, community, school, media) on a seven-point scale (1 = all Spanish to 7 = all English, with 4 = balanced input) and proficiency on a five point scale. All scales were rescaled to a 7-point scale. The mean of the home input, school input and proficiency scores were used to compute a composite Spanish proficiency/use score, ranging from 1 to 7. The mean Spanish proficiency score for the adult bilinguals was 4.45 (SD = 1.5, range = 1.8–6.3).
Stimuli
The stimuli were two vowels; /ɪ/ as in American English ‘bit’, and /ε/ as in American English ‘bet.’ /ɪ/ and /ε/ constitute different phonemes in English, but not in Spanish: in Spanish [ε] is an allophone of Spanish /e/. In contrast, American English /ɪ/ is not perceived as a good exemplar of Spanish /i/ or Spanish /e/ and Spanish adult late learners of English perform at chance levels in a forced choice categorization task of American English /ɪ/ when the alternative is /ε/ (Hisagi et al., Reference Hisagi, Garrido-Nag, Datta and Shafer2015). The two tokens used in the experiment were taken from a continuum of nine vowels that were created by editing the first and second formant values of a re-synthesized token produced by an American-English female (Hisagi et al., Reference Hisagi, Garrido-Nag, Datta and Shafer2015). The bandwidth for each formant was maintained from the original recordings, which gave the stimuli a natural quality (timbre). The final speech stimuli were 50 ms in duration with a rise and fall time of 5 ms. F0 was maintained at 190 Hz. The third (F3) and the fourth (F4) formants were constant at 2174 Hz and 3175 Hz, respectively. The nine exemplars were made by increasing F1 and decreasing F2 in equal steps from /ɪ/ to /ε/. The two tokens selected for the experiment had mean center frequencies of F1 at 500 and 650 Hz and F2 at 2160 and 1980 Hz respectively, and were the same as those used in previous studies (Hisagi et al., Reference Hisagi, Garrido-Nag, Datta and Shafer2015; Shafer et al., Reference Shafer, Morr, Datta, Kurtzberg and Schwartz2005). In addition to the vowels, the experiment also included auditory stimuli that served as targets in an “attend-to-auditory-stream” condition (and were included but ignored along with all stimuli in an “ignore-auditory-stream” condition, see below). The attention task target stimuli were two 100-ms pure tone stimuli of 500 Hz and 2000 Hz, and two naturally recorded syllables /ba/ and /da/ that were 250 ms in duration. All stimuli were presented at 72 dB SPL sound field over two speakers.
Experimental design
The within-subject design of the experiment consisted of the factor CONDITION (standard vs. deviant) crossed with the ATTENTION conditions: Attend to the stimulus stream vs. Ignore the stimulus stream. In addition, the factor TARGET (speech vs. tone) was fully crossed even though there was no task associated with targets in the Ignore condition, resulting in a CONDITION (Standard vs. Deviant) x ATTENTION (Attend vs. Ignore) x TARGET (speech vs. tone) x LANGUAGE (monolingual vs. bilingual) design. The vowel and target stimuli were identical across the three tasks, but the task instructions differed. The vowel /ε/ (standard) was delivered for 79% of the trials, and /ɪ/ (deviant) was presented for 17% of the trials. The interspersed targets (speech and tones) for the Attend level comprised 4% of the total trials. The Attend-speech condition was designed to focus attention on spectral information in speech (higher resonances of the first, second and third formants); the participants were asked to respond to the /ba/ stimulus. To do this, they needed to reject [da], as well as the vowel stimuli. In the Attend-tone condition, the target was the 2000 Hz pure tone. The 500 Hz pure tone was included to give participants a choice between two tones. The stimuli were followed by a 600 ms inter-stimulus interval (ISI). The Attend-speech vs. Attend-tone was introduced to determine whether focus on speech versus non-speech auditory targets would modulate the automatic vowel discrimination.
Procedure
Each participant was asked to fill out a case history form designed to screen for any prior speech, language, hearing, psychological or neurological issues. All participants passed a hearing screening to ensure hearing was within normal limits. The participant was then seated in a comfortable chair in a sound-shielded audiometric booth in front of a PC monitor (17” screen) placed approximately 1 meter distant in the center. The stimuli were presented at a comfortable hearing level via two loudspeakers speakers that were suspended above the participants. One speaker was placed at a distance of 1.5 meters from the participant at a vertical angle of 45 degrees in the front while the other was 0.5 meters at 25 degrees behind the participant. Participants were monitored from outside the sound booth via a video camera. E-Prime software version 1.1 controlled stimulus delivery (Schneider et al., 2002).
The stimuli were delivered in 12 blocks of trials with a break after each block. A total of 200 deviants vs. 952 standards were presented in each of the three conditions. Forty-six target sounds (tones or syllables) were included in each Attend condition. Participants were tested on two different days. They received the Attend-tone and Ignore-tone condition (with non-attended tone targets) during one of the visits and the Attend-speech and Ignore-speech condition (with non-attended speech targets) during the other visit. The order of the tone and speech target conditions were counter-balanced across participants. All participants received the Ignore conditions of the experiment first on each day to prevent participants from having heightened awareness for the stimuli in this condition.
EEG acquisition
The electroencephalogram (EEG) was recorded with a 65-channel Geodesic Sensor Net with silver/silver-chloride (Ag/AgCL) plated electrodes using Net Station Software version 4.1. The electrodes were sheathed in sponge-encasings, which were dampened using a potassium chloride solution. The impedances of the electrodes were maintained below 40KΩ. Vertical and horizontal electrode montages near the eyes were used to monitor eye movement and eye blinks. The vertex served as the reference during data acquisition. The EEG was sampled at 250 Hz, and then amplified with a band pass filter of 0.1-30Hz using a 64-channel Net Amps 200.
EEG post-processing
The continuous EEG was segmented into single trial epochs of 850 ms duration, including a 200 ms pre-stimulus onset baseline period. After baseline subtraction, the segments were submitted to Netstation artifact detection procedures, for detecting eye blinks/movements (using a 70μV threshold) and bad channels. Trials with eye blinks or movements were marked for exclusion, and channels marked as bad were then replaced with the spherical interpolation. An average was computed for each stimulus type and condition (standard and deviant in Attend-speech, Attend-tone, Ignore-speech, Ignore-tone). The data were then re-referenced to the average of all sites.
2.2 Results
2.2.1 PCA pre-processing.
We first identified temporal and spatial “regions-of-interest” by conducting sequential temporo-spatial Principal Component Analysis (Dien, Spencer & Donchin, Reference Dien, Spencer and Donchin2003; Spencer, Dien & Donchin, Reference Spencer, Dien and Donchin1999, Reference Spencer, Dien and Donchin2001) using the PCA ERP toolbox (Dien, Reference Dien2010). The decomposition was conducted on the difference waves (deviant minus standard), so that the PCA focused on the temporal and spatial distribution of the experimental effects, rather than the obligatory components of the auditory evoked potential (Luck, Reference Luck2014). We then based selection of time windows and electrode regions in the voltage data on the latency of temporal and spatial factors uncovered by the PCA. This strategy avoids researcher bias in selecting electrodes and time samples for analysis, and mitigates against increased Type I error rate (Luck & Gaspelin, Reference Luck and Gaspelin2017).
The scree plot test and the parallel test was used to determine the number of components to retain (Horn, Reference Horn1965). This retained 11 initial temporal factors, which accounted for 91% of the variance; the PCA was then rerun limited to 11 factors, which were rotated using the covariance matrix (without Kaiser normalization) to simple structure, using PROMAX (k = 3) (Hendrickson & White, Reference Hendrickson and White1964; Richman, Reference Richman1986; Tataryn, Wood & Gorsuch, Reference Tataryn, Wood and Gorsuch1999). We then limited analysis to temporal factors that accounted for at least 5% of the total variance. Only the first four temporal factors met these criteria. Visual inspection of the topographical distribution of these temporal components revealed that only two of the four factors corresponded to the typical time course and spatial distribution of the MMN (208 ms, TF2) and the LN (644 ms, TF1).
Each temporal factor was decomposed into its spatially independent components using ICA (Bell & Sejnowski, Reference Bell and Sejnowski1995), following the same procedure for factor reduction as for temporal PCA. After inspecting the scree plot, the ICA was limited to 6 spatial factors. The combined or sequential temporo-spatial PCA results in one factor score per subject and condition, which represents the weighted average of all electrodes and time samples for each underlying temporo-spatial factors (Dien, Reference Dien2012; Dien & Frishkoff, Reference Dien, Frishkoff and Handy2005) and constrains selection of time windows and electrode regions for the observed ERPs in the data.
2.2.2 Mismatch Negativity
The time course of the MMN factor was identified as the second temporal PCA factor TF2, peaking at 208 ms. The electrode region for MMN was identified as the third subfactor of the spatial decomposition of this temporal factor (TF2SF3), which had a central distribution typical of the MMN. A subset of electrodes with factor loadings exceeding 0.6 was selected as the most highly weighted electrodes and used to represent the MMN (a “virtual channel”) in the voltage data (the blue region of the topoplot in Figure 1). Figure 1, top left panel shows the main difference wave of TF2SF3 expressed as microvolt-scaled factor scores; the top right panel shows the topographical distribution of the factor score difference wave; and the bottom panel shows the mean voltage for the MMN electrode region with deviants, standards and the difference waveforms for monolingual and bilingual adults.
Top row, left panel: Factor score main effect difference wave. Right panel: Spatial distribution of TF2SF3 factor score difference wave. Lower row, left panel: main effect MMN in monolinguals, average of TF2SF3 electrode region; right panel; MMN main effect for bilinguals.

We analyzed the raw voltage data constrained by the temporal and spatial properties of TF2SF3 as follows: first, the time window 152-244 ms was constructed by selecting the time samples in the TF2 factor with loadings greater than 0.6. The electrode region of EGI sites E4, E5, E17, E18, E22, E30, E43, E47, E54, E55, E58, E65 was then selected using electrodes with TF2SF3 factor loadings greater than 0.6 (see above); corresponding to the dark blue region in Figure 2. A mean voltage difference score (deviant minus standard) for this time/space region was computed for each subject and cell, and submitted to the same mixed factorial ANOVA as for the factor score analysis. The statistical results matched the factor score analysis, with a significant intercept (F(1,38) = 44.9, p < .00001) (i.e., a significant mismatch effect, as the dependent measure was a difference wave), and a significant ATTENTION x TARGET TYPE interaction (F(1,38) = 4.21, p < .05). The interaction was that speech targets resulted in greater MMN in the Attend condition than in the Ignore condition (cf. Figure 2).
MMN difference waveforms showing the interaction between attention and target type on the mismatch effect. The interaction plot shows that the MMN to the unattended stimulus stream is enhanced when subjects are tracking speech targets, but not when subjects are tracking non-speech targets. Left panel shows distribution of MMN across subjects and conditions; lower panel shows the difference waveforms under the different attention and target conditions. Topoplot shows the general distribution of the difference wave at its peak (224ms). The waveforms represent the average voltage in the raw data for the PCA-determined electrode region for MMN.

There was no other main effect or interactions; specifically, no interactions involving group.
The only effect of attention on the MMN was that when subjects tracked the stimulus stream for target stimuli, the MMN was enhanced by tracking speech-like targets, but not by non-linguistic targets, and this effect on the MMN was the same for monolinguals and bilinguals. Thus, attention to speech properties in the signal led to greater MMN for both groups. There was no difference between adult monolinguals and adult bilinguals in the MMN or in the speech-attention related enhancement of the MMN response. There was also no significant correlation between the mean MMN across conditions and the participants’ Spanish proficiency/use scores (Spearman rank order correlation, N = 14, r = 0.14, t(N-2) = 0.51, p = 0.6).
2.2.3 Late Negativity
The Late Negativity (LN) was captured by the first temporal factor TF1, peaking at 644 ms, and which also accounted for the largest amount of variance in the data. Examining the 6 spatial sub-factors within temporal factor 1, the first sub-factor TF1SF1 best matched the observed anterior negativity in the undecomposed grand average data. The remaining 5 spatial factors did not have topographical distributions indicative of cognitive ERPs and were discarded from further analysis. Figure 3, top panel, shows the temporal and spatial distribution of the main effect difference wave for the LN temporo-spatial factor, and the lower panel shows the raw voltage data averaged for the electrode region defined by the spatial factor (as above by selecting electrodes with factor loadings greater than 0.6), by language group.
The top, left panel shows the difference waves for the factor scores for monolinguals vs. bilinguals in the Late Negativity ERP; the right top panel shows the spatial distribution of this main effect difference wave. The bottom row shows the raw voltage average of TF01SF1 electrodes exceedings 0.6 factor loadings (channels 6, 7, 10, 11, 14) for monolinguals (left panel) vs. bilinguals (right panel).

Bilinguals clearly show greater negativity than monolinguals in this ERP component.
We next used the temporal and spatial distribution of TF1SF1 to constrain the selection of a region of interest from the undecomposed voltage data, and constructed an electrode region defined by electrodes that had factor loadings greater than 0.6 (the dark blue area in Fig 3; specifically electrodes E6, E7, E10, E11, E12, E14), and the 376-648 ms time window, defined by these time samples in TF1 that exceeded 0.6. The average difference-wave voltage for this time window over this electrode region was used as the dependent measure in an ANOVA with LANGUAGE, ATTENTION and TARGET as factors. The statistical analysis mirrored the findings of the factor score analysis, resulting in a main effect of intercept, that is, the LN (F(1,38) = 16.3, p < 0.001); and a main effect of LANGUAGE (F(1,38) = 5.6, p < 0.05), in which the effect was significantly greater for the bilinguals. In the voltage analysis, the ATTENTION x TARGET interaction reached significance in the voltage data analysis (F(1,38) = 4.17, p < 0.05), driven by a greater LN in the condition where participants were tracking non-speech target tones; that is, in this condition, the difference in brain response to deviants and standards were enhanced, compared to when participants were tracking speech targets (i.e., the opposite of the ATTENTION x TARGET effect observed in the MMN).
2.2.4 Processing Negativity
Finally, we examined whether the two adult groups differed in the Processing Negativity (PN) component. In order to isolate the temporal and spatial region for statistical analysis of the N1, we first conducted a temporo-spatial PCA limited to the standards in the Attend conditions and the standards in the Ignore conditions. We retained 8 temporal factors, the three first of which accounted for at least 5% of the variance. The fourth temporal factor TF4 (accounting for 5% of the variance) matched the temporal and spatial distribution of the N1 peak (120 ms) observed in the grand average voltage data. In the next spatial step, we retained 5 spatial factors. The second spatial factor TF4SF2 had a topography that matched the N1 part of the Auditory Evoked Potential (AEP; see Figure 4, top panel).
Top panel: main effect waveforms for standards under Attend and Ignore conditions; superimposed on the N1 temporo-spatial factor; right top panel shows the distribution of the main effect difference scores (Attend minus Ignore). Lower panel shows the mean voltage for the electrode region isolated by the PCA (E22, E29, E30, E34, E42, E43, E47) for monolinguals vs. bilinguals with the PN difference wave in green.

We next analyzed the voltage data constrained by the factor analysis. The time window 104-148 ms was defined by the samples with TF4 and the electrode region (E22, E29, E30, E34, E42, E43, E47; (a region slightly posterior from Cz) was selected where the factor loadings exceeded 0.6. The same ANOVA was run with these time/space voltage means as dependent measures. This resulted in a main effect of ATTENTION (F(1.38) = 19.7, p < 0.0001); and an interaction ATTENTION x LANGUAGE (F(1,38) = 5.7, p < 0.05), such that bilinguals had a greater difference between Attend and Ignore: that is, a significantly larger amplitude PN than the monolinguals. Finally, the voltage analysis also showed an interaction between Attention and Target type, (F(1,38) = 9.7, p < 0.01), such that PN to the standard vowels was greater when subjects attended to tones.
2.3 Discussion
The adult monolingual and bilingual groups did not differ in MMN amplitude, and the MMN was not modulated by attention to or away from the speech. Both groups showed a slightly larger MMN in the Attend condition when the target was a speech sound. This suggests that processing of the vowel contrast /ɪ/ versus /ε/ is native-like for these early bilinguals. On the other hand, whereas both adult groups exhibited a LN to the deviants in both the Attend and Ignore conditions, the LN amplitude was significantly larger for the bilingual group. We also observed a bilingual effect on the PN. Both groups showed increased negativity to the (standard) stimuli in the Attend compared to the Ignore condition, but the PN amplitude was greater for the bilinguals. This suggests that bilinguals may be allocating more resources to processing the stimuli in the Attend condition than the monolingual group.
Another surprising finding was that the LN had greater amplitude in the Attend-tone condition compared to Attend-speech condition for both monolinguals and bilinguals. LN is an index of reorienting attention (Ceponiene et al., Reference Ceponiene, Lepistö, Soininen, Aronen, Alku and Näätänen2004). It may indicate greater effort in discriminating speech (vowel stimuli) when auditory attention is directed towards non-speech targets (tones).
3. Experiment II: Monolingual vs. bilingual children
Experiment II was identical to Experiment I in all respects, except the participants were monolingual and bilingual children. For this experiment, parents or guardians provided written consent for participants and completed the case histories. The goal of this experiment was to examine the maturation of neural responses to the English vowel contrast in relation to the attention manipulation.
3.1 Methods
3.1.1 Participants
Fifteen monolingual children (6 males and 9 females, mean age= 8.9, range 9-11; SD = 0.9) and 15 bilingual children (10 males and 5 females, mean age = 9.3, range 9-11; SD = 0.85) were tested. Except for one child born in the UK, the bilingual children were born in the US.
Parents completed a Language Background Questionnaire regarding early language exposure (simultaneous, sequential), when the child's first words in English and Spanish were observed, schooling (preschool, kindergarten, etc.) and amount of Spanish versus English use in the child's environment. (This questionnaire was incomplete for one child.) Table 2 summarizes the results of the Language Background Questionnaire.
Language background for children calculated from 7-point scale. The number of questions used to calculate the response is shown in column No. Questions. The number of participants who responded in the range is provided. (Mostly Spanish= 1 or 2; Equal = 3,4, or 5; Mostly English = 6 or 7). Three of the children received more input in Spanish than English (values < 3.5), nine showed balanced input (values between 3.5 and 5) and two showed more English than Spanish input (values greater than 5). Twelve out of the 15 children reported that his/her communication was best in English. The majority of children showed more Spanish than English or balanced input at home, whereas in other contexts, they received equal or more English than Spanish.

English language abilities were tested for all children using Clinical Evaluation of Language Fundamentals, Fourth Edition (CELF-4) (Semel, Wiig & Secord, Reference Semel, Wiig and Secord2004) and Peabody Picture Vocabulary Test, 3rd edition (PPVT-3) (Dunn & Dunn, Reference Dunn and Dunn1997). Spanish language abilities were tested for bilingual children with Clinical Evaluation of Language Fundamentals-Spanish, Fourth Edition (CELF-4) (Wiig, Semel & Secord, Reference Wiig, Semel and Secord2006) and Test de Vocabulario en Imagenes Peabody (TVIP) (Dunn & Dunn, Reference Dunn and Dunn1986). The mean first words in English use was reported as 15.6 months (SD = 10.6, range = 7-36), and the mean first words in Spanish use was 21.7 (SD = 17.6, range = 8-60). The mean Spanish use score was calculated similarly to the calculation for adults, using home environment (1-7 point scale), order of acquisition (Spanish first = 1, simultaneous = 4, English first = 7) and preschool (Spanish = 1, both = 4, English = 7) showing a mean of 4.39 (SD = 1.31, range = 2.26–6.4). The mean and standard deviations are shown in Tables 3a and 3b. All children scored in the normal range (within 1 SD, 15 points) in at least one language. Three of the four children receiving more English than Spanish in the home also showed weak Spanish scores (< 85).
Standard test scores.

The Spearman rank order correlation between Spanish use score and Spanish CELF scores was significant (N = 13, r = −0.72, t(N-2) = −3.42, p < .01). The correlations between Spanish use score and the TVIP (Spanish version of the PPVT) (N = 13, r = −0.37, t(N-2) = −1.35, p = 0.2), and the correlation between the Spanish use score and the English CELF (N = 14, r = 0.1, t(N-2) = 0.35, p = 0.73) were not significant.
3.1.2. Procedure, equipment and stimuli
The procedure and stimuli were identical to that of the adults.
3.2 Results
The children showed the typical pattern of ERP responses (AEPs) to auditory stimuli, with a large fronto-central positivity (P100), followed by a negativity (N250) (Shafer et al., Reference Shafer, Morr, Kreuzer and Kurtzberg2000; Shafer et al., Reference Shafer, Yu and Datta2010). As with the adult data, we conducted a temporal PCA on the difference waves (deviants – standard), with LANGUAGE (monolingual, bilingual), ATTENTION, and TARGET as conditions. The temporal PCA (PROMAX rotation, covariance matrix, k = 3) retained 14 temporal factors, accounting for 93% of the total variance. Of these, only the first three accounted for more than 5% of variance. TF1 accounted for 47% of the variance, with the highest loading at 556 ms. The topography and time course of TF1 was very similar to the first temporal factor corresponding to the LN in the adult data. TF2 accounted for 11% of the variance, and corresponded temporally with the negative peak of the difference wave in the grand average, at 280 ms. TF3 peaking at 164 ms and accounting for 7% did not have a clear, interpretable spatial distribution. Statistical analysis of its factor scores resulted in no significant effects, and it was therefore not analyzed further. Spatial ICA was conducted on TF1 and TF2, resulting in, six retained spatial factors. These time windows and electrode regions were used to compute single subject averages for each condition in the undecomposed data.
3.2.1 Mismatch negativity
TF2, peaking at 280 ms, accounted for the earliest latency mismatch effect for children (see Figure 5). The first spatial sub-factor of TF2 closely matched the difference score topographical distribution in the raw data (not shown). Figure 5, top panel shows the time course of the difference wave in the factor analysis and the topographical scalp distribution of this factor in voltage. An electrode region was constructed using electrodes E2, E3, E4, E6, E7, E8, E9, E12, E13, E58, E62 with factor loadings exceeding 0.6 in TF2SF1; the lower panel in Figure 5 displays no apparent difference between the two groups of children.
Upper panel: Main effect factor waveform for the first negative peak and spatial distribution of this effect in the factor. Lower panel: mean waveforms for each child group for standard and deviants computed for the region in blue in the topographical plot.

The mean voltage of the undecomposed data in the time window 244-312 ms was calculated from EGI electrode sites E2, E3, E4, E6, E7, E8, E9, E12, E13, E58, E62 (with factor loadings exceeding 0.6 for TF2SF1) for each subject and condition and were analyzed in a repeated measures ANOVA with LANGUAGE x ATTENTION x TARGET. Results revealed a main effect of intercept (F(1,28) = 7.9, p < .01); as the dependent measures were difference scores (deviant minus standard), this translates into a main effect of mismatch. No other main effects or interactions were observed. The same analysis conducted after excluding four bilingual child participants who were predominantly English in their usage, based on parent report on the LBQ, did not change these statistics.
We also examined whether the MMN-effect (mean across all four conditions) correlated with a Spanish use/proficiency score (standard language scores were transformed and added to the composite use/proficiency measure described in the methods on the following scale: Spanish > English standard scores by more than 1 SD (equivalent to 15) = 1; English > Spanish standard scores by more than 1 SD = 7; Spanish = English scores, within 1 SD = 4). A Spearman rank order correlation showed no significant relationship between these measures (r = −0.32, t(N-2= -1.22, p = 0.24).
3.2.2 Late negativity
The temporal PCA identified the later part of the waveform as a separate event. Figure 6 below shows the main effect of the Attend variable in the first spatial sub-factor of this temporal factor, along with its spatial scalp distribution. As is apparent, there is a clear effect of attention in this later interval but no difference between monolingual and bilingual children. The lower panel in Figure 6 shows the electrode region calculated from the electrodes with factor loadings greater than 0.6 in the spatial factor, and also shows no apparent difference between the groups.
Late Negativity in child groups. The left top panel shows the factor waveform by ATTENTION and LANGUAGE; right top panel shows the scalp distribution of the factor. Lower panels show the mean waveforms for the spatial region over time by the standard and deviant stimulus conditions along with the difference waveform.

For the undecomposed voltage data, we calculated the mean of electrodes E6, E7, E8, E10, E11, E12 in the time-range 400-648 ms (those times and sites with factor loadings exceeding .6). Again, only a main effect of intercept was observed (F(1,28) = 9.03, p < .01).
3.2.3 Processing negativity
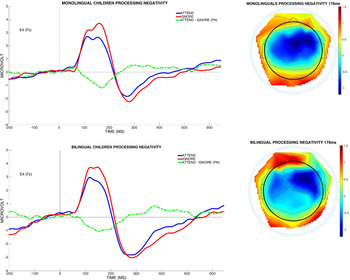
Figure 7 shows the responses to standards at Fz for the two groups under the two ATTENTION conditions, along with the scalp topography of the difference.
Waveforms for standards at Fz for Attend vs. Ignore conditions and the spatial distribution of the difference for monolingual vs. bilingual children.

In order to capture the PN directly, we subtracted the response to the standards in the Attend condition from the response to the standards in the Ignore condition as input to a temporo-spatial PCA followed by voltage analysis constrained by the factor solution. The initial temporal PCA retained 8 factors, but only the first three accounted for more than 5% variance (TF1, 644 ms: 60%; TF2, 264ms: 10%; TF3, 168 ms, 9%). The third temporal factor TF3 at 168 ms matched the temporal and spatial distribution of the difference between attended and ignored standard stimuli observed in the voltage data. Four spatial factors were retained in the spatial step; the second spatial factor TF3SF2 had a distribution similar to that of adults and was selected for analysis, see Figure 8.
Processing Negativity factor waveforms and scalp distribution (upper panel) and voltage waveforms for the ICA-defined region by LANGUAGE group.

For analysis, we chose the time window during which temporal factor loadings exceeded 0.6 (100-216 ms), and electrodes that exceeded 0.5 from the spatial decomposition (electrodes E5, E17, E18, E21, E22, E25, E29, E30, E42, E43, E47, E54, E55, Cz). A repeated measures ANOVA with LANGUAGE as between-subject resulted in a significant intercept (F(1,28) = 25.06, p < 0.0001), but no main effects or interactions. In other words, the children exhibited a clear PN, but there was no difference between monolingual and bilingual children. Excluding the four bilingual subjects who were predominantly English in their usage did not change these statistics.
3.3 Discussion
Children exhibited the same pattern of two ERP responses to mismatch as adults: an MMN and a LN. The onset latency of the MMN effect, however, was later (280 ms) than in adults (208 ms). A later MMN latency for children than for adults is consistent with previous studies (Shafer, Morr, Kreuzer & Kurtzberg, Reference Shafer, Morr, Kreuzer and Kurtzberg2000) showing maturational effect in the MMN. There was no difference between monolingual and bilingual children in the MMN, and no effect on MMN by attention condition or target stimulus. The LN in children had a similar distribution and time course to that of adults. However, the LN was not modulated by attention in the children. Similarly, both groups of children exhibited significant Processing Negativity (PN) when attending to the auditory modality compared to ignoring the auditory stimuli and watching the muted movie in the Ignore condition. However, unlike the adult groups, the two groups of children did not differ in the amplitude of the PN.
4. General discussion
Our first aim was to replicate and extend findings from our previous study of bilingual speech processing. In Hisagi et al. (Reference Hisagi, Garrido-Nag, Datta and Shafer2015), we had observed a smaller MMN to the English /ɪ/ versus /ε/ contrast in Spanish learners of English, whether they learned English at or before five years (early Spanish–English bilinguals) of age or after 14 years (late Spanish–English bilinguals) of age. The current study did not replicate this finding. Specifically, early Spanish–English bilinguals showed an equivalent amplitude MMN to monolingual English speakers. It is possible that this discrepancy reflects a difference in our samples. As in the current study, all participants in Hisagi et al. (Reference Hisagi, Garrido-Nag, Datta and Shafer2015) reported learning both languages before 5 years of age, but we did not obtain language use ratings in various settings. In the current sample, we used a much more detailed questionnaire. We know that all but two of the adult and two child participants had been exposed to English by preschool. The adult bilinguals generally showed greater use of Spanish at home and in the residential community, but all reported more use of English in school and literacy contexts. The child bilingual participants, however, were evenly split with 6 favoring Spanish in the home and 8 favoring English. A substantial number of our participants initially were exposed only to Spanish, but most report English as the dominant language. It is possible that the early bilinguals in Hisagi et al. (Reference Hisagi, Garrido-Nag, Datta and Shafer2015) favored Spanish as adults to a greater extent than the early bilinguals in the current study. Age of acquisition is unlikely to be a factor, since the adults in the two studies report similar experience.
Our second aim was to examine whether bilingual children differed from their monolingual peers on neural measures of automatic speech sound processing and attentional resource allocation. We found that they were identical to monolinguals in all respects. A number of studies of bilingual children suggest that it can take four and a half to six and a half years of immersion in school to fully acquire a second language (Paradis & Jia, Reference Paradis and Jia2017). Previous studies using neural measures have shown that one to two years of second language experience in four- to six-year old children is insufficient to lead to native-like responses (Rinker et al., Reference Rinker, Alku, Brosch and Kiefer2010, Reference Rinker, Shafer, Kiefer, Vidal and Yu2017; but see Cheour et al., Reference Cheour, Shestakova, Alku, Ceponiene and Näätänen2002 and Peltola et al., Reference Peltola, Kuntola, Tamminen, Hämäläinen and Aaltonen2005, Reference Peltola, Tuomainen, Koskinen and Aaltonen2007), but the children in those studies only had one year of public school (beginning at five years of age in the US and 6 years of age in Germany). The current study is consistent with these findings, in that the children in our current sample had four to six years of experience with English in the school system, and also reported to be using mostly English in the residential community, whereas Spanish was used mostly at home. Thus, our current sample of children might have had more extensive experience with English than the participants reported on in Hisagi et al. (Reference Hisagi, Garrido-Nag, Datta and Shafer2015).
Our third goal was to examine the degree to which attention modulated the MMN index of speech sound discrimination, and whether any attentional effects interacted with the monolingual/bilingual difference. In Hisagi et al. (Reference Hisagi, Garrido-Nag, Datta and Shafer2015), the smaller MMN to the English vowel contrast in bilinguals suggested that they were not fully automatic in discrimination of this vowel contrast. A goal of the current study was to find out whether directing the L2 participants’ attention to the stimuli would enhance their MMN response. We observed an increase in MMN amplitude to the vowel contrast when the adult participants attended to the speech target, which suggests that the vowel contrast used in this study was sufficiently difficult to benefit from attention. However, this effect was observed for both language groups: that is, being bilingual afforded no advantage. We also found an increase in LN when both groups of adults attended to tone targets, which suggests that MMN and LN are affected differently by attentional modulation.
Another goal was to examine the interaction between MMN, attention, and being bilingual vs. monolingual. We observed no effect of attention on the MMN. However, adult bilinguals exhibited a significantly larger PN amplitude than monolinguals. This suggests that adult bilinguals are more attentive to the auditory environment (Garcia-Sierra et al., Reference Garcia-Sierra, Ramirez-Esparza, Silva-Pereyra, Siard and Champlin2012; Peltola et al., Reference Peltola, Kuntola, Tamminen, Hämäläinen and Aaltonen2005, Reference Peltola, Tuomainen, Koskinen and Aaltonen2007), and allocate more resources in order to achieve the same linguistic efficiency; this finding may be related to the greater cognitive flexibility claimed for bilinguals than their monolingual counterparts (Molnar et al., Reference Molnar, Polka, Baum and Steinhauer2014). This inference is also supported by the fact that adult bilinguals had a significantly larger LN response than adult monolinguals, suggesting a greater involuntary attention shift toward vowel discrimination. This pattern is similar to the finding of Ortiz-Mantilla et al. (Reference Ortiz-Mantilla, Choudhury, Alvarez and Benasich2010). Thus, the enhanced “bilingual LN” might indicate that bilingual listeners more often need to make additional decisions about the speech: namely, what the target language is. It also converges with other recent neurophysiological findings of increased attentional control mechanisms developing in bilingual children, seen as a ‘spill-over’ effect into non-verbal tasks (Arredondo et al., Reference Arredondo, Hu, Satterfield and Kovelman2017), and more top-down auditory attentional control for bilingual adults relative to monolinguals (Krizman, Skoe, Marian & Kraus, Reference Krizman, Skoe, Marian and Kraus2014). These studies suggest that the need for increased attentional control in the process of selecting the target language may underlie these neural patterns.
Turning to Experiment II, we observed no effect of attention on children's MMN amplitude, but, unlike adults, we also did not observe an effect of attention manipulation on the children's LN. The failure to see this pattern in the children may indicate immaturity, or that the children are more English-dominant than the adults. This finding matches our previous study of 8-10 year-old children using the same stimuli (but delivered over ear-insert phones) (Shafer et al., Reference Shafer, Morr, Datta, Kurtzberg and Schwartz2005). Specifically, attention to the speech stimuli did not affect MMN amplitude. Even so, the reason for enhanced MMN in adults when attending to speech targets, but not in children, remains unaccounted for. We do know that grade school children weigh speech cues differently from adults (Nittrouer & Miller, Reference Nittrouer and Miller1998), but we would expect attention to have a greater effect for children than adults.
The children also showed the PN effect to the attention conditions; but again, no difference was found between the monolingual and bilingual children. These findings suggest that three- to five years of English input in the NYC public schools for the bilingual Spanish–English children was sufficient to allow for native-like speech processing skills in English. The later timing of the mismatch responses, however, indicates that speech processing is not fully mature in this age group.
We introduced three possible models of bilinguals’ speech perception. Our findings are clearly inconsistent with the model that claims that bilinguals compromise between the two phonological systems (Cutler et al., Reference Cutler, Norris and Williams1987; Snijders et al., Reference Snijders, Kooijman, Cutler and Hagoort2007), considering that we observed native-like L2 processing. Our results are consistent with the other two models (Elman et al., Reference Elman, Diehl and Buchwald1977; Gonzales & Lotto, Reference Gonzales and Lotto2013; Williams, Reference Williams1977), but cannot fully address which of the two models is better. We only had data for an L2 contrast and, thus, it is possible that our cohort of bilinguals favored English over Spanish. It is also possible that the robust L2 speech processing indicated that the early bilinguals we tested were able to adjust their phonological contrasts based on linguistic contexts (see Casillas & Simonet, Reference Casillas and Simonet2018). We did not attempt to manipulate context, and the experimental setting decidedly favored English, with the consent and instructions carried out in English. Future studies that test processing in both Spanish and English and that manipulate context will be necessary to select between these models. Finally, the lack of a relationship between the neural discriminative measure, MMN and our language use/proficiency measure may be the result of fairly high English proficiency for all our participants. It will be important in a future study to increase the number of participants and examine a wider range of proficiency levels and amount of use in English and Spanish to further explore how these factors influence speech processing in early bilinguals.
The current study did not address whether these bilinguals had maintained L1 phonological categories. This limitation could be addressed by comparing mismatch responses between Spanish monolinguals and bilinguals to a native Spanish contrast that is not found in English, although a Spanish consonant contrast might serve as a better test, given that the five Spanish vowels are assimilated into five non-overlapping English phoneme categories. Alternatively, we could test a Mandarin–English bilingual population on the Mandarin /i/-/y/ versus our English /ɪ/ to /ε/ (which is difficult for Mandarin listeners), since we know monolingual English speakers show poorer discrimination of the Mandarin contrast (Yu, Shafer & Sussman, Reference Yu, Shafer and Sussman2017).
In conclusion, our results showed that adult and child bilinguals who began acquiring English by five years of age show native-like neural discrimination of a spectrally-difficult English vowel contrast. However, they also showed differences from monolinguals in neural measures that are likely to be related to attentional processes. These findings support the claim that bilingual experience leads to differences in executive functions, such as attentional control.
Author ORCIDs
Arild Hestvik, 0000-0003-4561-7584; Valerie Shafer, 0000-0001-8551-1878.
Acknowledgements
This research was funded by the National Institutes of Health, National Institute of Child Health and Human Development grant HD46193 (Valerie Shafer, P.I.)