INTRODUCTION
The LMC14 National Laboratory is equipped with the ARTEMIS (Accélérateur de Recherche en science de la Terre, Environnement, Muséologie, Implanté à Saclay, i.e. accelerator for research in earth science, environment, museology, located in Saclay) 14C AMS facility and the associated benches for 14C sample preparation and graphitization (Cottereau et al. Reference Cottereau, Arnold, Moreau, Baqué, Bavay, Caffy, Comby, Dumoulin, Hain, Perron, Salomon and Setti2007). The ARTEMIS AMS facility is dedicated to 14C measurements. The laboratory routinely prepares, graphitizes and measures over 3500 samples a year. In the last 17 years, the LMC14 has analyzed and dated about 59,000 samples. Quality control of the measurements is a daily concern. Quality control procedures are applied at each stage of the sample route, namely the chemical preparation, graphitization, measurement and analysis of dating data. Routine procedures for the chemical preparation depend on the sample material (carbonate, organic matter, water) (Dumoulin et al. Reference Dumoulin, Caffy, Comby-Zerbino, Delqué-Količ, Hain, Massault, Moreau, Quiles, Setti, Souprayen, Tannau, Thellier and Vincent2013, Reference Dumoulin, Comby-Zerbino, Delqué-Količ, Moreau, Caffy, Hain, Perron, Thellier, Setti, Berthier and Beck2017a). Some materials have required particular technical and methodological developments for carbon extraction, such as irons (Leroy et al. Reference Leroy, L’Héritier, Delqué-Količ, Dumoulin, Moreau and Dillmann2015; Delqué-Količ et al. Reference Delqué-Količ, Leroy, Pagès and Leboyer2017), freshwater and seawater (Dumoulin et al. Reference Dumoulin, Pozzato, Rassman, Toussaint, Fontugne, Tisnérat-Laborde, Beck, Caffy, Delqué-Količ, Moreau and Rabouille2018), bones (Dumoulin et al. Reference Dumoulin, Messager, Valladas, Beck, Caffy, Delqué-Količ, Moreau and Lebon2017b) and paint pigments (Valladas et al. Reference Valladas, Quiles, Delqué-Količ, Kaltnecker, Moreau, Pons-Bronchu, Vanrell, Olice and Delestre2017; Beck et al. Reference Beck, Messager, Coelho, Caffy, Delqué-Količ, Perron, Mussard, Dumoulin, Moreau, Gonzalez, Foy, Miserque and Bonnot-Diconne2019).
The LMC14 uses two “routine benches” for sample graphitization, in the mass range of 0.40 mg to 2.00 mg, using hydrogen to reduce the CO2 to graphite (Vogel et al. Reference Vogel, Southon, Nelson and Brown1984). Routine standards of 1 mg of carbon are graphitized on these benches for data normalization. Smaller mass samples can be graphitized on these benches, but the reduction can fail due to inappropriate reduction volumes (reduction yield drop). The LMC14 team developed a “dedicated bench” for the graphitization of microsamples with a smaller reduction volume (Delqué-Količ et al. Reference Delqué-Količ, Caffy, Comby-Zerbino, Dumoulin, Hain, Massault, Moreau, Quiles, Setti, Souprayen, Tannau, Thellier and Vincent2013a, Reference Delqué-Količ, Comby-Zerbino, Ferkane, Moreau, Dumoulin, Caffy, Souprayen, Quilès, Bavay, Hain and Setti2013b). The purpose of this dedicated bench is to prepare and measure unknown microsamples with a high quality by using a dedicated microsample protocol (see the second part of the article). It uses a chemical water trap based on magnesium perchlorate to process the microsamples, firstly, because the chemical water trap is effective in retaining the little water released by the microsamples during the reaction, and secondly, for convenience as the facility does not allow the utilization of cryogenic traps (Santos et al. Reference Santos, Southon, Druffel-Rodriguez, Griffin and Mazon2004). The mass range on this bench starts from 0.30 mg down to a few micrograms. The matching size method is used for any unknown microsample graphitized on this bench (Brown and Southon Reference Brown and Southon1997; Mueller and Muzikar Reference Mueller and Muzikar2002; Santos et al. Reference Santos, Southon, Griffin, Beaupre and Druffel2007). Dedicated primary standards are done on this bench with a mass of 0.30 mg and size-matched primary standards are processed to accompany unknown microsamples. For “routine” and “dedicated” benches, the sample is directly pressed in a National Electrostatics Corporation (NEC) aluminum cathode after each graphitization process and then stored awaiting measurement. All the samples processed at the LMC14 are measured on the NEC ARTEMIS AMS facility. All the measurement results are given with a propagated error given at one standard deviation (68% confidence).
The purpose of this status report is to show the quality of the preparation and measurement at the LMC14 due to rigorous protocols, and to detail the simple protocol adopted to correct the measurement of small and ultra-small samples. This paper will particularly describe the methodology adopted for blank subtraction based on accumulating the measurements of blanks with different masses and fitting on the entire data set. This regression curve is the key to using the appropriate correction on each sample according to its mass. The first section of this paper presents the quality control procedures for routine measurements (using “routine graphitization benches”). The procedure dedicated to microsamples is described in the second section (using the “dedicated microsample graphitization bench”). This paper updates the previous status report published in 2013 (Moreau et al. Reference Moreau, Caffy, Comby, Delqué-Količ, Dumoulin, Hain, Quiles, Setti, Souprayen, Thellier and Vincent2013).
QUALITY CONTROL OF THE ROUTINE MEASUREMENTS
The quality approach for 14C dating at LMC14 is constantly improved to maintain a quality level of analysis worthy of international standards (Moreau et al. Reference Moreau, Caffy, Comby, Delqué-Količ, Dumoulin, Hain, Quiles, Setti, Souprayen, Thellier and Vincent2013). In this section, the quality control procedures used for routine samples are discussed.
Methods and Tools Used at the LMC14
Quality control involves preparing samples that will accompany the measurement of unknown samples, in order to carry out accurate data analysis. These accompanying samples are:
-
1. Primary standards, Oxalic Acid II (OxII): IAEA standard for data normalization (1 every 10 samples);
-
2. Background: blank sample of the same material as for the sample to be measured and prepared under the same conditions. Unknown samples are grouped in batches of 30 or 40. One blank for each different type of sample is inserted in the batch;
-
3. Secondary standards: known-age samples blindly measured to control any bias in the analysis. They come from the international intercomparison campaigns of 14C laboratories (Scott Reference Scott2003). At LMC14, samples from the Fourth International Radiocarbon Intercomparison (FIRI, Rozanski et al. Reference Rozanski, Stichler, Gonfiantini, Scott, Beukens, Kromer and van der Plicht1992) campaign are used. Approximately 1 secondary standard is analyzed for 20 samples or 2 secondary standards per batch from 30 to 40 samples.
The quality approach is implemented daily at LMC14. A homemade database has been created to monitor the evolution of measurement results according to different parameters. This database has an essential role within the laboratory groups in charge of each stage of the sample route. It is used on the one hand to plan the tasks of each successive step followed by every sample and, on the other hand, to provide an overview of past, present and future measurements. A data sheet is created for each sample. It contains the general information about the sample and is filled in at each stage. Each relevant parameter is recorded and comments can be added. In addition, the database includes an analysis section where the results of raw data reduction and the normalization to the primary standards achieved by the NEC abc software are saved. After these steps, an appropriate background level for each sample is subtracted to obtain the final rounded radiocarbon (14C) age (Stuiver and Polach Reference Stuiver and Polach1977; Mook and van der Plicht Reference Mook and van der Plicht1999). This homemade database makes it possible to return to any data processing at any time.
One of the most useful parameters is the date of the sample graphitization. It enables the evolution of the blanks and secondary standards to be monitored over the years and the sample graphitization line cleaning operations to be optimized. Other parameters are reported to control the quality of the results for their validation such as the graphitization yield, the mass of carbon, and the 12C3+ current with the 12C transmission during the AMS measurement. Subsequently, the validated raw results can be corrected according to their nature, storage time (time between graphitization and measurement) and mass of carbon.
Monitoring the Evolution of Accompanying Samples
The chemical preparation protocols of the samples were developed using the know-how acquired by the laboratory staff throughout the years of operation. An update of these protocols was published in a previous article (Dumoulin et al. Reference Dumoulin, Comby-Zerbino, Delqué-Količ, Moreau, Caffy, Hain, Perron, Thellier, Setti, Berthier and Beck2017a).
The quality approach consists in monitoring the evolution of the samples accompanying the unknown samples according to specific key parameters, identified as important factors in the data analysis. In addition to the material type of the blank, which greatly influences its mean age, the two main parameters are the storage time between graphitization and measurement and the mass of carbon.
Follow-Up of Blanks
In the 17 years of operation of the AMS ARTEMIS, blanks have been measured regularly with unknown sample batches. Table 1 gives the average of these blanks for routine measurement, prepared under the same conditions with large mass (≥ 0.40 mg) and low storage time (≤ 30 days).
Average and standard deviation of blanks for routine measurements: mass ≥ 0.40 mg and storage time ≤ 30 days.

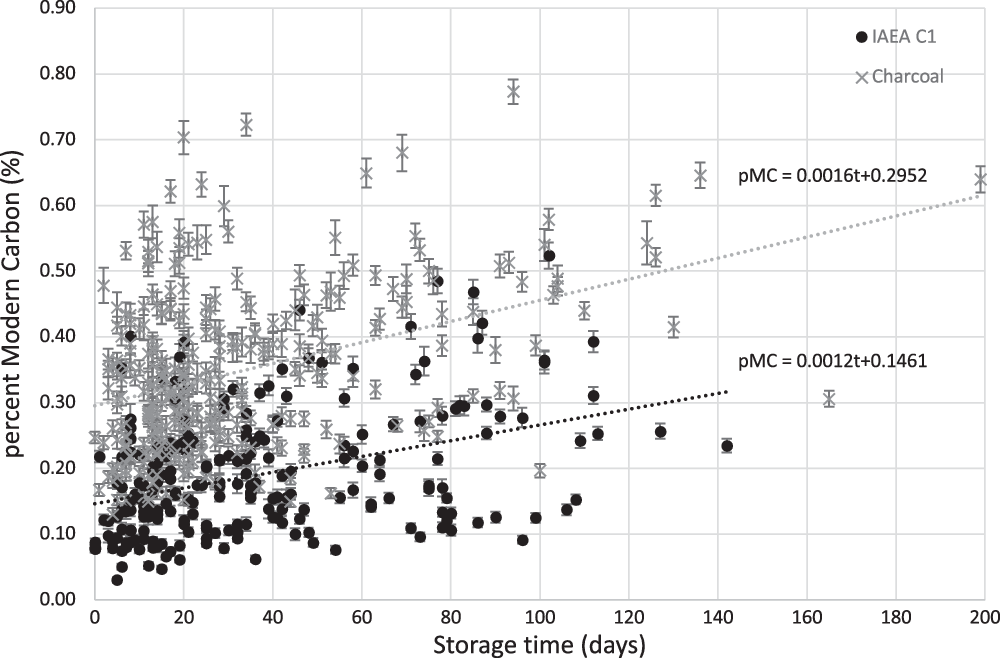
The first step is the study of the evolution of each type of blank according to the storage time for large samples. Masses lower than 0.40 mg are not taken into account at this stage to avoid small masses contributing to the blank level (Figure 1).
Blank level at LMC14 (with 1σ individual error bar) in pMC (in %) according to the storage time (in days) for routine benches. Circles: IAEA C1, cross: charcoal blank. The dashed line shows the linear regression curve and the equation of each set of data.

An increase in the blank level as a function of the storage time is observed in Figure 1, despite storing each pressed sample in an aluminum cathode directly after graphitization and then placing it in a glass tube filled with argon and hermetically sealed. All the tubes are kept in an airtight container also full of argon. The origin of this effect is not clear. For long storage times, an increase in the number of CH molecules is observed in the low energy beam line of the AMS, looking at the 13C– current.
The analyses of large samples (>0.40 mg) are corrected by a blank value depending on the storage time, according to the regression curve obtained on the set of blank measurements. The longer the storage time, the greater the correction. Thus, storing the graphitized samples for too long is avoided. A reasonable maximum time is 1–1.5 months. The C1 and charcoal blank curves are regularly updated with new measurements.
High variability of the blank level is observed. It is probably due not only to the natural variability of the raw material used to prepare the blank, its storage conditions and intensive use, but also to other parameters, such as the storage time and the cleanliness of the preparation and graphitization lines. Nine months is the usual time between two cleanings if there is no accident on the benches that would require maintenance.
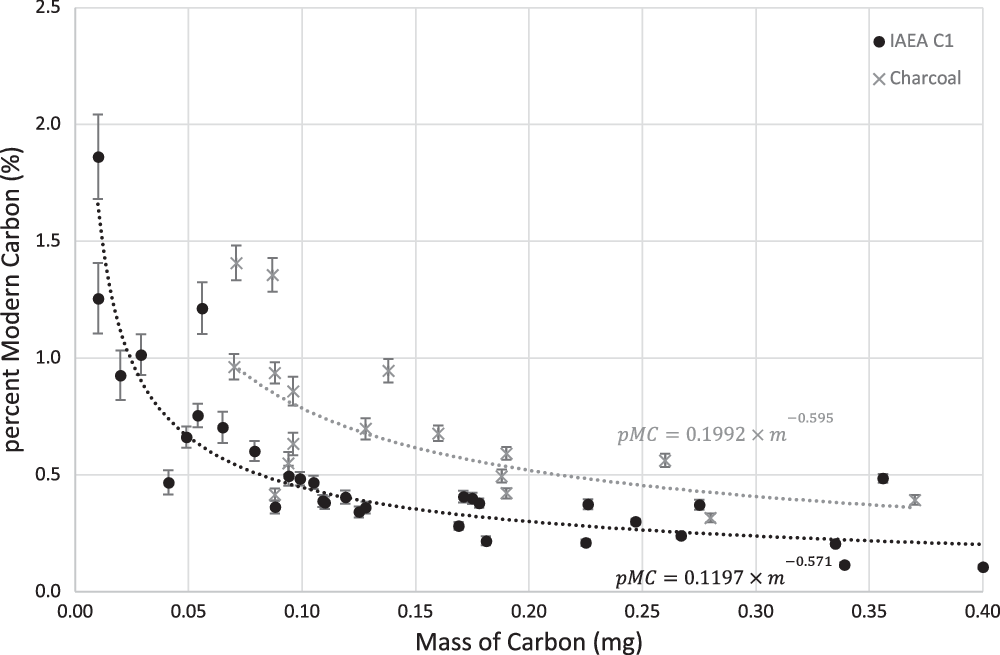
The blank level as a function of the mass of carbon is the other parameter monitored. Figure 2 shows this evolution as a function of the sample mass processed on our routine graphitization benches, for two types of blank sample. As the influence of this parameter is negligible for masses of carbon greater than 0.40 mg, only smaller samples are studied, here. In order to avoid the influence of storage time on the blank degradation, a cut-off in days of storage is applied. It is fixed at 20 days, to avoid taking into account the long storage degradation effect.
Blank level at LMC14 (with 1-σ individual error bar) in pMC (in %) according to the mass of carbon of the processed sample (in mg) on the routine benches, for mass ≤ 0.40 mg and storage time ≤ 20 days. Circles: IAEA C1; crosses: charcoal blank. The dashed line shows the regression curve and the equation of each set of data.

The fit done on each set of data, in dashed lines on Figure 2, has the following format: pMC = a × massb . This is similar to the plot in Log-Log scale reported on Figure 1a in the paper by Santos and colleagues (Santos et al. Reference Santos, Southon, Drenzek, Ziolkowski, Druffel, Xu, Trumbore, Eglinton and Hughen2010). The b parameter here corresponds to what is called “modern carbon contamination” in the literature. It depends on the chemical pretreatment used for the sample and on which graphitization bench it was prepared on. “b” values are 0.59 mgC for ABA pretreatment and graphitized on the routine bench and 0.57 mgC for hydrolysis acid pretreatment and graphitized on the routine bench. These two values are identical if we consider the variability of b. This fit curve is the correction made to the raw result to subtract a blank level according to the sample mass.
In Figure 2, the smaller the mass, the greater the blank level becomes. This is due to the increase in the portion of contamination for smaller samples. It is clearly visible on the two blank curves. The background correction becomes very significant for very low masses, typically less than 0.030 mg of carbon. The variability of the blank level increases as the mass decreases. These two parameters, mean and variability of the blank level, are taken into account for blank subtraction for small graphite samples (< 0.40 mg). For small samples, the background correction is larger than the one due to the storage time. Consequently, the correction with respect to the mass of carbon analyzed is chosen, according to the fit curve in Figure 2 and considering the nature of the sample. Of course, small samples should not wait too long in storage and are therefore measured as a priority, in order not to accumulate the two effects. A multi-parametric curve would be needed to correct the two effects. This requires a very large number of data covering the ranges in the two dimensions. In any case, it is highly recommended to collect numerous data with redundancy to improve the fits.
Tracking Secondary Standards
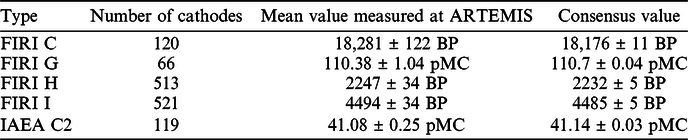
The secondary standards used in LMC14 come from the FIRI campaign (Table 2) to control the quality of the routine measurement.
Average values and standard deviations for FIRI and C2. For FIRI C, E, H and I values are given in 14C year Before Present (BP) and for FIRI G, C2 and ANU values are given in percent Modern Carbon (pMC).
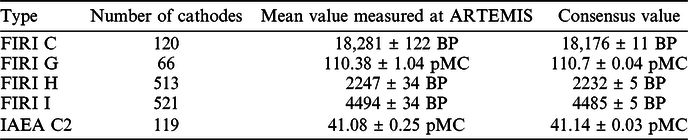
The mean values are consistent within 1-σ error bar with the respective consensus values. FIRI G presents a higher error than the others, probably due to an intrinsic sample batch heterogeneity. These results demonstrate the accuracy and the reliability of the preparation, graphitization, measurement and data analysis chain performed at the LMC14 national laboratory.
International Intercomparison Campaign for 14C Laboratories
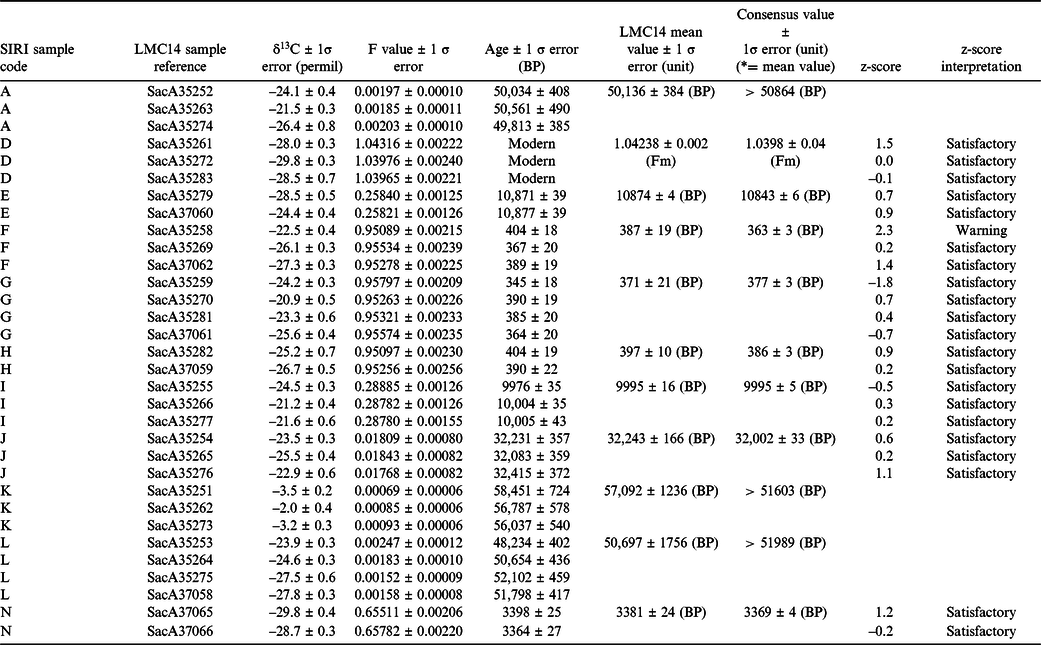
International intercomparison campaigns between 14C laboratories are regularly organized by the Radiocarbon community. The last one was the 6th campaign called SIRI (Scott et al. Reference Scott, Naysmith and Cook2017). The results obtained by the LMC14 are reported in Table 3. Bias and reproducibility of the measurements for each SIRI sample were estimated by calculating a z_score value. The z_score value corresponds to the distance between a point and an average value expressed as a number of standard deviations.
 $$z\_score = \left( {single\;date - consensus\;value} \right)/error\;of\;the\;single\;date$$
SIRI results, prepared and measured at the LMC14 laboratory. Measurements are blank corrected. Comparison with the consensus values, z-score calculation and interpretation are reported.

It can be interpreted on the following assessment:
If |z_score| ≤ 2, the single measurement is “satisfactory”.
If < |z_score| ≤ 3, a “warning” is given, the single measurement differs from the consensus value by two to three standard deviations.
If z_score > 3, “action has to be taken” to find out the reason for the discrepancy.
For each measurement of a SIRI sample, the z_score is calculated and reported in Table 3.
The results of the SIRI samples prepared and blindly measured on the ARTEMIS LMC14 AMS facility show excellent agreement with the consensus values of the samples. The z_score values are, with the exception of one case out of the 22 results, less than 2 and therefore considered satisfactory. This shows that the preparation and measurement protocols developed by the LMC14 are effective and are part of a quality approach that produces reliable dates.
MICROSAMPLE PROCEDURE
In the laboratory, about 1 mg of carbon is extracted from samples for the AMS routine measurements. Primary standards, background samples and secondary standards of equivalent masses are added in order to normalize, correct, and control the analysis, respectively (see previous sections). Today, smaller samples are analyzed, mainly from the Culture Heritage field, and the routine procedure is not fully suitable for them. Therefore, to solve this issue, a new dedicated microsample bench and a specific analytical procedure have been developed, including the points outlined in the previous section. The purpose of this section is to present the dedicated microsample protocol and its use on a recent application to ancient lead white paint. Lead white consists of a mixture of two lead carbonates, cerussite and hydrocerussite. For data analysis, a blank of equivalent nature is required, thus calcium carbonates IAEA C1 were chosen. The carbon is extracted as for lead white carbon, by thermal decomposition at 800°C on a CO2 collection line without any prior chemical treatment. In addition, secondary standards have to be selected to control the measurements and to test the dedicated procedure. As for lead white, FIRI I does not require any chemical treatment during the preparation step and is therefore suitable to accompany the measurement of lead carbonates. FIRI H is usually used for the control of the measurements but requires a chemical treatment. Blank subtraction for secondary standards is done with IAEA C1 blanks. Only one kind of blank is processed here so as not to add more numerous blank samples, even if in the case of FIRI H, IAEA C1 do not seem to be the most appropriate blanks. However, the contamination due to the small carbon mass effect is assumed to be higher than the contaminations related to the blank level associated to the difference in chemical pretreatment.
Other laboratories have developed microsample analysis protocols, mainly for environmental applications (Santos et al. Reference Santos, Southon, Drenzek, Ziolkowski, Druffel, Xu, Trumbore, Eglinton and Hughen2010; Roberts et al. Reference Roberts, Elder, Jenkins, Gagnon, Xu, Hlavenka and Longworth2019). The main concern for microsample analysis is to estimate, as accurately as possible, the contamination specific to the sample. Here, modern carbon and dead carbon contaminations are achieved by mass matching unknown samples with primary standards and blanks of equivalent mass.
Experimental Protocol for Microsamples
The unknown samples are prepared on a CO2 collection line. The sample is considered as a microsample when the mass of carbon extracted is below 0.20 mg. The dedicated microsample graphitization bench is used in this case. The extracted CO2 is graphitized according to the principle of Vogel and colleagues (Vogel et al. Reference Vogel, Southon, Nelson and Brown1984). Unlike conventional benches, the bench dedicated to microsamples has three small, 6 mL reactors in order to improve the graphitization yields. The pressure inside the reactors is measured with a small range of pressure gauges (Omega PX72-015AV, 0-350 mbar) that are more accurate for small quantities of gas. The traditional cryogenic water-trap (used in routine) is replaced by a chemical trap of magnesium perchlorate (Mg(ClO4)2) (Delqué-Količ et al. Reference Delqué-Količ, Caffy, Comby-Zerbino, Dumoulin, Hain, Massault, Moreau, Quiles, Setti, Souprayen, Tannau, Thellier and Vincent2013a). A few grains are enough to remove the water and prevent the reversibility of the reaction. On this specific bench, the quantity of iron powder introduced in the reduction tubes remains constant at 1.5 mg to allow the sample to be pressed in the cathode (Delqué-Kolic et al. Reference Delqué-Količ, Comby-Zerbino, Ferkane, Moreau, Dumoulin, Caffy, Souprayen, Quilès, Bavay, Hain and Setti2013b), while, for routine large samples, the quantity of iron is proportional to the mass of carbon. The pressure of the hydrogen introduced into the reactor must not exceed a factor of 2.3 times the measured CO2 pressure otherwise methane may form. The correct progress of the sample graphitization is checked by calculating the yields from the initial CO2 pressure, the introduced hydrogen pressure and the residual pressure. Only samples with a graphitization yield greater than 80% are selected for AMS analysis. In the case of the microsamples presented here, this condition is fully satisfied. Once graphitized, the microsamples are pressed in an aluminum cathode, like the routine samples.
Based on the mass of carbon extracted from the unknown sample, accompanying samples (blanks and secondary standards) with approximately the same mass are then prepared. Primary standards of approximatively equivalent masses to unknown samples and accompanying samples are necessary for the normalization as part of the dedicated microsample procedure. A batch is created with unknown samples, blanks, primary and secondary standards. All these samples are analyzed on ARTEMIS according to a specific AMS measurement procedure described in the next section.
Tuning Procedure for the Measurement of Microsamples
Specificities related to the measurement of microsamples should be taken into account. Microsamples contain a low amount of carbon compared to the quantity of iron, since the latter is maintained constant for small samples (carbon mass below 0.40 mg). It is thus necessary to reduce sputtering, by adjusting the cesium flow, limiting the duration of each run (reducing the number of cycles 12-13-14 of measurement per run) and if necessary, increasing their number, until the sample is perforated right through. It is relevant to reduce the warmup time at the beginning of each run (time without measurement), to avoid burning the sample unnecessarily. It is then imperative to check during the measurement that the current of the sample does not drop significantly, otherwise the ratios 13 over 12 and 14 over 12 become unstable, and the sample measurement has to be stopped. If all these precautions are taken, the data analysis can be easily carried out.
Dedicated Data Analysis for Microsamples
The dedicated microsample procedure follows the same scheme as the routine procedure described in the first part of this paper. This part of the status report focuses on the application of this dedicated microsample protocol to Cultural Heritage samples analyzed in 2019 in the LMC14. For this particular study, OxII (primary standard), IAEA C1 (blanks), FIRI H and I (secondary standards), were chosen.
Data Normalization
The reduction of experimental data for microsamples is usually done with the NEC abc software. Special attention is paid to any burning out of the sample during the measurement. All data are routinely analyzed using primary standards and blanks and controlled by secondary standards. The analysis of microsamples is done in the same way; they are initially grouped, however, in batches of very similar masses. Each batch consisting in a set of primary standards, blanks and secondary standards, accompanying the unknown microsample is analyzed separately. At each step, the correlation between the 12C3+ current of the beam and the mass of carbon in the sample is checked. If the suitability is not appropriate, the microsample is moved, according to its current, to the batch with the closest average current. This presumably indicates a problem at the graphitization stage: low graphitization yield, presence of uncondensable matter, or a target pressing problem. When the choice of attribution is difficult because the sample falls halfway between two masses or two currents, the δ13C measured by the AMS is the third parameter used. Its value is representative of the sample material and can be measured off line on a stable isotope analyzer. The sample will then be positioned in the batch which gives a measured δ13C close to the expected value.
Once the groups have been created, the data can be normalized. A preliminary step is carried out using primary standards, blanks and secondary standards specifically prepared on the dedicated bench with a mass of around 0.30 mg. Because this sample mass range shows similar results to large routine samples, thanks to the reduction of the reactor volumes on the dedicated bench, this gives an overview of the accuracy of the results and the smooth running of the measurements. Next, the compatibility of the primary standards is checked for each batch with a statistical χ2-test. The raw data of blanks, secondary standards and samples are normalized to the standard group, creating a series of result files (one per mass domain).
In this part, the performance of the new dedicated microsample procedure in correcting the secondary standard data will be presented and compared to the conventional analyses.
Analysis of the Data
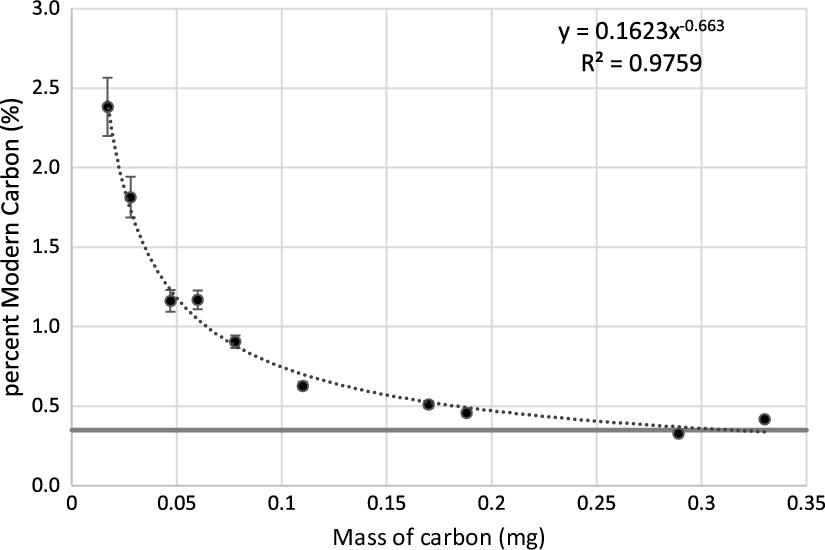
Blanks: Once normalized, the data collected for the blanks (IAEA C1) are used to plot a curve of the blank level according to their carbon mass (Figure 3). The experimental data are fitted with a function: y = a × massb .
C1 blank curve level versus mass of carbon for the microsample dedicated bench: fit on experimental data in dotted line. The horizontal gray line represents the mean value of blanks close to 0.30 mg of carbon.

Two trends can be observed. For C1 blanks with masses above 0.20 mg, the blank level appears to reach a constant value corresponding to the average value of the masses of blank at 0.30 mg (Figure 3). For masses below 0.20 mg, the blank level increases significantly until it reaches, in this case, 2.4 pMC for 0.017 mg of carbon. Thus, the smaller the sample size, the greater the modern carbon contamination. Preparation, graphitization and storage time are all steps that can influence the blank level for small carbon masses.
This curve is used for the analysis of all types of microsamples: the subtraction of a blank level depending on the mass of sample is considered. A better correction is then made to the measurement by evaluating the modern contamination rate during preparation and graphitization, based on the carbon mass considered. This curve can be improved by further microsample measurements. The accumulation of data allows a better adjustment of corrections to calibrations and unknown samples.
Calibrations: The correction method is now applied to FIRI H and I secondary standards to systematically control the measurement quality. These data are important for the validation of the AMS analysis and the validation of the dedicated microsample procedure.
First, the blank level is calculated for each mass of FIRI using the blank analytical curve in Figure 3. According to the mass of the sample, the corresponding blank value is then subtracted from its raw result. It is not possible to calculate here the variability of the IAEA C1 blank for each mass, because of the lack of measurements for a given mass. The variability is chosen equal to 30% over the entire mass domain. This variability is included in the propagated error given with the final age.
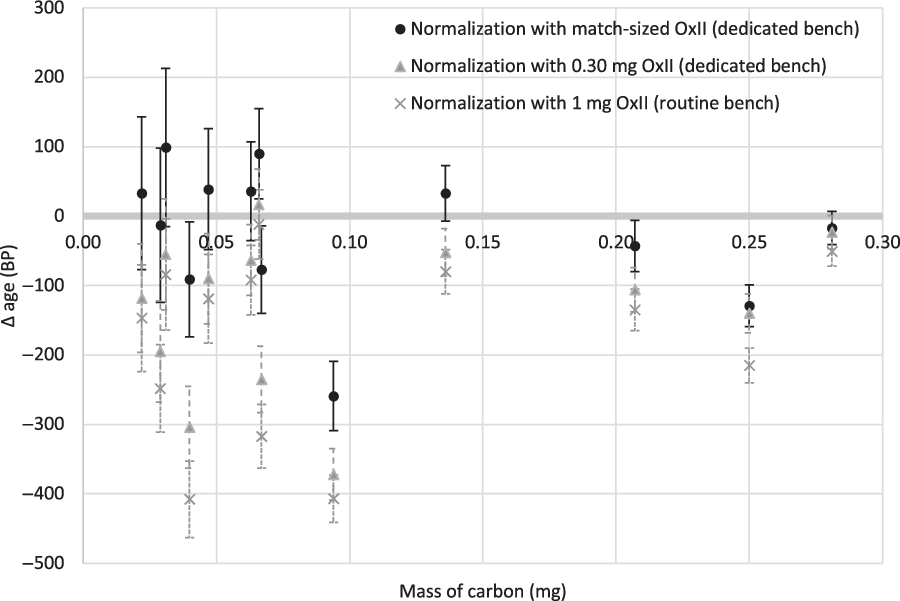
To verify the relevance of this new procedure (black circle on Figure 4), the final FIRI (H and I) ages are compared to a) those normalized to OxII 1 mg and corrected by subtracting the conventional average blank at 1 mg (gray cross on Figure 4) and b) those normalized to OxII 0.30 mg and corrected by subtracting the average blank level at 0.30 mg (gray triangle on Figure 4). The results are presented in Figure 4. For ease of reading, we propose to compare the age differences (noted Δage) calculated from the 14C age calculated by the three calculation methods explained above subtracted from the consensus age as a function of the mass of FIRI analyzed (noted mass of sample).
Δage as a function of the mass of the calibration samples. The Δages correspond to the difference between the 14C age obtained with the microsample procedure (black circle), or the 14C age normalized with OxII 0.30 mg graphitized on the dedicated bench (gray triangle), or the 14C age normalized with OxII 1 mg graphitized on the routine bench (gray cross) and the consensual 14C age (horizontal line). Error bars are given at 1σ.

The results of the normalization with 1 mg OxII processed on the routine bench and the normalization with 0.30 mg OxII graphitized on the dedicated bench are fully compatible at 2σ. Thus, this observation confirms that 0.30 mg samples are large enough to behave as routine samples on the dedicated bench, thanks to the reduction in the size of the reduction volume, more suitable for small masses (< 0.30 mg). For sample masses above 0.10 mg of carbon, no significant difference between the three methods is observed. However, the application of the dedicated microsample procedure is very effective in correcting 14C ages for lower carbon mass samples, below 0.10 mg. The shift observed for the 0.094 mg sample is probably due to a target pressing problem.
The blank subtraction with mass dependence gives better results than the conventional corrections, particularly on very small masses. This shows the interest and relevance of the implementation of a dedicated procedure for microsample data analysis, avoiding the discrepancies of 50 to 300 years BP, on masses less than 0.10 mg.
Application of the Protocol to Unknown Microsamples: Case of Ancient Lead White Paints
The microsample procedure has been applied to microsamples of ancient paints. Recently, the laboratory developed an experimental protocol to date lead white cosmetic and pigment by 14C (Beck et al. Reference Beck, Caffy, Delqué-Količ, Moreau, Dumoulin, Perron, Guichard and Jeammet2018, Reference Beck, Messager, Coelho, Caffy, Delqué-Količ, Perron, Mussard, Dumoulin, Moreau, Gonzalez, Foy, Miserque and Bonnot-Diconne2019). When lead white is used to date paintings, it is necessary to reduce the size of the samples for reasons of conservation and preservation of the pictorial artifacts (Hendriks et al. Reference Hendriks, Hajdas, Ferreira, Scherrer, Zumbühl, Küffner, Wacker, Synal and Günther2018, Reference Hendriks, Hajdas, Ferreira, Scherrer, Zumbühl, Küffner, Carlyle, Synal and Günther2019). Lead white contains a low amount of carbon, between 3.1% and 4.4%, depending on the proportions of hydrocerussite and cerussite (lead carbonates) present in the pigment (Gettens et al. Reference Gettens, Kühn, Chase and Roy1993). Due to the small size of the samples and the low carbon content, the use of the dedicated microsample procedure is required.
The protocol was applied to lead white paint samples from two medieval mural paintings. According to stylistic studies, panel 1 is dated around 1500, while panel 2 is estimated to have been produced between 1300 and 1740. One large black pigment sample made of charcoal was also dated for comparison for panel 2.
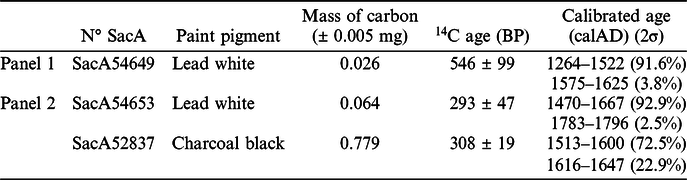
0.026 mg and 0.064 mg of carbon were extracted from lead white samples of panel 1 and panel 2, respectively, and they were then graphitized on the bench dedicated to microsamples. For these two masses, the associated blank level was calculated via the blank analytical curve (Figure 3) and subtracted from the raw 14C data. The results were compared either with the estimation of the stylistic studies or with the 14C dating of the charcoal black sample prepared and analyzed according to our routine protocols (Table 4).
14C dating results of microsamples of lead white and charcoal black paints from two medieval painting panels.

14C dates were calibrated using OxCal Software (Bronk Ramsey Reference Bronk Ramsey2009, Reference Bronk Ramsey2017; Reimer et al. Reference Reimer, Bard, Bayliss, Beck, Blackwell, Bronk Ramsey, Brown, Buck, Edwards, Friedrich, Grootes, Guilderson, Haflidason, Hajdas, Hatté, Heaton, Hogg, Hughen, Kaiser, Kromer, Manning, Reimer, Richards, Scott, Southon, Turney and van der Plicht2013). Calibrated age intervals are given at 2 σ. The calibrated 14C age obtained for lead white paint from panel 1 is in agreement with the period given by the stylistic studies.
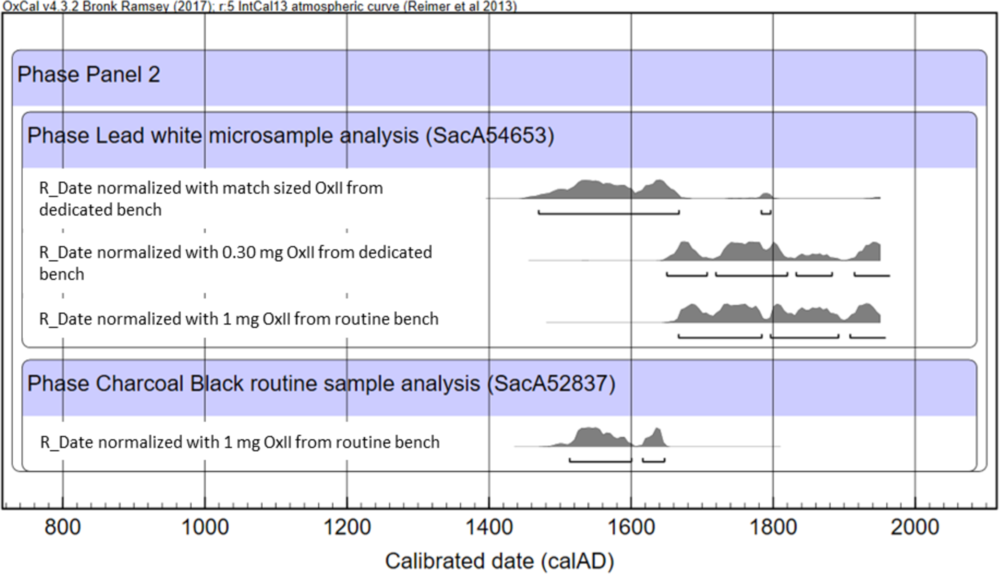
Concerning panel 2, three different analyses are presented in Figure 5, in order to illustrate the efficiency of the new dedicated microsample procedure. For the lead white microsample, the two standard normalizations—0.30 mg OxII (dedicated bench) and the 1 mg OxII (routine bench)—give much younger calibrated results than the charcoal black pigment. It is also noticeable that the compatibility of these two results confirms that 0.30 mg of sample on the microsample dedicated bench is equivalent to 1 mg sample on the routine bench. The dedicated microsample procedure gives a very consistent result with the date associated to the charcoal black pigment.
Calibrated ages (OxCal) for three analyses of the lead white microsample and for the charcoal black routine sample (medieval wall painting Panel 2). Lead white data were analyzed with three different data processing methods: a) the microsample procedure: normalized with size-matched OxII from the dedicated bench and the subtraction of a blank level calculated from the blank curve in Figure 3; b) normalized with OxII at 0.30 mg and corrected by subtracting the average blank level at 0.30 mg from the dedicated bench; and c) normalized with OxII at 1 mg and corrected by subtracting the conventional average blank at 1 mg from the routine bench. Finally, the charcoal black was analyzed with OxII 1 mg and corrected with the average blank at 1 mg from the routine bench. The calibrated ages are given at 2 σ (95.4% confidence).

In conclusion, the dedicated microsample procedure implemented in the LMC14 is effective in correcting 14C ages and ensures the reliability of the result. In both cases, information is provided on the time of manufacture of the pigment. The first 14C dating confirms stylistic studies while the second 14C dating restricts the interval proposed by archaeologists (1300–1740) to the 16th and mid-17th century.
CONCLUSION
This article shows the quality approach performed at LMC14 for the preparation, graphitization, measurement and data analysis for routine samples. Tools and procedures have been developed and continuously improved to maintain the quality of results at the level of international standards. The participation of the laboratory in the SIRI international intercomparison campaign is an important part of this approach. The results obtained show a very high consistency with the consensus values and therefore validate the procedures followed each day by the laboratory at each step of the sample route.
In addition, a dedicated procedure for microsample study is proposed in this paper. The results obtained for calibrations and lead white paint samples are very successful, proving that this procedure is perfectly adapted for the data analysis of small amounts of carbon.
The LMC14 can deal with the analysis of valuable materials, in particular paintings. Thanks to the dedicated procedure, it is possible to better respect the integrity of the artifacts by reducing the amount of material taken from them. The perspective of this work is to continue to improve the blank curve to refine the methodology.
Although this dedicated microsample procedure is effective in ensuring the reliability of a result, its implementation requires the preparation, graphitization and analysis of a large amount of primary standards, blanks and secondary standards for a single unknown sample. A gas source will be installed on the AMS ARTEMIS for the measurement of smaller samples (Bronk Ramsey et al. Reference Bronk Ramsey, Ditchfield and Humm2004; Xu et al. Reference Xu, Dougans, Freeman, Maden and Loger2007; Wacker et al. Reference Wacker, Fahrni, Hajdas, Molnar, Synal, Szidat and Zhang2013; Calcagnile et al. Reference Calcagnile, Maruccio, Braione and Quarta2018). It has the advantage of removing the graphitization step from the preparation procedure and reducing the risks of contaminating the sample during this processing step. The completion of this new gas ion source will be particularly useful for cultural heritage applications.
ACKNOWLEDGMENTS
The LMC14 is founded by five French organizations: CEA, CNRS, IRD, IRSN, and MC. This is LSCE contribution number 7024.