





In recent years, the use of dietary supplements (DS) has become widespread in developed countries, including Japan. For example, in the USA National Health and Nutrition Examination Survey, the proportion of adults using DS was 46 % for 19–50 years, 65 % for 51–70 years and 73 % for 71 years and older in 2009–2012(Reference Blumberg, Frei and Fulgoni1). The proportion of DS users is somewhat lower than in the USA but still substantial, at 37 % among Korean adults according to 2007–2009 data(Reference Kang, Kim and Baek2) and 24 % among Japanese adults in 2013(Reference Sugimoto, Asakura and Shinozaki3). Although DS is intended to complement nutrient intake(4,5) , the additional nutritional benefit from DS is small if adequate nutrient intake is provided by foods. Examining whether DS users are people who need to complement their nutrient intake with DS may provide a basis for reducing unnecessary DS use.
Many studies have reported sociodemographic, lifestyle and dietary characteristics of DS users. In general, DS users tend to differ from non-users in some characteristics, such as female(Reference Keshavarz, Shafiee and Islam6–Reference Gong, Liu and Yao8), older(Reference Keshavarz, Shafiee and Islam6,Reference Cowan, Jun and Gahche7) , non-obese(Reference Keshavarz, Shafiee and Islam6,Reference Cowan, Jun and Gahche7) , more highly educated(Reference Keshavarz, Shafiee and Islam6–Reference Gong, Liu and Yao8), living with chronic diseases(Reference Keshavarz, Shafiee and Islam6,Reference Gong, Liu and Yao8) , physically active(Reference Pouchieu, Andreeva and Péneau9,Reference Ishihara, Sobue and Yamamoto10) , residing in urban areas(Reference Kobayashi, Sato and Umegaki11), nonsmokers(Reference Keshavarz, Shafiee and Islam6,Reference Cowan, Jun and Gahche7) and experiencing low levels of stress(Reference Ishihara, Sobue and Yamamoto10,Reference Giammarioli, Boniglia and Carratù12) . Regarding alcohol consumption, some studies have shown that people who consumed alcohol at least once a month used DS more than nondrinkers(Reference Ishihara, Sobue and Yamamoto10,Reference Smith, Wilson and Parnell13) , while other studies have reported that DS users consumed less alcohol than non-users(Reference Kang, Kim and Baek2,Reference Pouchieu, Andreeva and Péneau9) . Additionally, compared with non-users, DS users tended to have healthier dietary characteristics, such as higher intakes of micronutrients from foods(Reference Blumberg, Frei and Fulgoni1,Reference Kang, Kim and Baek2,Reference Pouchieu, Andreeva and Péneau9,Reference Fassier, Egnell and Pouchieu14) . Moreover, the prevalence of inadequacy of nutrient intake was lower in DS users than non-users(Reference Kang, Kim and Baek2,Reference Pouchieu, Andreeva and Péneau9,Reference Fassier, Egnell and Pouchieu14) .
Previous studies have also shown that females were more likely than males to use DS(Reference Keshavarz, Shafiee and Islam6–Reference Gong, Liu and Yao8), and some previous studies reported the characteristics of female DS users. The proportions of female DS users were 16·7 % among female students(Reference Kobayashi, Sato and Umegaki11) and 34·4 % among female nursing professionals in Japan(Reference Kishi, Ideno and Nagai15). The study of female nursing professionals reported that those who were older and classified as normal weight were more likely to use DS(Reference Kishi, Ideno and Nagai15). Regarding dietary characteristics, female DS users had higher intakes of some nutrients and a lower prevalence of inadequate intakes of vitamins and minerals compared with non-users(Reference Fassier, Egnell and Pouchieu14,Reference Bailey, Fulgoni and Keast16,Reference Pavlak, Drehmer and Mengue17) . Given that women experience various life events that shift nutrient requirements throughout their life course, including pregnancy, lactation and menopause(Reference Snetselaar, de Jesus and DeSilva18,19) , the characteristics of DS use are expected to vary across different age groups. However, to our knowledge, few studies have examined the sociodemographic, lifestyle and dietary characteristics of female DS users by age group. A previous study reported that vitamin and/or mineral supplement users consumed significantly more nutrients from foods than non-users, especially among elderly women (60 years and older)(Reference Pavlak, Drehmer and Mengue17). Understanding characteristics of DS users will provide useful insights for designing nutrition education programmes that align with the specific needs and challenges posed by female life events across different age groups.
In this study, we aimed to examine the differences in the sociodemographic, lifestyle and dietary characteristics between DS users and non-users in three age groups of Japanese women: younger, middle-aged and older. We hypothesised that DS users differ in sociodemographic and lifestyle characteristics compared with non-users and have higher nutrient intakes from foods than non-users. Furthermore, another hypothesis is that the characteristics of DS users differ depending on their age group.
Methods
Data source
Study design
This cross-sectional study was a secondary analysis of the Three-generation Study of Women on Diets and Health, a questionnaire survey. The detailed description of the survey has been published elsewhere(Reference Kobayashi, Asakura and Suga20). Briefly, the survey was conducted in a total of 85 institutions (universities, two-year colleges and vocational schools with dietitian training courses) located in 35 (of 47) prefectures in Japan. The institutions were determined based on the feasibility of the survey, primarily the presence of a collaborator at each site. The surveys were conducted in northern and western Japan from April to May 2011 and in eastern Japan from April to May 2012, respectively. Dietary and lifestyle questionnaires were distributed to 7016 dietetic students during an orientation session or the first lecture designed for freshmen in April 2011 and 2012. Each student was also asked to distribute the questionnaires to his/her mother and grandmother and invite them to join in the study. Recruitment priority for the grandmother generation was given first to the maternal, or if unavailable, paternal grandmother, followed by his/her female acquaintance aged 65–89 years. In total, 4933 students (4656 women and 277 men; response rate: 70·3 %), 4044 mothers (response rate: 57·6 %) and 2322 women from grandmother’s generation (response rate: 33·2 %) answered both questionnaires. The study protocol was approved by the Ethics Committee of the University of Tokyo Faculty of Medicine (No. 3249). Written informed consent was obtained from all participants and a parent for students aged under 20 years.
Diet history questionnaires
Dietary intake was assessed using a comprehensive diet history questionnaire (DHQ) for students and mothers(Reference Kobayashi, Murakami and Sasaki21–Reference Sasaki, Yanagibori and Amano23) and a brief diet history questionnaire (BDHQ) for grandmothers’ generation(Reference Kobayashi, Murakami and Sasaki21,Reference Kobayashi, Honda and Murakami22) . Briefly, the DHQ and BDHQ are structured, self-administered questionnaires designed to assess habitual dietary intake during the preceding month, based on consumption frequency (and portion size in the DHQ) of commonly consumed foods in Japan(Reference Kobayashi, Honda and Murakami22,Reference Sasaki, Yanagibori and Amano23) . The BDHQ was used for older women instead of the DHQ to maximise the response rate and the number of valid responses, given that the BDHQ(Reference Kobayashi, Murakami and Sasaki21,Reference Kobayashi, Honda and Murakami22) requires less time to complete (approximately 15–20 min) compared with the DHQ(Reference Kobayashi, Murakami and Sasaki21–Reference Sasaki, Yanagibori and Amano23) (approximately 45–60 min). Survey staff at the study centre checked the responses to the DHQ and BDHQ. If any missing or implausible responses were found, the participants were requested to complete them again. The relative validity of the DHQ and BDHQ has been examined among 92 women aged 31–69 years using a 16-day dietary record as a reference(Reference Kobayashi, Murakami and Sasaki21,Reference Kobayashi, Honda and Murakami22) . For the DHQ, the median Spearman’s correlation coefficient for food groups was 0·43 (range: –0·09–0·77), and the median Pearson correlation coefficient for nutrient intake was 0·49 (range: 0·43–0·57). For the BDHQ, the corresponding values were 0·44 (range: 0·14–0·82) and 0·49 (range: 0·38–0·57), respectively. In addition, in the DHQ, participants were asked about their physical activity level; however, this information was used solely for estimating energy expenditure and was not used in the logistic regression analysis.
Sociodemographic and lifestyle questionnaires
The sociodemographic and lifestyle characteristics of the participants were self-reported using a questionnaire. DS use was assessed using the following question: ‘Have you used any DS (tablets, powders, or liquids) in the past month?’ Participants were also required to provide the names of the products used. Other variables included the date of birth, body height (cm), body weight (kg), residential area (prefectures and city), habitual frequency of physical activity in the past month (walking, bicycling, standing, running and high-intensity activities), smoking status (current smoker, former smoker or nonsmoker), alcohol drinking, sleep habits (self-reported sleep duration, bedtime, waking time and time taken to fall asleep), history of chronic disease and depression symptoms using the Centre for Epidemiologic Studies Depression scale(Reference Radloff24–Reference Murakami, Mizoue and Sasaki26). Students and mothers were also asked to provide information about their menstrual cycle (regular, almost regular every month, irregular about half of the time over the past 12 months, irregular most of the time over the past 12 months, rarely in the past 12 months or never in the past 12 months). For mothers and grandmothers’ generations, education level was assessed with the following options: junior high school and others, high school, two-year college and technical schools, university or above, and unknown and others.
Data handling
Analytic sample
In this study, participants were categorised as younger women, middle-aged women or older women. Younger women included students aged 18 years (n 4065), and middle-aged women included mothers aged ≤60 years (n 4012). For older women, grandmother’s generation aged ≥61 years was included (n 2325). We excluded pregnant or lactating women (n 1 for younger women, n 5 for middle-aged women). Then, we excluded participants living in eastern Japan and those who participated in the 2011 data collection period, because of the influence of the Great East Japan Earthquake in March 2011 (n 39 for younger women, n 63 for middle-aged women, and n 47 for older women). We also excluded participants from one institution with a response rate of 2 % (n 2 for younger women, n 2 for middle-aged women and n 1 for older women). Additionally, younger women who answered the questionnaires after 19 May 2011 or 2012 were excluded to prevent the effects of lectures on nutrition (n 56). Moreover, participants with missing information on the variables of interest were excluded (n 15 for younger women, n 162 for middle-aged women, and n 85 for older women). The final sample sizes were 3952, 3780 and 2192 for younger, middle-aged and older women, respectively.
Dietary supplement use
Since there is no clear definition of DS in Japan, we defined them based on the definitions in the USA and Europe(4,5) . In this study, DS were defined as products that satisfied all of the following criteria: (a) products used to address nutritional deficiencies, maintain adequate nutrient intake, and maintain and improve health status, (b) products containing concentrated or added vitamins, minerals, herbs or other botanicals, amino acids, fatty acids or other substances with nutritional or physiological effects and (c) products ingested in the form of tablets, capsules, powders or liquids. DS users were defined as a person who took any DS at least once in the previous month.
Food and nutrient intakes
Estimation of the daily intakes of foods (151 items in DHQ and 58 items in BDHQ), energy and selected 29 nutrients was calculated using an ad hoc computer algorithm based on the 2005 edition of the Standard Tables of Food Composition in Japan(27). The food groups used in this study are shown in online Supplementary Table 1. To minimise the influence of dietary misreporting(Reference Livingstone and Black28,Reference Murakami, Sasaki and Uenishi29) , food and nutrient intakes were energy-adjusted. The energy-adjusted values for food and nutrient intakes were calculated as follows: energy-adjusted values (amount per day) = reported intake (amount per day)/reported energy intake (kJ per day) × estimated energy requirement (kJ per day). The value of estimated energy requirement was calculated based on age, sex, body weight, body height and physical activity level of individuals(30). In the DHQ, for younger women and middle-aged women, the responses of physical activity levels were classified into three levels: level Ⅰ (low), level Ⅱ (relatively low) and level Ⅲ (moderate and heavy) according to the Dietary Reference Intake for Japanese. In the BDHQ, for older women, the physical activity level for level Ⅱ (relatively low) was applied for all participants. As there was no comprehensive nutrient database in Japan, we did not calculate the amount of nutrients taken from DS.
The inadequacy of intakes of 15 nutrients from foods was evaluated by comparing energy-adjusted nutrient intake with the age-specific estimated average requirement (EAR) from the Dietary Reference Intakes for Japanese 2020(19). The EAR is a value determined as the amount that half of the population needs to meet their requirements to avoid insufficient intake, as shown in online Supplementary Table 2. The 15 nutrients with EAR considered in this study were as follows: protein, vitamin A, thiamine, riboflavin, niacin, vitamin B6, vitamin B12, folate, vitamin C, sodium, calcium, magnesium, iron, zinc and copper. While overconsumption of sodium is generally the main concern, it was included to cover all 15 nutrients with an EAR. Iodine, selenium and molybdenum were not included in this study because the values in the food composition table are insufficiently described in Japan(27).
Other variables
BMI was calculated by dividing body weight (kg) by the square of height (m). Weight statuses were grouped into 3 categories based on BMI: underweight (<18·5), normal weight (≥18·5 to <25) and overweight (≥25)(31). Residential blocks were grouped into six regions (Hokkaido and Tohoku, Kanto, Hokuriku and Tokai, Kinki, Chugoku and Shikoku, or Kyushu). Residential areas were also categorised into three categories according to population size (city with a population ≥1 million, city with a population <1 million or town and village). Physical activity was computed as the average total metabolic equivalent-hours score per day based on the frequency and duration of seven activities (walking, bicycling, standing, running, high-intensity activities, sleeping, sedentary activity)(Reference Ainsworth, Haskell and Herrmann32). If the total physical activity and self-reported sleeping time was less than 24 h, this total time was compensated by sedentary activity. For middle-aged and older women, education level was categorised as junior high school and others, high school and more than high school. ‘More than high school’ included university, two-year college and technical schools. Drinkers were defined as individuals who reported alcohol consumption in the past month, without regard to the quantity consumed. Those who did not consume any alcohol were classified as nondrinkers. Sleep duration was calculated using bedtime, waking time and time taken to fall asleep. Younger and middle-aged women who answered that their menstrual cycle was regular, almost regular every month, irregular about half of the time over the past 12 months, irregular most of the time over the past 12 months or who did not provide an answer were treated as having a menstruation. Younger women with a prior diagnosis of heart disease, diabetes or gynaecological disease by a doctor were classified as having a chronic disease. Middle-aged and older women were classified as having a chronic disease if they had ever been diagnosed by a doctor with cancer, CVD, hypertension, dyslipidaemia, diabetes or gynaecological disease.
Statistical analysis
All statistical analysis was performed using the SAS statistical software, version 9.4 (SAS Institute Inc.). Descriptive data were presented as mean (sd) for continuous variables and n (%) for categorical variables. All analyses were conducted within each age group, with no comparisons made between age groups because of the use of different dietary assessment methods and the differences in potential confounding factors. Differences in food group or nutrient intakes between DS users and non-users were examined using the Student’s t test. Using the PROC LOGISTIC procedure, we estimated multivariate-adjusted OR and CI for the probability of DS use. As the results for the crude and multivariate-adjusted models were generally similar except for physical activity in younger women, and size of residential area and education level in older women, we present here only those derived from the multivariate model. Regarding the probability of inadequacy of nutrient intake according to DS use, the OR indicate that the nutrient intake of DS users is likely to be below the EAR compared with non-users. Also, for sociodemographic and lifestyle characteristics, the OR for categorical variables indicate the probability of each category being a DS user relative to the reference category. An OR greater than 1 indicates a higher probability of being a DS user compared with the reference category, while an OR less than 1 indicates a lower likelihood. For continuous variables, the OR for physical activity and sleep duration indicate that one-point increase of physical activity or longer sleep duration is associated with increased OR of DS use. Multivariate models included weight status, residential block, size of residential area, physical activity, smoking status, alcohol drinking, sleep duration, history of chronic disease and depression symptoms. For middle-aged and older women, multivariate models also included age and education level. The variables included in our model were selected based on previous studies indicating their associations with DS use(Reference Keshavarz, Shafiee and Islam6–Reference Giammarioli, Boniglia and Carratù12). All reported P-values were two-tailed, with a P-value < 0·05 considered statistically significant.
Results
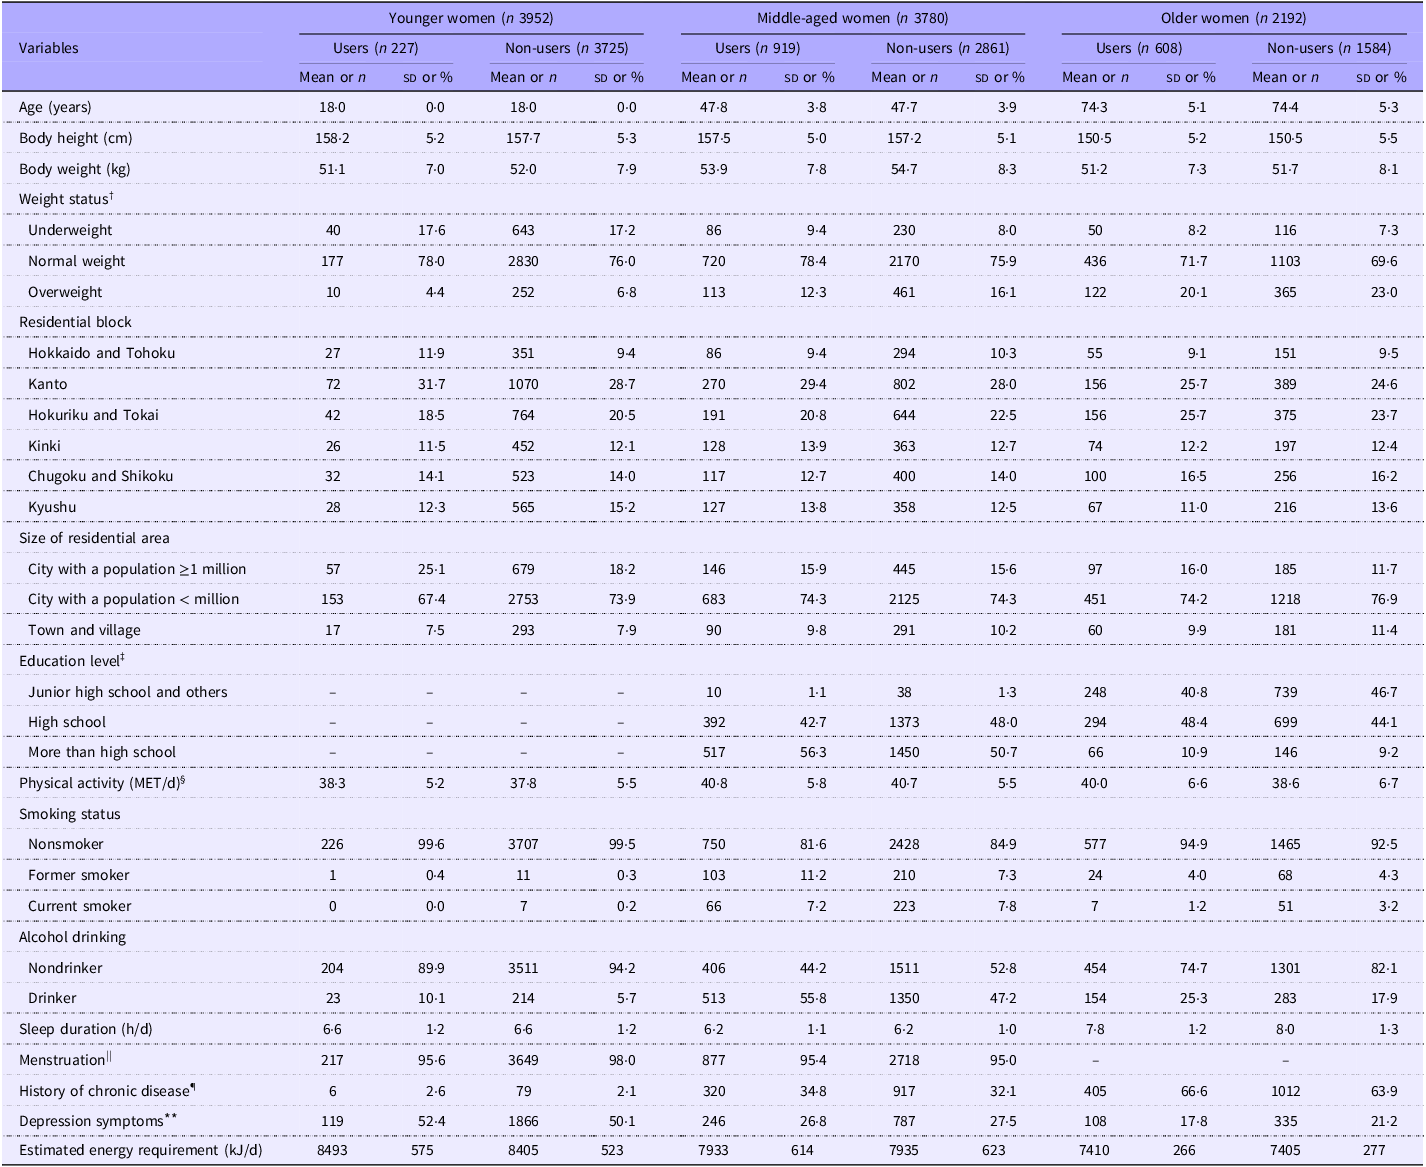
The sociodemographic and lifestyle characteristics of participants are shown in Table 1. All younger women were 18 years old. The range of ages was 35–60 years in DS users and 34–60 in non-users for middle-aged women and 61–91 years in DS users and 61–94 in non-users for older women. The proportion of DS users was 5·7 % for younger women, 24·3 % for middle-aged women and 27·7 % for older women. Regardless of age group or DS use, approximately 70–80 % of participants were classified as normal weight. For DS users, the mean energy intake (sd) was 7609 (2405) kJ/d in younger women, 7968 (2112) kJ/d in middle-aged women and 7568 (2206) kJ/d in older women. Similarly, for non-users, the values were 7217 (2396) kJ/d, 7637 (2253) kJ/d and 7265 (2287) kJ/d, respectively.
Sociodemographic and lifestyle characteristics of the study participants according to DS use*

Table 1. Long description
The table presents sociodemographic and lifestyle characteristics of participants categorized into younger women, middle-aged women, and older women, further divided into DS users and non-users. It includes variables such as age, body height, body weight, weight status, residential block, size of residential area, education level, physical activity, smoking status, alcohol drinking, sleep duration, menstruation, history of chronic disease, depression symptoms, and estimated energy requirement. The table has 25 rows and 12 columns, with each row representing a different variable and each column representing a different group. Notable trends include the proportion of DS users increasing with age, and the majority of participants across all groups being classified as normal weight. The mean energy intake varies slightly between DS users and non-users within each age group.
DS, dietary supplement; MET, metabolic equivalents.
* Values are mean (sd) for continuous variables or n (%) for categorical variables. Due to rounding, the total may not be 100 %.
† Underweight, normal weight and overweight were defined based on BMI (kg/m2) of <18·5, ≥18·5 to <25 and ≥25, respectively(31).
‡ The category of ‘more than high school’ included university, two-year college and technical schools. This variable was not included in the questionnaire for younger women as they were all first-year university students.
§ Physical activity was calculated based on the frequency and duration of seven activities (walking, bicycling, standing, running, high-intensity activities, sleeping and sedentary activity)(Reference Ainsworth, Haskell and Herrmann32).
|| This category included individuals considered to have menstruation, including those with regular menstruation, as well as those who reported their menstruation as regular or almost regular every month, irregular about half of the time over the past 12 months, irregular most of the time over the past 12 months or who did not provide an answer. This variable was not included in the questionnaire for older women.
¶ For younger women, this category included individuals who had ever been diagnosed by a doctor for heart disease, diabetes or gynaecological disease. For middle-aged and older women, this category included individuals who had ever been diagnosed by a doctor for cancer, CVD, hypertension, dyslipidaemia, diabetes and gynaecological disease.
** This category includes individuals who were considered to have depression symptoms (16 points or more out of 60) based on the Center for Epidemiologic studies Depression scale(Reference Radloff24–Reference Murakami, Mizoue and Sasaki26).
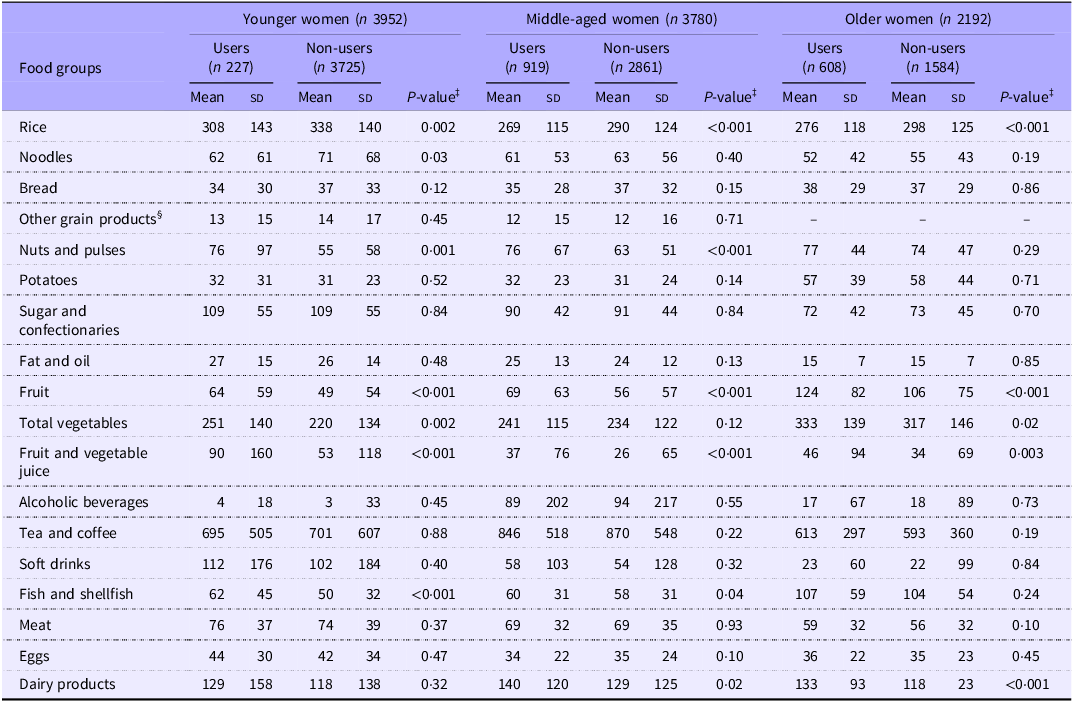
The mean intakes of food group in DS users and non-users are shown in Table 2. In younger women, DS users had a significantly lower rice and noodle intake than non-users but significantly higher intakes of nuts and pulses, fruit, total vegetables, fruit and vegetable juice, and fish and shellfish. Among middle-aged women, DS users consumed significantly less rice than non-users but significantly more nuts and pulses, fruit, fruit and vegetable juice, fish and shellfish, and dairy products. In older women, DS users had a significantly lower rice intake than non-users, but significantly higher intakes of fruit, total vegetables, fruit and vegetable juice, and dairy products.
Energy-adjusted intake (g/d) of food groups of the study participants according to DS use * , †

Table 2. Long description
The table presents the energy-adjusted intake of various food groups among younger, middle-aged, and older women, comparing DS users and non-users. It includes data for rice, noodles, bread, other grain products, nuts and pulses, potatoes, sugar and confectionaries, fat and oil, fruit, total vegetables, fruit and vegetable juice, alcoholic beverages, tea and coffee, soft drinks, fish and shellfish, meat, eggs, and dairy products. The table shows mean intake values and standard deviations for each food group across the different age categories and user statuses. Notable trends include lower rice intake among DS users across all age groups, higher fruit and vegetable intake among DS users, and variations in the consumption of nuts, pulses, and dairy products.
DS, dietary supplement.
* Values are mean (sd).
† The components of food groups are shown in online Supplementary Table 1. Energy-adjusted values were calculated by dividing crude food intake by crude energy intake and then multiplying by estimated energy requirements.
‡ P-values for differences between DS users and non-users based on Student’s t test.
§ This variable was not assessed for older women because of a lack of information from brief diet history questionnaire.
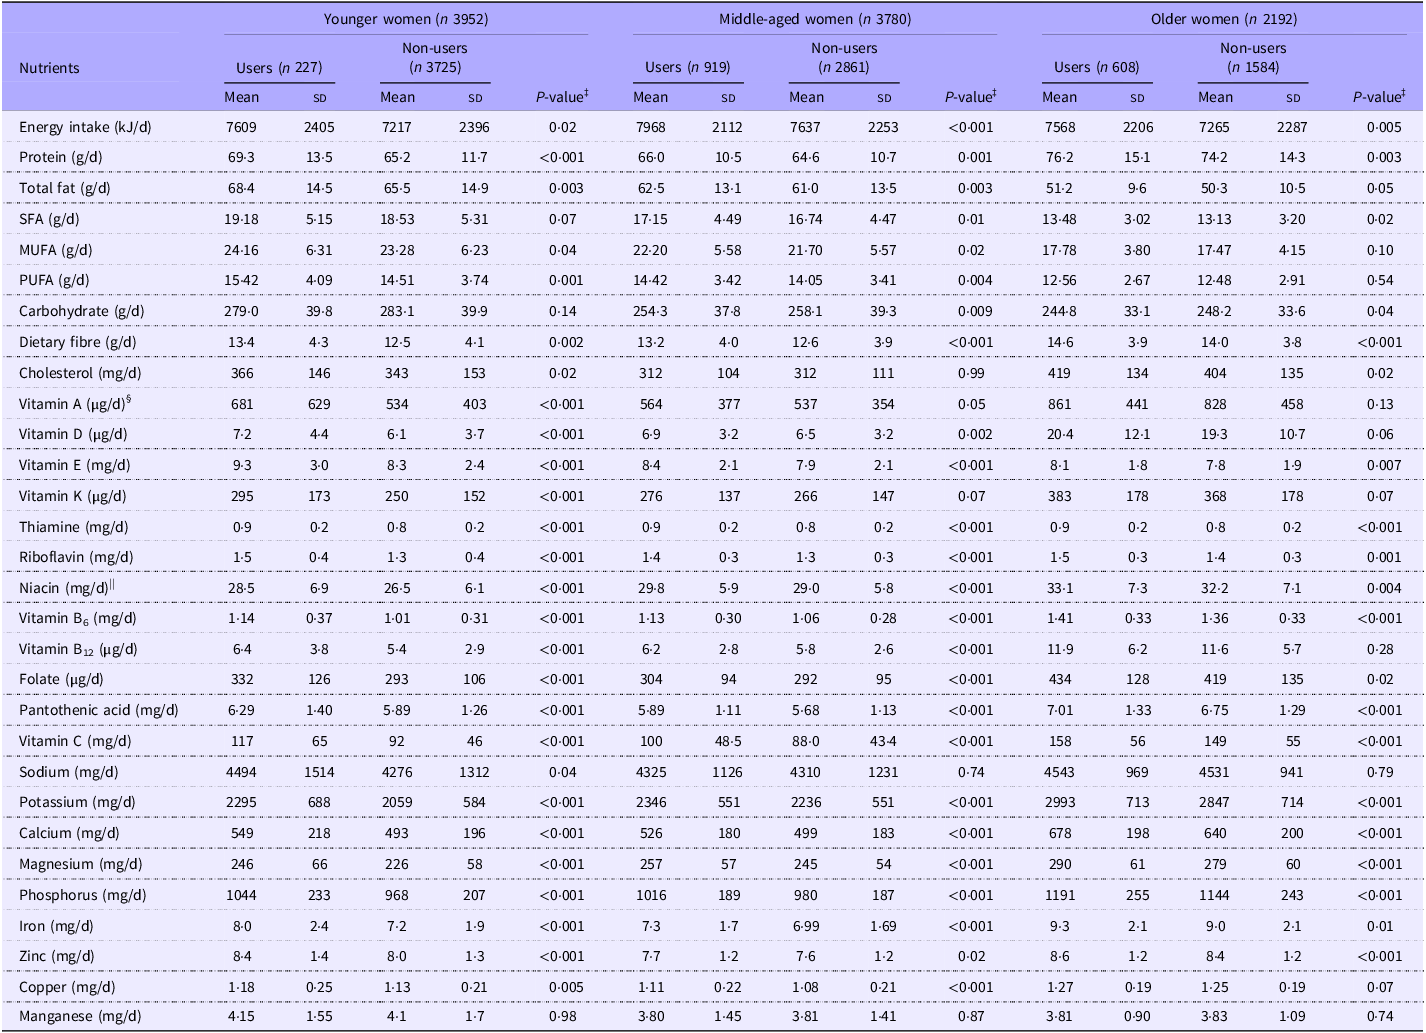
The mean intakes of 29 nutrients in DS users and non-users are presented in Table 3. It should be noted that nutrient intakes presented here represent intake from foods only and do not include nutrients derived from DS. DS users tended to have significantly higher micronutrient intakes than non-users. In younger women, DS users had significantly higher intakes than non-users for almost all nutrients, except for SFA, carbohydrates and manganese. Among middle-aged women, DS users consumed less carbohydrates than non-users and higher amounts of nutrients than non-users for most nutrients, except for cholesterol, vitamin A, vitamin K, sodium and manganese. In older women, DS users consumed less carbohydrate than non-users and significantly higher intakes than non-users for most nutrients, except for total fat, MUFA, PUFA, vitamin A, vitamin D, vitamin K, vitamin B12, sodium, copper and manganese.
Energy intake and energy-adjusted nutrient intake from foods in the study participants according to DS use * , †

Table 3. Long description
The table presents a comparison of nutrient intake among younger, middle-aged, and older women, categorized by DS users and non-users. It includes data on energy intake, protein, total fat, saturated fatty acids (SFA), monounsaturated fatty acids (MUFA), polyunsaturated fatty acids (PUFA), carbohydrates, dietary fiber, cholesterol, vitamins (A, D, E, K, B6, B12, folate, pantothenic acid, niacin, riboflavin, thiamine), minerals (sodium, potassium, calcium, magnesium, phosphorus, iron, zinc, copper, manganese), and more. The table shows mean values and standard deviations for each nutrient across the different age groups and usage categories. Notably, DS users generally have higher intakes of most nutrients compared to non-users, with some exceptions such as SFA, carbohydrates, and manganese in younger women, and certain vitamins and minerals in middle-aged and older women.
DS, dietary supplement.
* Values are mean (sd).
† Energy-adjusted values were calculated by dividing crude nutrient intake by crude energy intake and then multiplying by estimated energy requirements.
‡ P-values for differences between DS users and non-users based on Student’s t test.
§ Sum of retinol (μg), β-carotene/12 (μg), α-carotene/24 (μg) and β-cryptoxanthin (μg).
|| Sum of niacin (mg) and tryptophan/60 (mg).
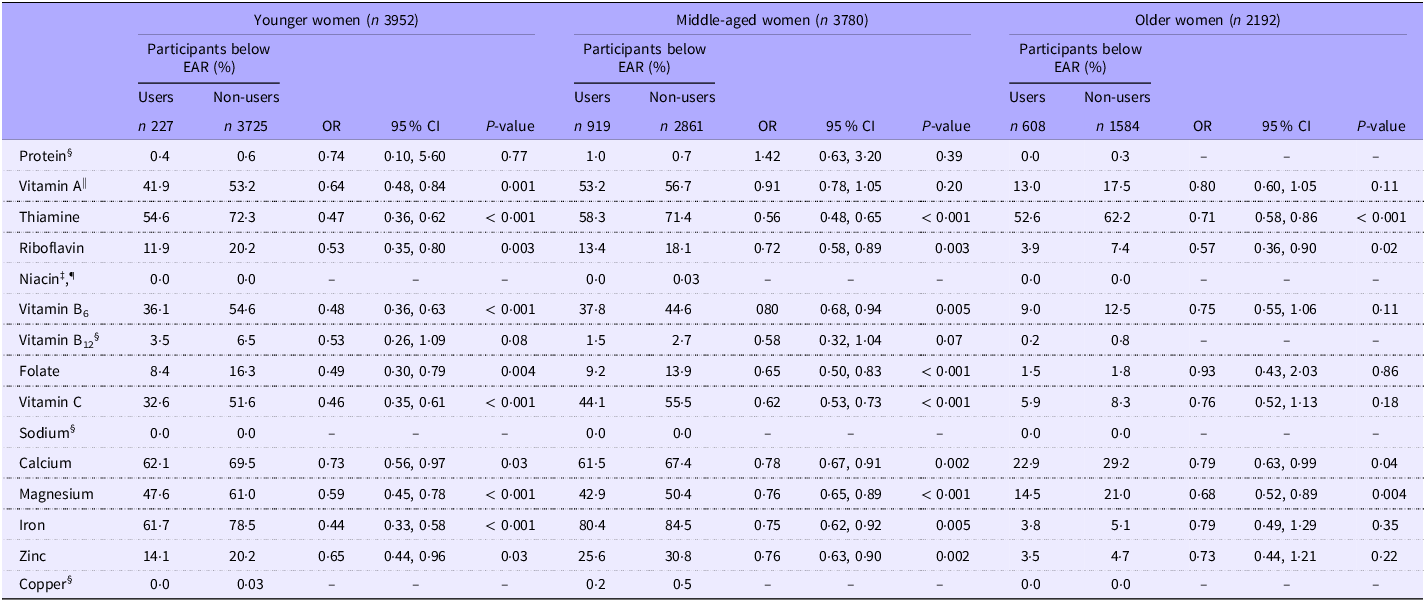
Table 4 shows the proportion of participants with inadequate nutrient intake, defined as intake below the EAR, in each nutrient. Among younger women, inadequate calcium intake was the most prevalent among DS users (62·1 %), while inadequate iron intake was the most prevalent among non-users (78·5 %). For middle-aged women, inadequate iron intake showed the highest prevalence in both DS users (80·4 %) and non-users (84·5 %). Among older women, inadequate thiamine intake was the most common among DS users (52·6 %) and non-users (62·2 %). In all three age groups, there were few or no individuals whose intake of niacin, sodium or copper was below the EAR. Additionally, in older women, there were few individuals whose intake of vitamin B12 was below the EAR. We also examined the association between DS use and the inadequacy of each nutrient. In younger women, DS users had significantly higher proportions of achieving adequate nutrient intakes for vitamin A, thiamine, riboflavin, vitamin B6, folate, vitamin C, calcium, magnesium, iron and zinc. In middle-aged women, DS use was associated with more adequate intake for thiamine, riboflavin, vitamin B6, folate, vitamin C, calcium, magnesium, iron and zinc. Among older women, DS users had significantly higher adequacy for thiamine, riboflavin, calcium and magnesium.
Probability of inadequacy of nutrient intake according to DS use by multivariable-adjusted logistic regression analysis among younger, middle-aged and older women * , † , ‡

Table 4. Long description
The table presents data on the proportion of participants with inadequate nutrient intake, defined as intake below the Estimated Average Requirement (EAR), across three age groups of women: younger (3952 participants), middle-aged (3780 participants), and older (2192 participants). The table is divided into columns showing the percentage of participants below EAR for users and non-users of dietary supplements (DS), along with the odds ratio (OR), 95% confidence interval (CI), and P-value for each nutrient. Key nutrients analyzed include protein, vitamin A, thiamine, riboflavin, niacin, vitamin B6, vitamin B12, folate, vitamin C, sodium, calcium, magnesium, iron, zinc, and copper. Among younger women, inadequate calcium intake is most prevalent among DS users (62.1%), while inadequate iron intake is most prevalent among non-users (78.5%). For middle-aged women, inadequate iron intake is highest in both DS users (80.4%) and non-users (84.5%). Among older women, inadequate thiamine intake is most common among DS users (52.6%) and non-users (62.2%). The table also shows that DS users generally have higher proportions of adequate nutrient intakes for various nutrients across all age groups, with significant associations noted for several nutrients. The data highlights the impact of dietary supplement use on nutrient adequacy across different age groups.
DS, dietary supplement; EAR, estimated average requirement .
* Energy-adjusted values were calculated by dividing crude intake by crude energy intake and then multiplying by estimated energy requirements. EAR is a value determined as the amount that half of the population needs to meet their requirements, with the aim of avoiding insufficient intake. The EAR values were based on the Dietary Reference Intakes for Japanese 2020 and shown in online Supplementary Table 2(19).
† Adjustment was made for weight status, residential block, size of residential area, physical activity, smoking, alcohol drinking, sleep duration, history of chronic disease and depression symptoms. For middle-aged and older women, additional adjustment was made for age and education level.
‡ OR means the probability that the nutrient intake from foods is below the EAR in DS users when compared with non-users.
§ Hyphens indicated that the OR could not be calculated due to the small number of individuals with nutrient intake below the EAR.
|| Sum of retinol (μg), β-carotene/12 (μg), α-carotene/24 (μg) and β-cryptoxanthin (μg).
¶ Sum of niacin (mg) and tryptophan/60 (mg).
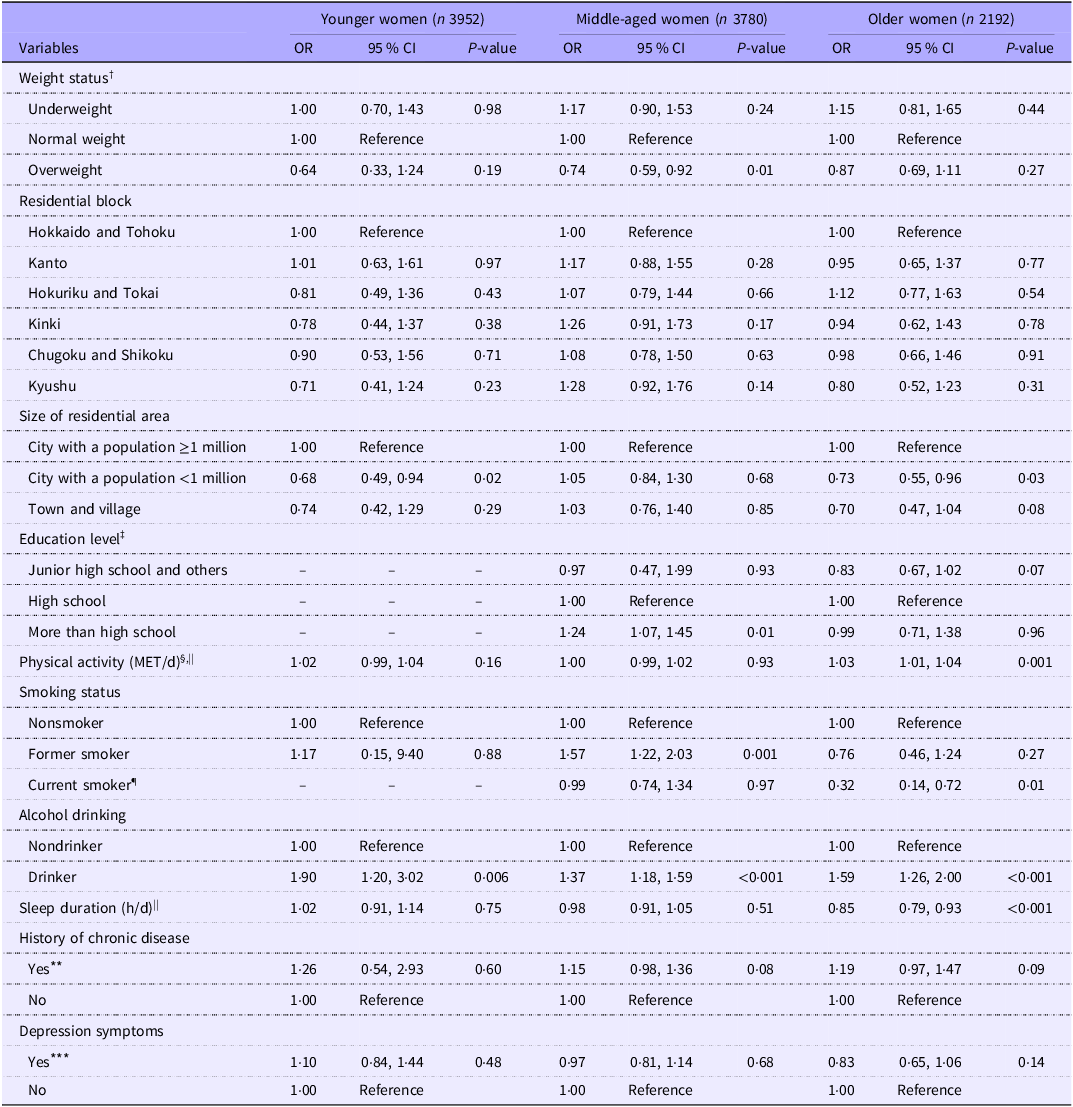
In multivariate models, sociodemographic and lifestyle characteristics associated with DS use were examined (Table 5). Among younger women, DS use was significantly higher in alcohol drinkers compared with nondrinkers and in those living in a city with a population ≥1 million. Among middle-aged women, alcohol drinkers also had significantly higher DS use. Additionally, overweight participants showed significantly lower DS use compared with those of normal weight, while participants with more than a high school education and former smokers exhibited significantly higher DS use. Among older women, DS use was significantly higher in alcohol drinkers and in those living in a city with a population ≥1 million. Conversely, current smokers showed significantly lower DS use compared with nonsmokers. Furthermore, among older women, physically active corresponded to greater DS use, while longer sleep duration corresponded to lower DS use.
Characteristics related to the use of DS by multivariable-adjusted logistic regression analysis among younger, middle-aged and older women in Japan *

Table 5. Long description
The table presents data on the characteristics related to the use of DS among younger, middle-aged, and older women in Japan. It includes variables such as weight status, residential block, size of residential area, education level, physical activity, smoking status, alcohol drinking, sleep duration, history of chronic disease, and depression symptoms. The table has 13 rows and 12 columns, with columns for odds ratio (OR), 95 percentage confidence interval (CI), and P-value for each age group. Notable trends include higher DS use among alcohol drinkers across all age groups, lower DS use among overweight middle-aged women, and higher DS use among physically active older women.
DS, dietary supplement; MET: Metabolic equivalents.
* Adjustment was made for weight status, residential block, size of residential area, physical activity, smoking, alcohol drinking, sleep duration, history of chronic disease and depression symptoms. For middle-aged and older women, additional adjustment was made for age and education level.
† Underweight, normal weight and overweight were defined based on BMI (kg/m2) of < 18·5, ≥18·5 to < 25 and ≥25, respectively(31).
‡ The category of ‘more than high school’ included university, two-year college and technical schools. This variable was not included in the questionnaire for younger women as they were all first-year university students.
§ Physical activity was calculated based on the frequency and duration of seven activities (walking, bicycling, standing, running, high-intensity activities, sleeping and sedentary activity)(Reference Ainsworth, Haskell and Herrmann32).
|| The OR of physical activity or sleep duration means that more physical activity or sleep duration increases the chances of being DS users.
¶ The OR of current smoker for younger women was not calculated because there were no current smokers among the younger women in this study.
** For younger women, this category included individuals who had ever been diagnosed by a doctor for heart disease, diabetes or gynaecological disease. For middle-aged and older women, this category included individuals who had ever been diagnosed by a doctor for cancer, CVD, hypertension, dyslipidaemia, diabetes and gynaecological disease.
*** This category includes individuals who were considered to have depression symptoms (16 points or more out of 60) based on the Center for Epidemiologic studies Depression scale(Reference Radloff24–Reference Murakami, Mizoue and Sasaki26).
Discussion
To our knowledge, this is the first study to explore differences in characteristics between DS users and non-users in different age groups of women (younger, middle-aged and older women). Compared with non-users, DS users had some common characteristics among two or three generations, such as living in a city with a population ≥1 million and drinking alcohol. Still, these characteristics differed depending on the age group. Additionally, regardless of age group, DS users were more likely to have adequate intakes of vitamins and minerals, such as thiamine, riboflavin and calcium, compared with non-users. However, the difference in nutrient intake between DS users and non-users was smaller in older women than in other age groups.
In this study, the proportion of DS users was 5·7 % in younger women, 24·3 % in middle-aged women and 27·7 % in older women. These proportions were somewhat lower than those reported in previous studies in Japanese, 16·7 % among female students aged 18–24 years in 2016(Reference Kobayashi, Sato and Umegaki11) and 34·4 % among female nursing professionals aged 28–81 years in 2013(Reference Kishi, Ideno and Nagai15). The difference in the prevalence of DS users between studies may be due to differences in the survey method and the definition of DS. The study among female students(Reference Kobayashi, Sato and Umegaki11) defined DS users as those currently using any DS at the time of the survey, with no specified reference period. In that study, ‘dietary supplement’ was defined as what students considered to have beneficial effects on their health (e.g. vitamins, minerals, fish oil, amino acids and cereals), except for food consumed daily (e.g. vegetables, fruit, milk and tofu)(Reference Kobayashi, Sato and Umegaki11). The participants were simply asked, ‘Which DS are you using or did you use?’ in a free-answer format for up to five items, without a requirement to provide specific product names(Reference Kobayashi, Sato and Umegaki11). The study among female nursing professionals(Reference Kishi, Ideno and Nagai15) defined DS users as those consuming DS at least twice a week. In that study, no specific definition of ‘DS’ was provided. While specific product names were recorded, the survey covered a broad range of items, including vinegar and garlic(Reference Kishi, Ideno and Nagai15). Comparing these studies, fewer participants were classified as users in our study, despite our broader one-month recall period compared with the ‘current use’(Reference Kobayashi, Sato and Umegaki11) or ‘twice-weekly’(Reference Kishi, Ideno and Nagai15). This suggests that the discrepancy is primarily due to our stricter definition of DS. While it remains unclear how much these variations in methodology and definition impact the results, further research is needed to standardise these factors to improve the comparability of reported prevalence across studies.
A higher prevalence of DS users was observed in middle-aged and older women compared with younger women in this study. Similarly, previous research has reported that older people have a higher prevalence of DS use(Reference Keshavarz, Shafiee and Islam6,Reference Cowan, Jun and Gahche7,Reference Kishi, Ideno and Nagai15) . This result of our study may be attributable to the purpose of using DS and the definition of DS. Some previous studies have suggested that the primary purpose of using DS is to maintain health across all ages(Reference Tse, Chan and Wong33,Reference Izukura, Ishibasi and Ampo34) . Specifically, in Japan, the proportion of participants citing health maintenance increased with age, while those using DS for beauty purposes was higher among younger generations(Reference Izukura, Ishibasi and Ampo34). Among middle-aged women, DS use may be motivated by a combination of beauty-related concerns and growing health awareness, as a transition between the motivations observed in younger and older age groups, though further research is needed to clarify this. In this study, DS were defined as products intended to address nutritional deficiencies and maintain or improve health status, which aligns with the primary purpose of DS use among older adults(Reference Izukura, Ishibasi and Ampo34) and likely contributed to the significantly higher prevalence of DS users observed in the older age groups.
DS users across all three age groups had fewer participants with inadequate intakes of micronutrients, such as thiamine, riboflavin and calcium. These findings are consistent with previous studies conducted among Korean adults(Reference Kang, Kim and Baek2) and French adults(Reference Pouchieu, Andreeva and Péneau9,Reference Fassier, Egnell and Pouchieu14) . The difference in nutrient intake between DS users and non-users may have been due to higher intake of specific food groups, such as nuts and pulses, vegetables, fruit, fish and shellfish, and dairy products. It is noteworthy that even among DS users, more than 60 % of young and middle-aged women had calcium or iron intakes below the EAR. The high proportion of Japanese women with inadequate intakes of calcium or iron (below the EAR) was also observed in a previous study(Reference Shinozaki, Murakami and Masayasu35), and this may be a characteristic of Japanese women regardless of their DS use. Nevertheless, the results of this study indicate that people who have little benefit from DS for nutrient intake might be using DS.
Compared with younger and middle-aged women, older women had fewer nutrients that showed significant differences in food-derived nutrient adequacy between DS users and non-users. This finding partially contradicts a previous study in Brazil, which reported that differences in dietary micronutrient intake between supplement users and non-users were greater among women aged 60 and over(Reference Pavlak, Drehmer and Mengue17). This discrepancy may be partly attributable to differences in the definition of DS: the Brazilian study focused exclusively on vitamin and/or mineral supplements, whereas the present study used a broader definition of DS. In addition, differences in dietary patterns between Brazilian and Japanese populations may have contributed to the divergent findings. In Japan, inadequate iron intake has been reported to be particularly prevalent among women aged 12–64 years but less so in older age groups(Reference Shinozaki, Murakami and Masayasu35), suggesting that older Japanese women may already have relatively better dietary nutrient adequacy, which could explain the smaller differences observed in this age group.
Some sociodemographic and lifestyle characteristics of DS users were common among the two or three age groups. DS use in all three age groups was significantly higher in alcohol drinkers compared with nondrinkers. In younger and older women, living in a city with a population ≥1 million was positively associated with DS use. Consistent with our findings, previous studies have reported that DS users tended to live in urban areas(Reference Keshavarz, Shafiee and Islam6,Reference Gong, Liu and Yao8) . An earlier study found that people who consumed alcohol more than once a month were more likely to use DS than nondrinkers(Reference Ishihara, Sobue and Yamamoto10,Reference Smith, Wilson and Parnell13) . Given that some studies have shown that DS users had lower alcohol consumption than non-users(Reference Kang, Kim and Baek2,Reference Pouchieu, Andreeva and Péneau9) , considering the amount of alcohol consumption could reveal more detailed characteristics of DS users. However, the results regarding alcohol consumption among younger women should be interpreted cautiously, since the legal drinking age in Japan is 20 and over(36), and the percentage of alcohol drinkers among younger women was relatively low.
On the other hand, some sociodemographic and lifestyle characteristics of DS users differed by age group. Among middle-aged women, having more than a high school education level was positively associated with DS use, while being overweight was negatively associated, which aligns with the results of previous studies(Reference Keshavarz, Shafiee and Islam6–Reference Gong, Liu and Yao8). Former smokers were less likely to use DS compared with nonsmokers in middle-aged women. Some studies have reported that not current smokers were more likely to use DS(Reference Keshavarz, Shafiee and Islam6,Reference Cowan, Jun and Gahche7) , and the results of this study are partially consistent with previous findings. Among older women, physical activity was positively associated with DS use, whereas current smoking was negatively associated, which are consistent with previous findings(Reference Keshavarz, Shafiee and Islam6,Reference Cowan, Jun and Gahche7,Reference Pouchieu, Andreeva and Péneau9,Reference Ishihara, Sobue and Yamamoto10) . Additionally, sleep duration was inversely correlated with DS use in older women. Although few studies have examined the relationship between DS use and sleep duration, previous research has shown no relationship between calcium and iron DS use and sleep duration(Reference Sato, Tsubota-Utsugi and Chiba37). Differences in DS users’ characteristics by age group may partly reflect variations in commonly used DS. A previous study conducted among Greek women reported that the types of DS used differed significantly by age group; for example, iron supplements were more commonly used among younger women, whereas calcium and vitamin D were more prevalent among older women(Reference Kanellou, Papatesta and Martimianaki38). Furthermore, a cohort study among Canadian adults aged 35–69 years suggested that dietary characteristics of DS users differ depending on the type of DS used(Reference Robson, Siou and Ullman39). These findings suggest that age-related differences in DS type preferences may partly explain the variation in characteristics observed among DS users across age groups in the present study. However, no studies have examined the interaction between DS types and user characteristics across age groups. Focusing on these points could provide a better understanding of the characteristics of DS users.
A major strength of this study is the large sample size, including younger, middle-aged and older women recruited from multiple regions across Japan. Additionally, we used validated dietary questionnaires(Reference Kobayashi, Murakami and Sasaki21–Reference Sasaki, Yanagibori and Amano23). Furthermore, we clearly defined DS and collected specific product names from participants, which allowed for more precise classification of DS users and non-users compared with previous studies that relied on broader or less specific definitions.
This study has several limitations. First, participants were not a random sample of Japanese women. In 2014, 55·5 % of Japanese adolescents entered college or university(40), and participants in this study, which focused primarily on college or university students and their families, were likely to be of high socio-economic status. Previous studies have reported that people with a high income level are more likely to use DS(Reference Cowan, Jun and Gahche7,Reference Gong, Liu and Yao8) . Although this study did not directly assess participants’ socio-economic status, the percentage of DS users in this study may have been overestimated. Furthermore, younger participants in this study consisted of dietetic students, who may have had greater interest in nutrition and health than the general population of Japanese women, potentially leading to an overestimation of DS use in this age group. However, participants were recruited at their first lecture before nutrition education had begun, and those who responded after May 19 were excluded to minimise the influence of nutrition lectures on dietary behaviours. Additionally, younger women were limited to those aged 18 years, and the findings for this age group may not be generalisable to Japanese women aged 19–33 years. Second, the response rate among mothers and grandmothers was relatively low compared with students. This may have introduced self-selection bias in the middle-aged and older age groups, potentially limiting the representativeness of these groups, independent of the prevalence of DS use. Third, dietary assessment in this study relied on self-report, which is partially prone to reporting bias. Moreover, the DHQ and BDHQ have not been designed to assess nutrient inadequacy based on the Dietary Reference Intakes for Japanese(Reference Kobayashi, Murakami and Sasaki21–Reference Sasaki, Yanagibori and Amano23). However, these questionnaires have been validated in Japanese women, and energy-adjusted values were used to minimise systematic errors(Reference Murakami, Sasaki and Uenishi29). Fourth, DS use was also self-reported. In Japan, there is no standardised or widely accepted definition of DS. This lack of clarity may have led to variability in participants’ understanding, potentially resulting in misreporting of DS use. However, we clearly defined DS and classified DS users and non-users according to the reported product names. Fifth, since this study was a cross-sectional study, it was not possible to investigate the causal relationship between DS use and users’ characteristics. Sixth, the list of chronic diseases assessed differed slightly across age groups, reflecting the original questionnaire design of this secondary analysis dataset. This variation may limit direct comparisons of the role of chronic disease history across age groups. Finally, as this survey was conducted in 2011 and 2012, the findings might not fully reflect the current situation. However, previous studies have reported that the characteristics of DS users have remained stable over the past decade(Reference Keshavarz, Shafiee and Islam6,Reference Ishihara, Sobue and Yamamoto10,Reference Lyle, Mares-Perlman and Klein41,Reference Kwon42) . Further research using up-to-date data is needed.
In conclusion, this study identified the proportion of DS users by age group among Japanese women. In all age groups, DS users were more likely to consume alcohol compared with nondrinkers. Additionally, DS users were more likely to live in a city with a population ≥1 million among younger and older women. In middle-aged women, higher education level and being a former smoker were positively associated with DS use, while being overweight was negatively associated. In older women, being physically active and having shorter sleep duration were positively associated with DS use. In all age groups, DS users were more likely to have adequate nutrient intakes compared with non-users, and fewer significant differences in nutrient inadequacy were observed between DS users and non-users in older women compared with younger and middle-aged women. This study suggested that Japanese women who used DS had little benefit from using DS to supplement their nutrient intake as DS users generally already achieved adequate nutrient intakes compared with non-users. However, further research using a larger and more representative sample is needed.
Supplementary material
For supplementary material/s referred to in this article, please visit https://doi.org/10.1017/S000711452610751X.
Acknowledgements
This study was supported by JSPS KAKENHI from Japan Society for the Promotion of Science. The Japan Society for the Promotion of Science had no role in the design, analysis or writing of this article. The authors would like to thank ‘Three-generation Study of Women on Diets and Health’ Study Group and Satoshi Sasaki, Hitomi Suga and Satomi Kobayashi for data collection
The author’s contributions are as follows: N. S., K. M., K. T. I., R. O. contributed to the conceptualisation of this study; R. O. analysed data; R. O. wrote the paper; N. S., K. M., K. T. I. and S. S. provided feedback on the research plan and the manuscript. All authors have read and approved the final manuscript.
The authors declare no conflict of interest.


 Open access

