Introduction
Feldspars are among the most common minerals in the Earth’s crust, and are widely studied at extreme conditions (e.g. Goldsmith, Reference Goldsmith1950; Smith and Brown, Reference Smith and Brown1988; Deer et al., Reference Deer, Howie and Zusmann2001; Krivovichev, Reference Krivovichev2020; Gorelova, Reference Gorelova2023). To date, according to the Commission on New Minerals, Nomenclature and Classification of the International Mineralogical Association (Back, Reference Back2022) the feldspar group includes 20 minerals with a three-dimensional framework of TO4 tetrahedra (T = Be, Zn, Al, B, Fe, Si, As, P). According to Krivovichev (Reference Krivovichev2020), the feldspar family includes 29 mineral species with five different topologies, three of which (feldspar, paracelsian and svyatoslavite) are a TO4-based framework, the fourth is TO4-based layered (dmisteinbergite) framework and the last one consists of TO6 octahedra (hollandite).
Traditionally, the basis of feldspar crystal structures with feldspar (fsp) and paracelsian (pcl) topologies is described as a crankshaft chain of TO4 tetrahedra, which, when connected to each other, form a three-dimensional framework (Megaw, Reference Megaw, MacKenzie and Zussman1974). The difference between fsp and pcl topologies is in the rotational orientation of the crankshaft chains (crystal structure flexibility; Smith, Reference Smith1968, Reference Smith1974). The three-dimensional framework of both topologies can be also described as consisting of four-and eight-membered rings of TO4 tetrahedra (e.g. Smith and Rinaldi, Reference Smith and Rinaldi1962), i.e. having quite large cavities that are occupied by large cations (e.g. Na, K, Rb, (NH4), Ca, Sr, Ba, Pb). The coordination number of large cations range between 7 and 10, depending on topology and cation size: for crystal structures with pcl topology, a lower coordination number is more common, if compared with fsp topology.
Although the synthetic Ga-/Ge-analogues of feldspars are known (e.g. Goldsmith, Reference Goldsmith1950; Kroll et al., Reference Kroll, Floegel, Breit, Loens and Pentinghaus1991; Liu et al., Reference Liu, Chen, Weng, Tu and Zhao2003; Qin et al., Reference Qin, Kržmanc, Meden and Suvorov2009), natural feldspars contain only trace amounts of Ga and/or Ge (e.g. Bruno and Pentinghaus, Reference Bruno, Pentinghaus, Mackenzie and Zussmann1974). The gallium concentration in feldspars is usually below 30 ppm and rarely varies (e.g. Larsen, Reference Larsen2002; Morozova et al., Reference Morozova, Zozulya, Selivanova, Serov and Bazai2022), but can reach 60 ppm (e.g. Sánchez-Muñoz et al., Reference Sánchez-Muñoz, Müller, Andrés, Martin, Modreski and de Moura2017). The Ge content is in the range of 1–4 ppm (Geldron, Reference Geldron1983; Bernstein, Reference Bernstein1985; Frenzel et al., Reference Frenzel, Ketris and Gutzmer2014), but could reach 30 ppm (e.g., Sánchez-Muñoz et al., Reference Sánchez-Muñoz, Müller, Andrés, Martin, Modreski and de Moura2017). The Ga/Ge ratio in feldspars can be used for discrimination of different types of pegmatite (Sánchez-Muñoz et al., Reference Sánchez-Muñoz, Müller, Andrés, Martin, Modreski and de Moura2017), whereas the Ge/Si ratio in feldspars can be used as a sensitive indicator of hydrogeochemical conditions (Dobrzyński et al., Reference Dobrzyński, Karasiński, Tetfejer, Tupys, Słaby and Stępień2024).
It is noteworthy that Ge forms a larger number of minerals, although the concentration of Ga in the Earth’s crust is generally higher. According to the list of minerals approved by the International Mineralogical Association, to date, 39 Ge-containing minerals are known (almost 2/3 of which are oxygen-free). Gallium is an essential element in only eight minerals, half of which are oxygen-free. Only four minerals contain both Al and Ge [carboirite FeAl2GeO5(OH)2 (Johan et al., Reference Johan, Oudin and Picot1983), galloplumbogummite Pb(Ga,Al,Ge)3(PO4)2(OH)6 (Schlüter et al., Reference Schlüter, Malcherek and Mihailova2014), krieselite Al2(GeO4)F2 (Schlüter et al., Reference Schlüter, Geisler, Pohl and Stephan2010) and mathewrogersite Pb7FeAl3GeSi12O36(OH,H2O)6 (Keller and Dunn, Reference Keller and Dunn1986)], and only two of them contain both Ge and Ga in their end-member formulae [galloplumbogummite and zincobriartite Cu2(Zn,Fe)(Ge,Ga)S4 (McDonald et al., Reference McDonald, Stanley, Ross and Nestola2016)].
From a crystal chemical viewpoint, gallium and germanium are similar to aluminium and silicon, respectively. Due to this similarity, synthetic compounds, containing Ga and Ge instead Al and Si are used traditionally as materials for modelling the Earth’s interior processes at lower and experimentally reproducible pressure-temperature (PT) conditions. Although it is believed that chemical deformations induced by incorporation of larger cations (Ga and Ge instead of Al and Si) lead to similar structural changes as for temperature increasing or pressure decreasing (Filatov, Reference Filatov1990), isotypical compounds under ambient conditions can undergo a different polymorphic transformation pathway under extreme conditions, depending on chemical composition. For example, KAlSi3O8 is crystallized in feldspar, dmisteinbergite and hollandite topologies (Hwang et al., Reference Hwang, Shen, Chu, Yui, Liou, Sobolev, Zhang, Shatsky and Zayachkovsky2004; Ma et al., Reference Ma, Tschauner, Beckett, Rossman, Prescher, Prakapenka, Bechtel and MacDowell2018), whereas KGaSi3O8 is known with feldspar topology only (Kimata et al., Reference Kimata, Saito and Shimizu1995) and both KAlGe3O8 and KGaGe3O8 are crystallized in feldspar and paracelsian topologies (Klaska and Jarchow, Reference Klaska and Jarchow1977; Kroll et al., Reference Kroll, Floegel, Breit, Loens and Pentinghaus1991; Liu et al., Reference Liu, Chen, Weng, Tu and Zhao2003; Qin et al., Reference Qin, Kržmanc, Meden and Suvorov2009). Moreover, the melt process of these phases also differs: KAlSi3O8 and KGaSi3O8 melt incongruently with the formation of leucite-like phases (KAlSi2O6 and KGaSi2O6, respectively), whereas KGaGe3O8 and KAlGe3O8 melt congruently (Goldsmith, Reference Goldsmith1950).
Given the known differences in the crystal structures and behaviour of KAlSi3O8, KGaSi3O8, KGaGe3O8 and KAlGe3O8, listed above, it seems worthwhile to study the similarities and differences in their high-temperature behaviour. Thus, the aim of this work was to investigate the high-temperature behaviour of KGaGe3O8 and KAlGe3O8, which crystallize in similar topologies (fsp and pcl), and compare their behaviour with other isotypical compounds. Despite the fact that both compounds (in both topologies) have been known for more than 70 years, these data had not been obtained previously.
Materials and methods
Synthesis, phase and chemical composition
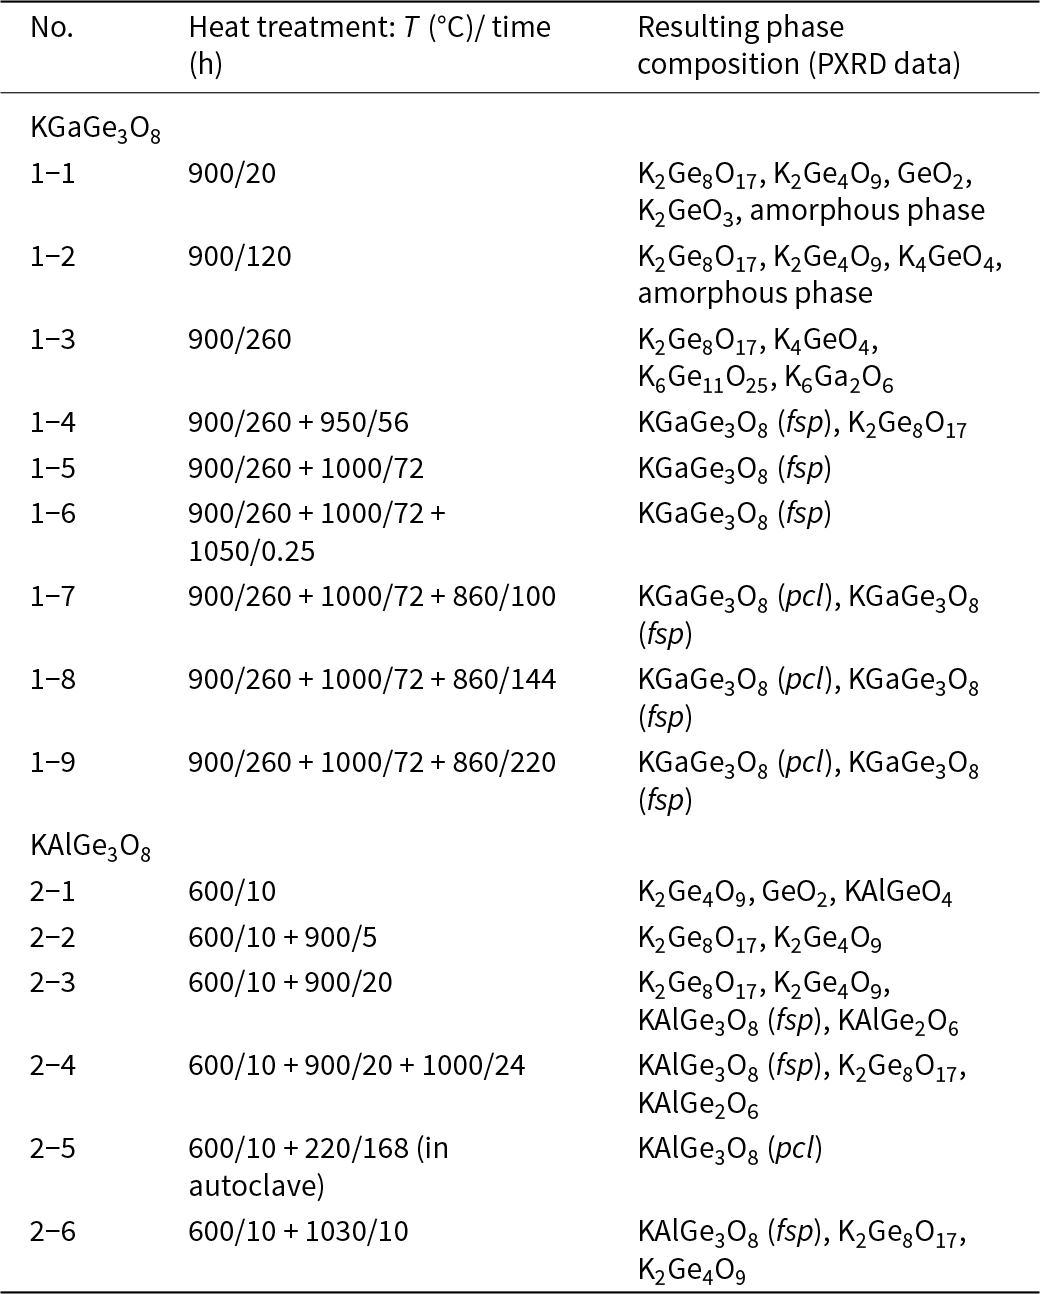
KAlGe3O8 and KGaGe3O8 were synthesized from chemically pure K2CO3 (99.99%, Sigma-Aldrich), Al2O3/Ga2O3 (99.99%, Sigma-Aldrich), and GeO2 (99.99%, Sigma-Aldrich) taken in stoichiometric ratios. Both modifications of KGaGe3O8 were synthesized by high-temperature solid-state reactions. The reagent mixtures were ground thoroughly in agate mortars, pressed into pellets, and transferred to platinum crucibles. To obtain samples of both topologies, the mixture was heat-treated in air at 600–1000°C (Table 1). A similar procedure with the heat treatment at 600–1030°C was used to obtain KAlGe3O8 with fsp topology, whereas to obtain the pcl-like modification of KAlGe3O8, a sample preheated at 600°C was transferred to a Teflon liner containing distilled water. The liner was sealed and placed in an autoclave, which was then heated in an oven at 220°C for 7 days before cooling to room temperature.
Synthesis conditions and resulting phase composition for KGaGe3O8 and KAlGe3O8

Table 1 Long description
Columns list sample number, heat treatment temperature in degrees C and time in hours, and resulting phase composition from PXRD data, grouped for KGaGe3O8 and KAlGe3O8. For KGaGe3O8, 900 degrees C for 20 hours yields K2Ge8O17, K2Ge4O9, GeO2, K2GeO3, and an amorphous phase; 900 degrees C for 120 hours yields K2Ge8O17, K2Ge4O9, K4GeO4, and an amorphous phase. At 900 degrees C for 260 hours the phases are K2Ge8O17, K4GeO4, K6Ge11O25, and K6Ga2O6; adding 950 degrees C for 56 hours gives KGaGe3O8 (fsp) with K2Ge8O17. Adding 1000 degrees C for 72 hours gives KGaGe3O8 (fsp), and adding 1050 degrees C for 0.25 hours still gives KGaGe3O8 (fsp). After 900 degrees C for 260 hours plus 1000 degrees C for 72 hours, additional treatment at 860 degrees C for 100, 144, or 220 hours yields mixtures of KGaGe3O8 (pcl) and KGaGe3O8 (fsp). For KAlGe3O8, 600 degrees C for 10 hours yields K2Ge4O9, GeO2, and KAlGeO4; adding 900 degrees C for 5 hours yields K2Ge8O17 and K2Ge4O9. Adding 900 degrees C for 20 hours yields K2Ge8O17, K2Ge4O9, KAlGe3O8 (fsp), and KAlGe2O6; adding 1000 degrees C for 24 hours yields KAlGe3O8 (fsp) with K2Ge8O17 and KAlGe2O6. A separate route of 600 degrees C for 10 hours plus 220 degrees C for 168 hours in an autoclave yields KAlGe3O8 (pcl), while 600 degrees C for 10 hours plus 1030 degrees C for 10 hours yields KAlGe3O8 (fsp) with K2Ge8O17 and K2Ge4O9.
The phase composition of all synthesized samples was controlled by powder X-ray diffraction (PXRD) using a MiniFlex II (Rigaku Oxford Diffraction, Japan) diffractometer (CuKα1+2 radiation, 30 kV/15 mA, Bragg-Brentano geometry, PSD D/teX Ultra). The chemical composition of the obtained compounds was controlled using a S-3400N scanning electron microscope (Hitachi, Japan) equipped with AzTec Energy 350 energy dispersive (EDX) spectrometer (Oxford Diffraction, UK).
High-temperature powder X-ray diffraction
The high-temperature (HT) behaviour of all the compounds studied was investigated under heating in air by HT PXRD using an Ultima IV (Rigaku, Japan) diffractometer (CuKα radiation, 40 kV/30 mA, Bragg-Brentano geometry, PSD D/teX Ultra detector) with a thermo-attachment in the range 30–1110°C with temperature steps of 30°C. The finely-powdered sample was deposited on a platinum sample holder (20 × 12 × 1.5 mm) from an ethanol suspension (Filatov, Reference Filatov1971). An external Si standard was used before the measurements to control the 2θ correctness and platinum was used as an internal standard during the experiment. Calculations of the unit-cell parameters were performed using the program package Topas 4.2 (Dinnebier et al., Reference Dinnebier, Leineweber and Evans2019). The temperature dependence of the unit-cell parameters was described by linear and quadratic polynomial functions using the TTT program package (Bubnova et al., Reference Bubnova, Firsova and Filatov2013), which was also used for visualization of the thermal expansion parameters. Additionally, the thermal expansion coefficients were calculated using Fei (Fei, Reference Fei1995) and Kroll (Kroll et al., Reference Kroll, Kirfel, Heinemann and Barbier2012) models using the EOSfit7c program (Angel et al., Reference Angel, Gonzalez-Platas and Alvaro2014) taking into account results from Tribaudino et al. (Reference Tribaudino, Bruno, Nestola, Pasqual and Angel2011).
Results
Formation conditions and crystal structures of KMeGe3O8 (Me = Al, Ga) compounds
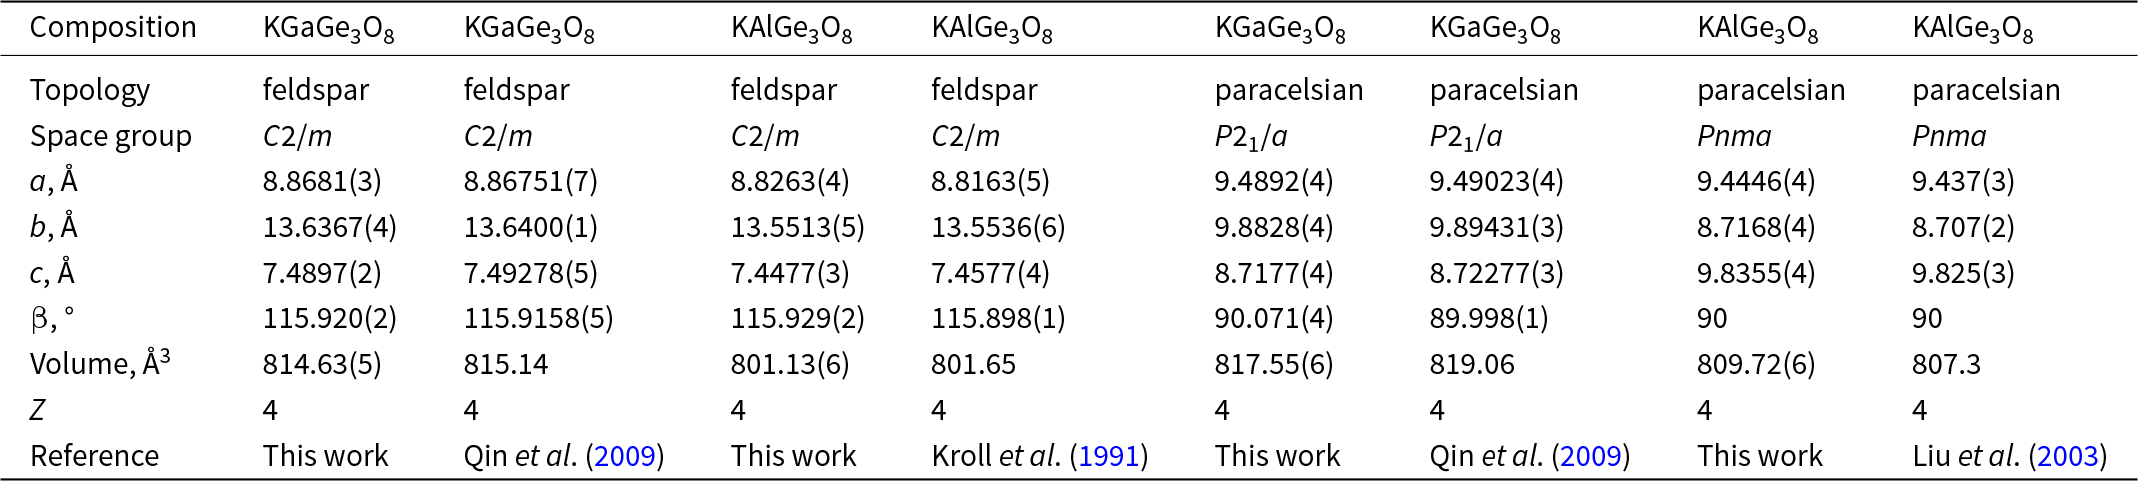
KAlGe3O8 with feldspar topology (fsp-KAlGe3O8) and both modifications of KGaGe3O8 were obtained using a solid-state synthesis method only, whereas paracelsian-like KAlGe3O8 (pcl-KAlGe3O8) was synthesized via a hydrothermal method (Tables 1 and 2). Formation of KGaGe3O8 with feldspar (sp.gr. C2/m) topology (fsp-KGaGe3O8) starts at 950°C, but the sample also contains admixture of K2Ge8O17. The formation of pure fsp-KGaGe3O8 occurs at temperatures 1000–1050°C. Paracelsian-like KGaGe3O8 (sp.gr. P21/a; pcl-KGaGe3O8) has been obtained from fsp-KGaGe3O8 by the heat treatment at 860°C, but regardless of time of the heat treatment, the samples obtained contain the admixture of fsp-KGaGe3O8. Formation of fsp-KAlGe3O8 (sp.gr. C2/m) starts at a slightly higher temperature compared to KGaGe3O8, i.e. at 1000°C, but even at 1030°C it contains a small admixture of K2Ge8O17 and K2Ge4O9.
Crystallographic data of alkaline feldspar-related compounds with feldspar and paracelsian topology

Table 2 Long description
Crystallographic entries compare KGaGe3O8 and KAlGe3O8 across feldspar and paracelsian topology, listing space group, a, b, c in angstroms, beta in degrees, volume in cubic angstroms, Z, and reference. For feldspar topology, all four columns use space group C2/m, with a from 8.8163(5) to 8.8681(3), b from 13.5513(5) to 13.6400(1), c from 7.4477(3) to 7.49278(5), beta from 115.898(1) to 115.929(2), and volume from 801.13(6) to 815.14. For paracelsian topology, KGaGe3O8 uses space group P21/a in two columns, with a 9.4892(4) and 9.49023(4), b 9.8828(4) and 9.89431(3), c 8.7177(4) and 8.72277(3), beta 90.071(4) and 89.998(1), and volume 817.55(6) and 819.06. For paracelsian KAlGe3O8, both columns use space group Pnma, with a 9.4446(4) and 9.437(3), b 8.7168(4) and 8.707(2), c 9.8355(4) and 9.825(3), beta 90 and 90, and volume 809.72(6) and 807.3. Z is 4 in every column. References listed are This work, Qin et al. (2009), this work, Kroll et al. (1991), this work, Qin et al., (2009), this work, and Liu et al. (2003.
Chemical analysis of the obtained compounds showed that all of them are stoichiometric (K:Al:Ge and K:Ga:Ge 1:1:3, respectively) and do not contain impurities according to the quantities determined by EDX (> 0.1 wt.%).
Thermal behaviour of KMeGe3O8 (Me = Al, Ga) compounds
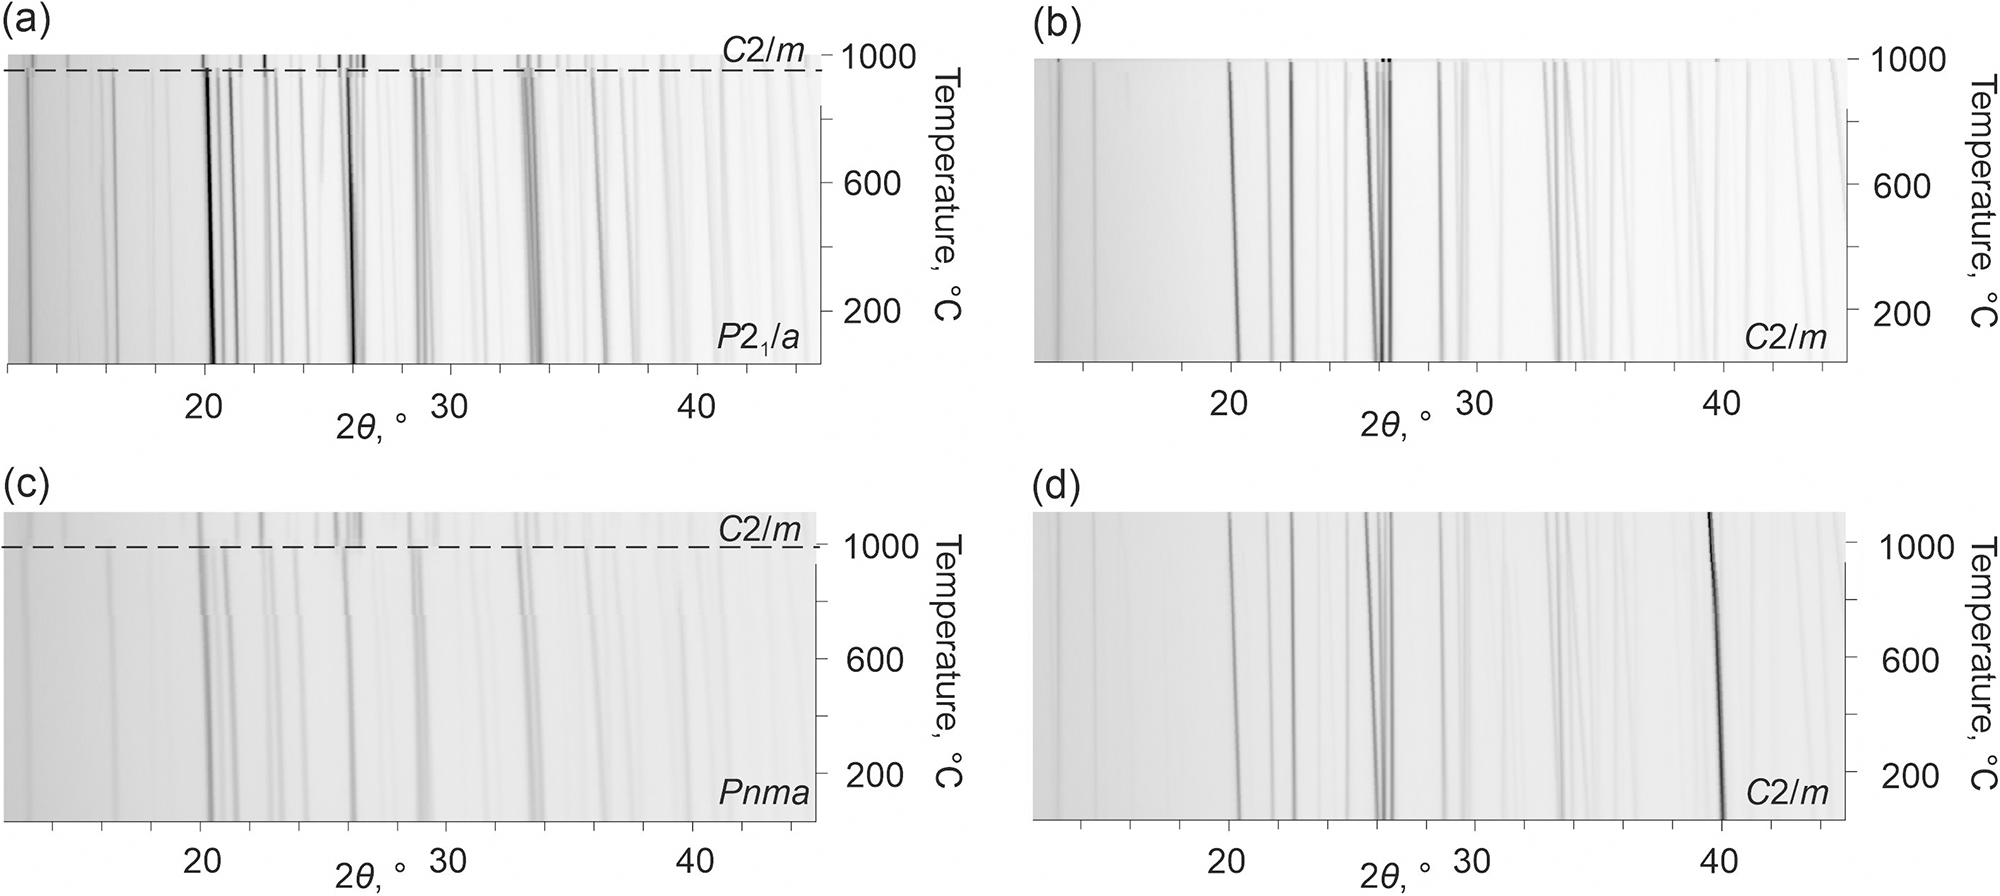
The evolution of PXRD patterns of both studied modifications of KAlGe3O8 and KGaGe3O8 is presented as two-dimensional plots in Fig. 1. The experiments show that both pcl-like phases undergo the irreversible polymorphic transformation into feldspar-like phases at the temperatures above 930 ± 30 and 960 ± 30°C for KGaGe3O8 and KAlGe3O8, respectively. Reheating of samples confirms the stability of new fsp phases up to ∼990 and ∼1080°C for KGaGe3O8 and KAlGe3O8, respectively, that is in agreement with the data on their melting points (1000 and 1122°C, respectively; Goldsmith, Reference Goldsmith1950).
The evolution of the PXRD patterns of KGaGe3O8 (a and b) and KAlGe3O8 (c and d) upon heating. Phase transitions are marked.

Figure 1 Long description
A powder X-ray diffraction intensity map for KGaGe3O8. The horizontal axis is labeled 2 theta in degrees, ranging from 20 to 40. The vertical axis is labeled Temperature in degrees Celsius, ranging from 200 to 1000. Grayscale intensity represents diffraction intensity, with vertical bands indicating Bragg reflections. Phase labels C2/m and P2 subscript 1 slash a are present, marking phase regions. A PXRD map for KGaGeO, with similar axes as image. Vertical bands are clustered around mid-2 theta, indicating phase transitions. Phase label C2/m is visible. A PXRD map for KAlGeO. Axes are consistent with previous images. A dashed horizontal line indicates a transition boundary. Phase labels C2/m and Pcm2 subscript 1 are present. A PXRD map for KAlGeO. Axes are consistent with previous images. A prominent high-2 theta reflection is visible, indicating phase changes. Phase label C2/m is present. These maps illustrate temperature-dependent phase behavior, with changes in reflection intensity and position indicating phase transitions.
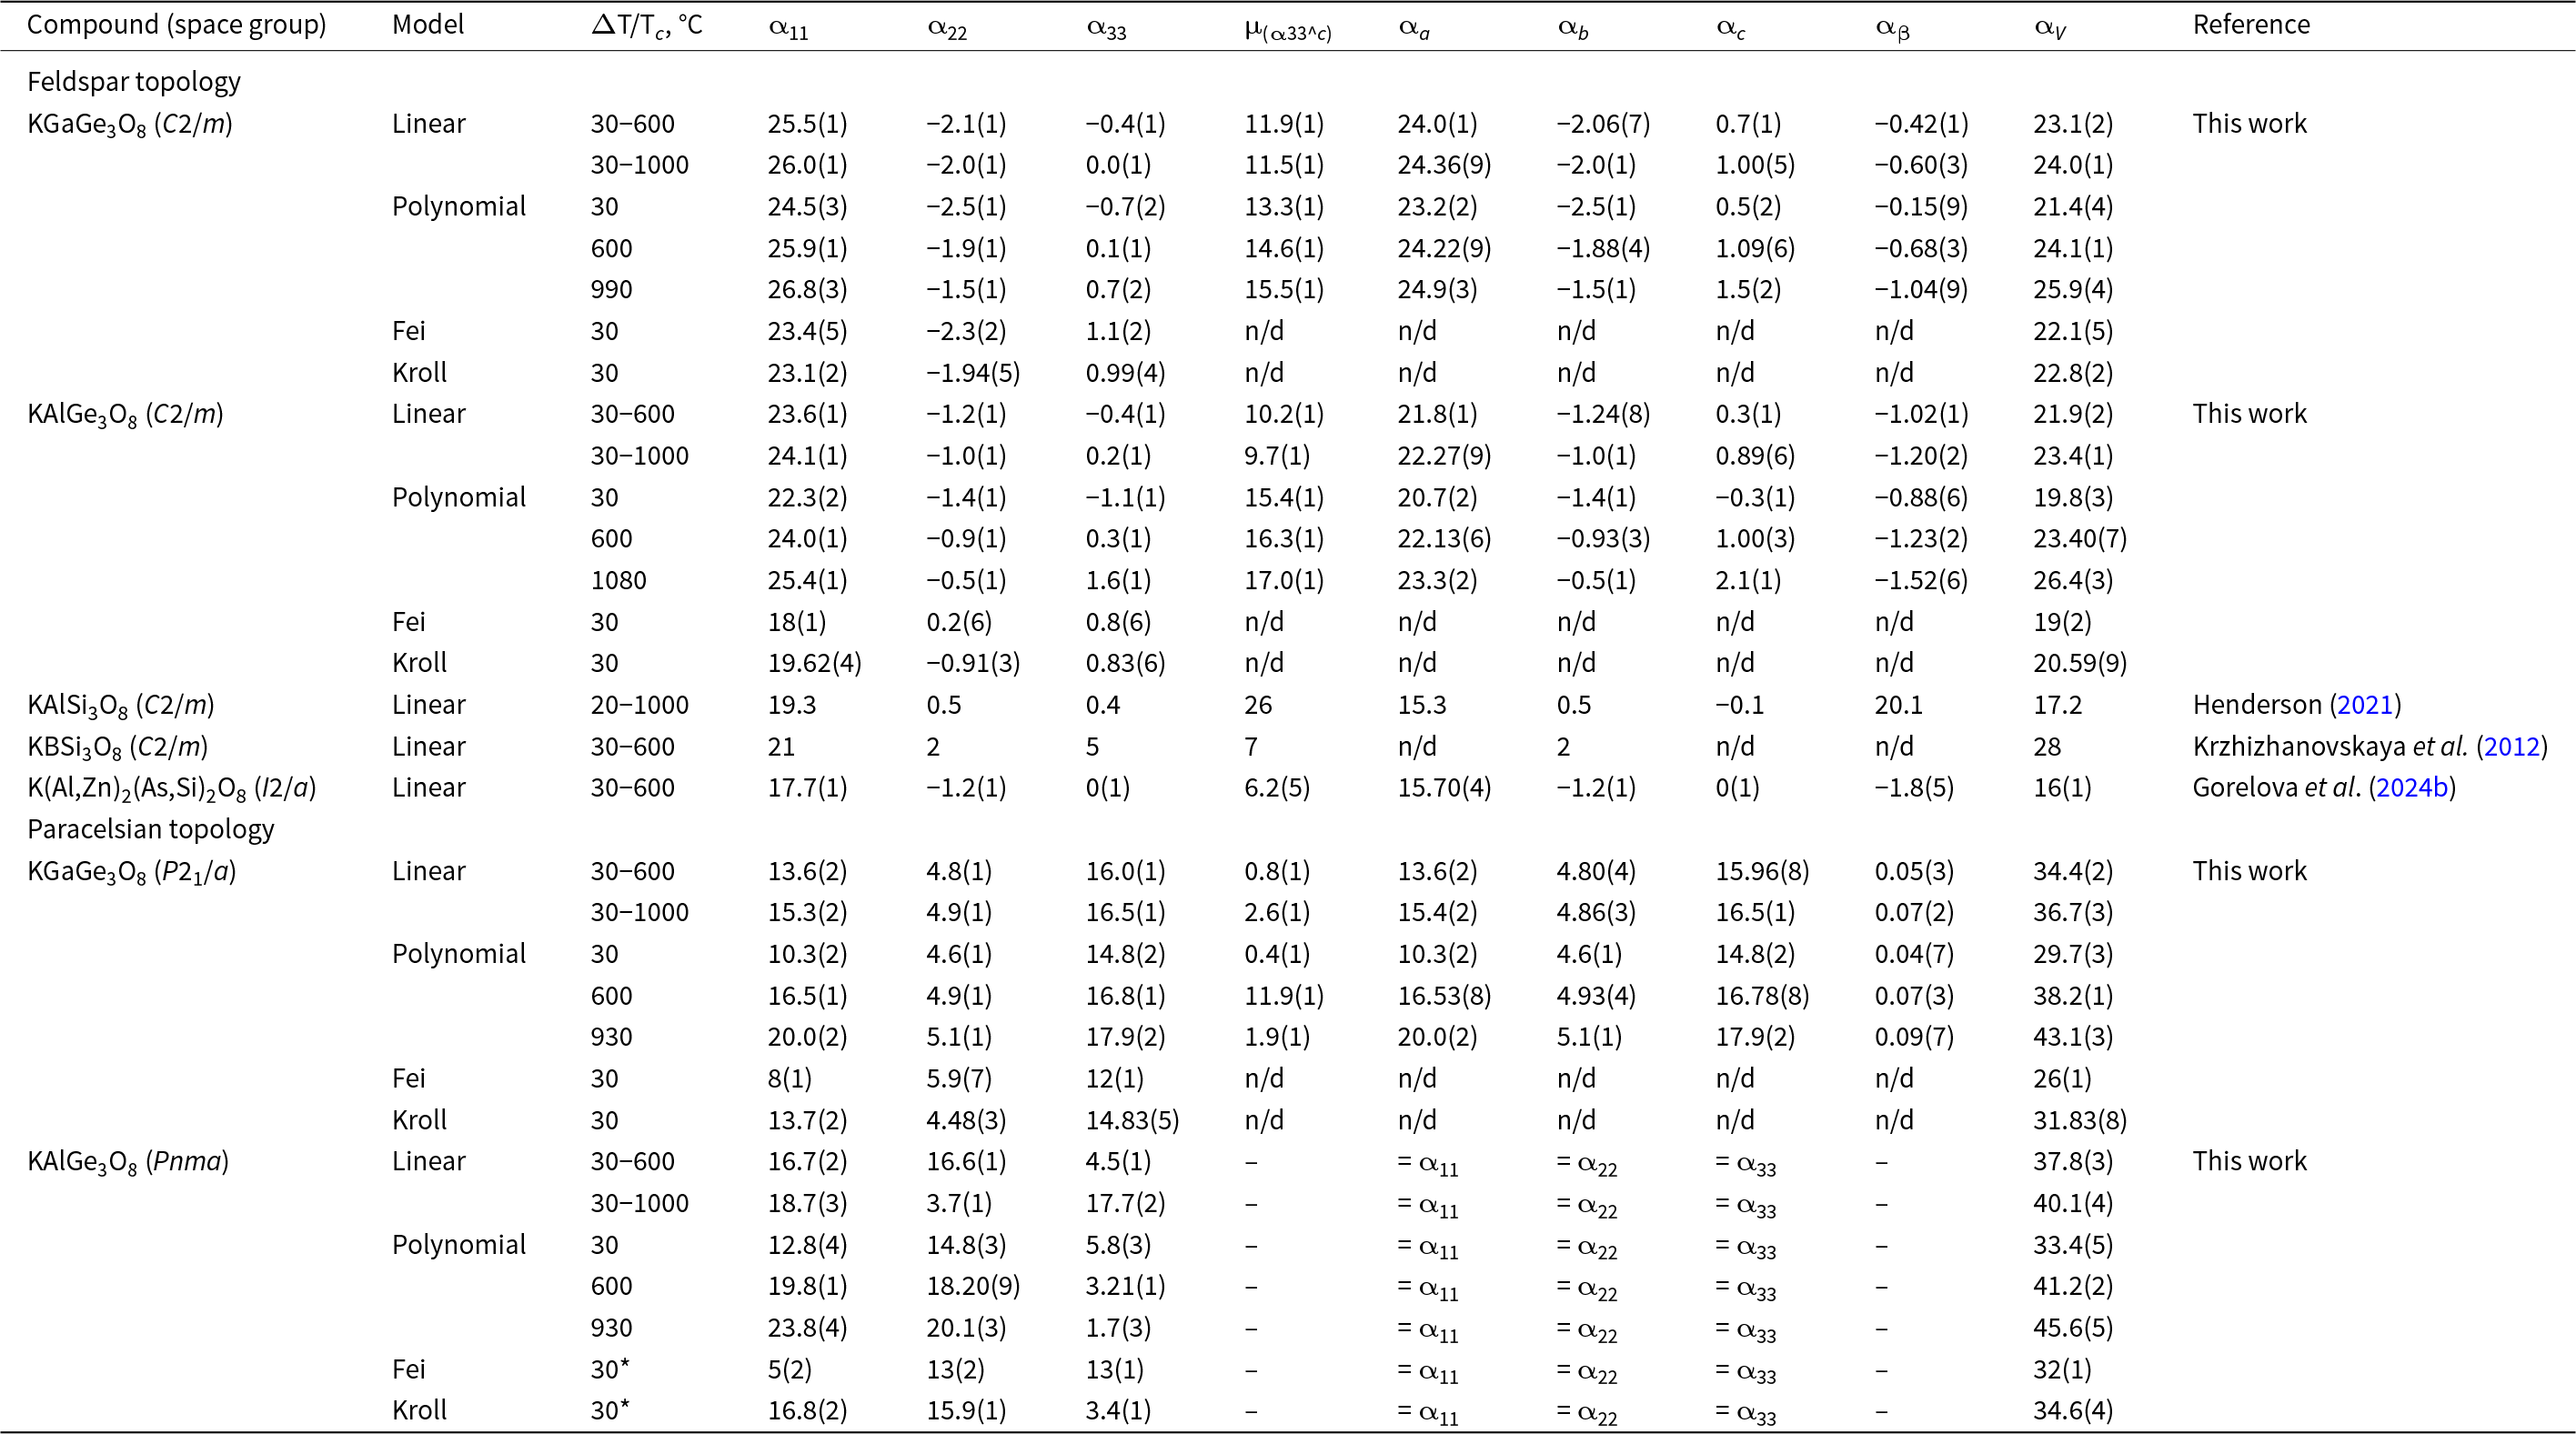
As was mentioned above, the thermal expansion coefficients for the studied compounds have been calculated using four different approaches, namely first- (linear) and second-order (quadratic) polynomials and using Fei and Kroll models (Table 3). As shown previously for pyroxenes (Hovis et al., Reference Hovis, Tribauldino, Leaman, Almer, Altomare, Morris, Maksymiw, Morris, Jackson, Scott, Tomaino and Mantovani2021), under ambient conditions the numbers, obtained by the last three methods are very close to each other. Therefore, second-order polynomial approximation was used for straightforward comparison with all known datasets and TECs figure drawings.
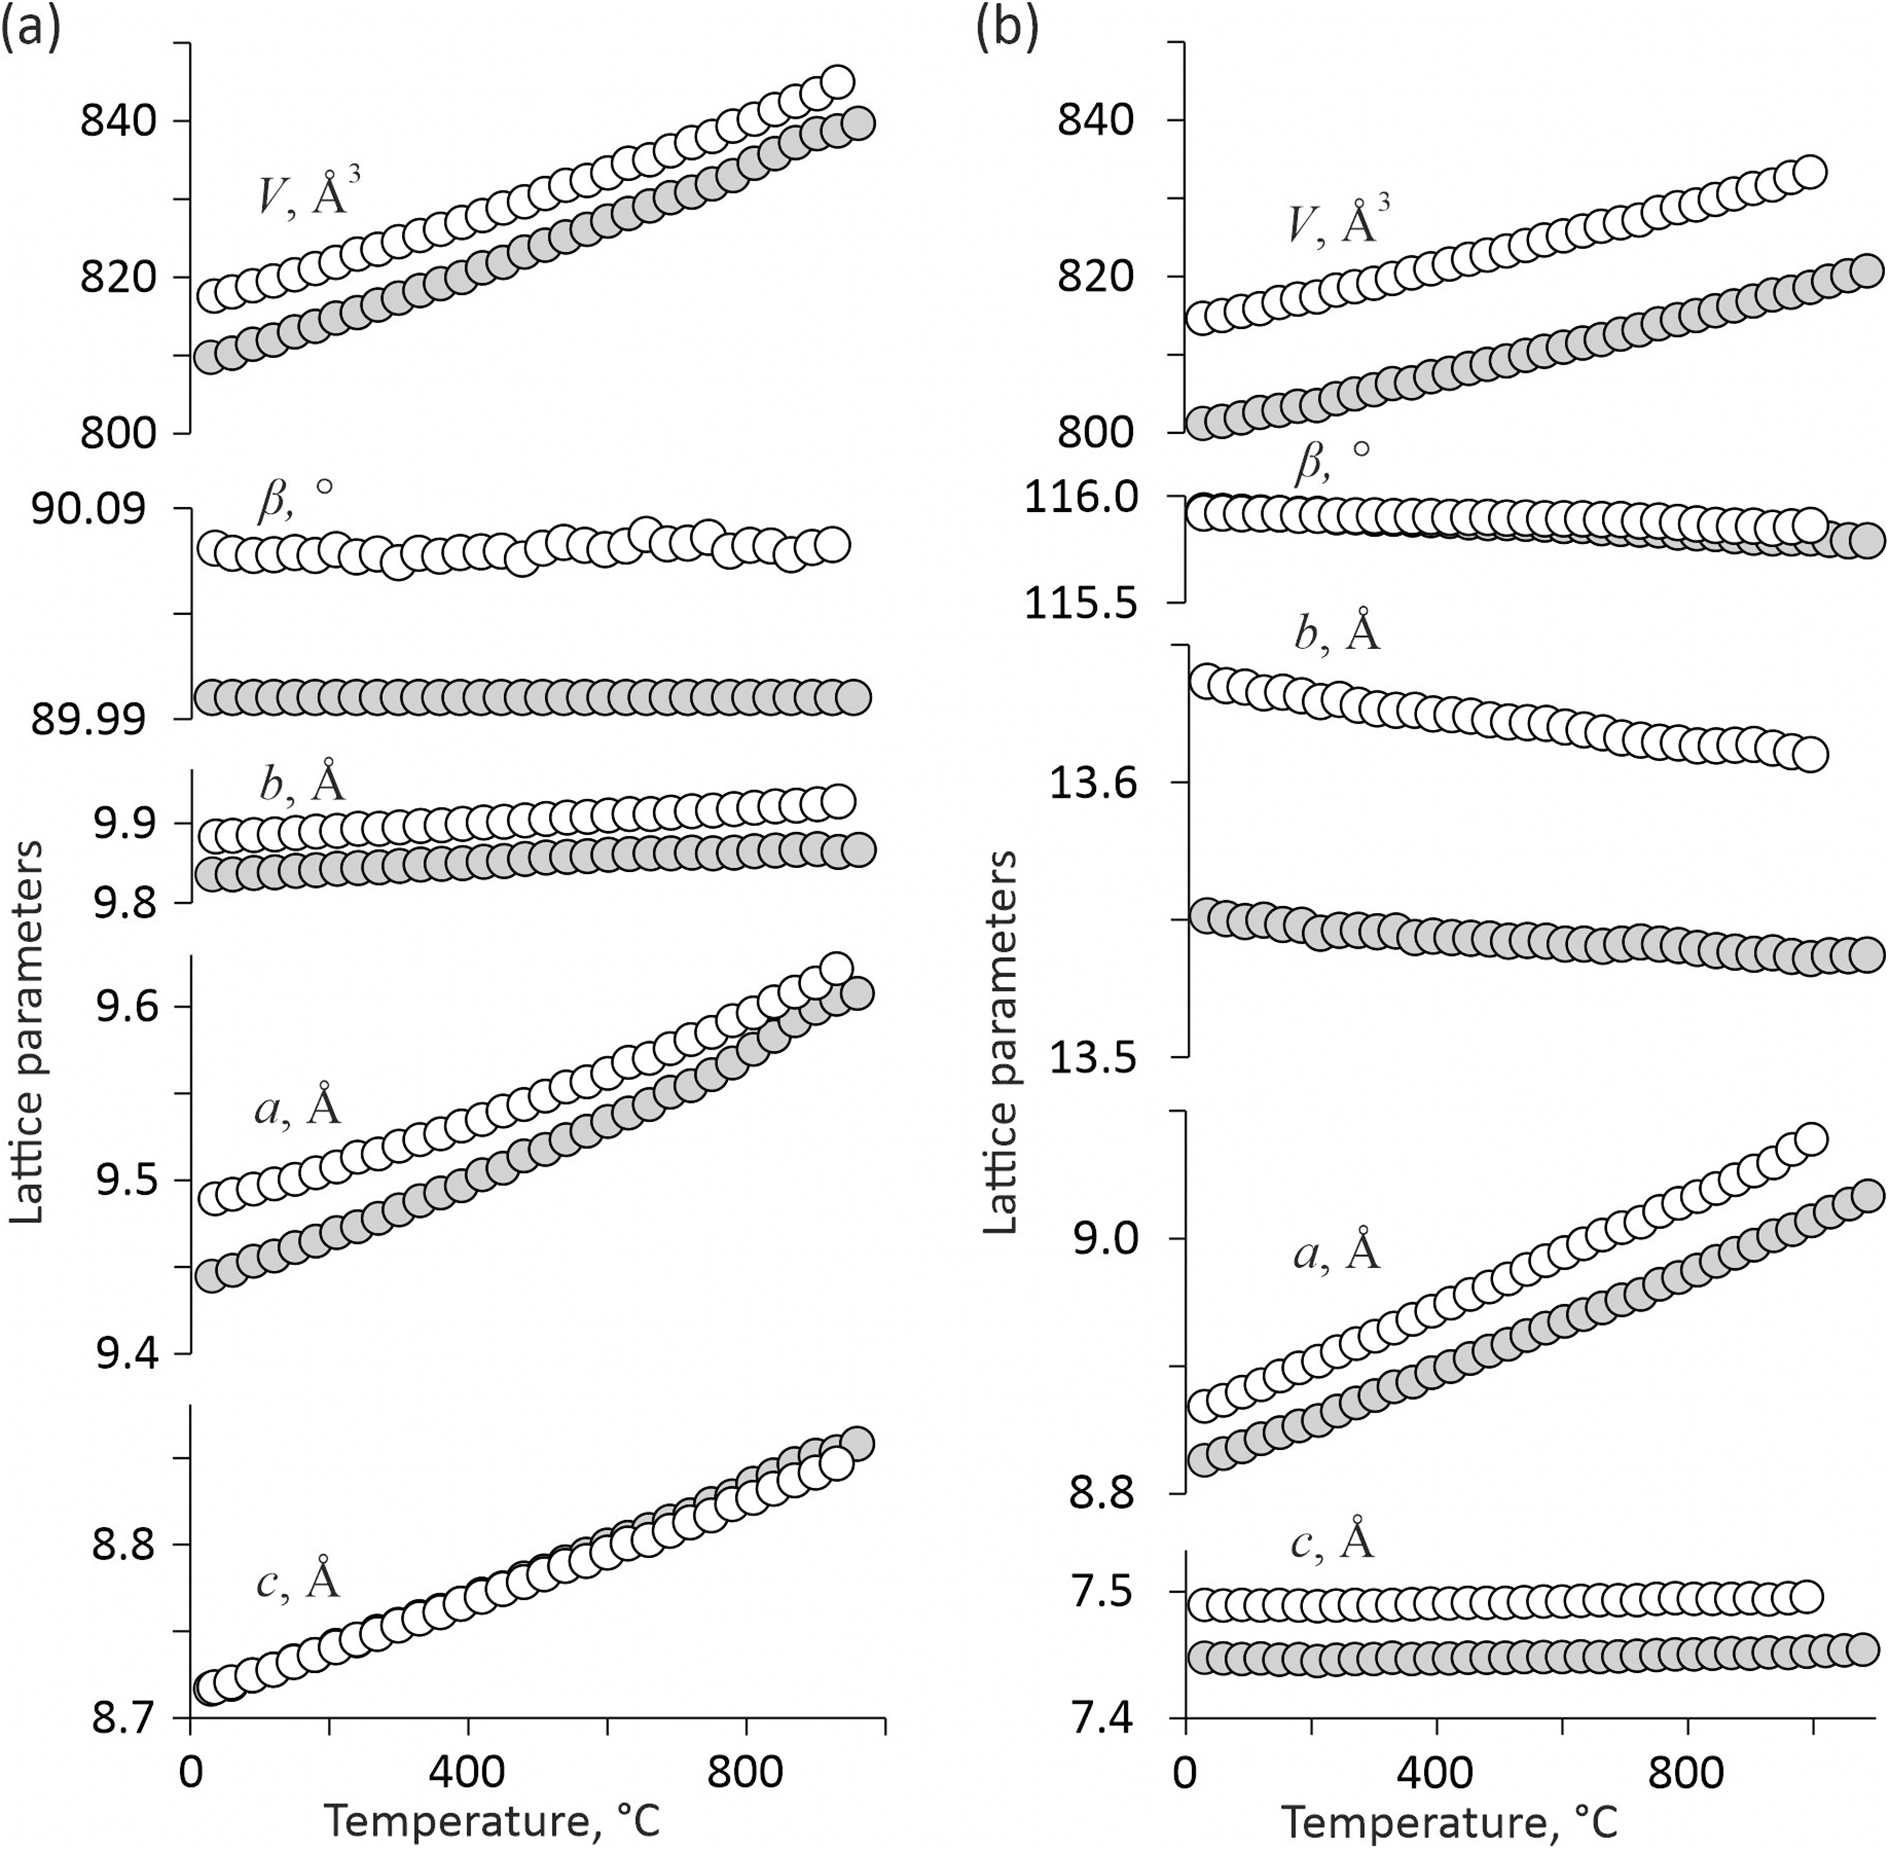
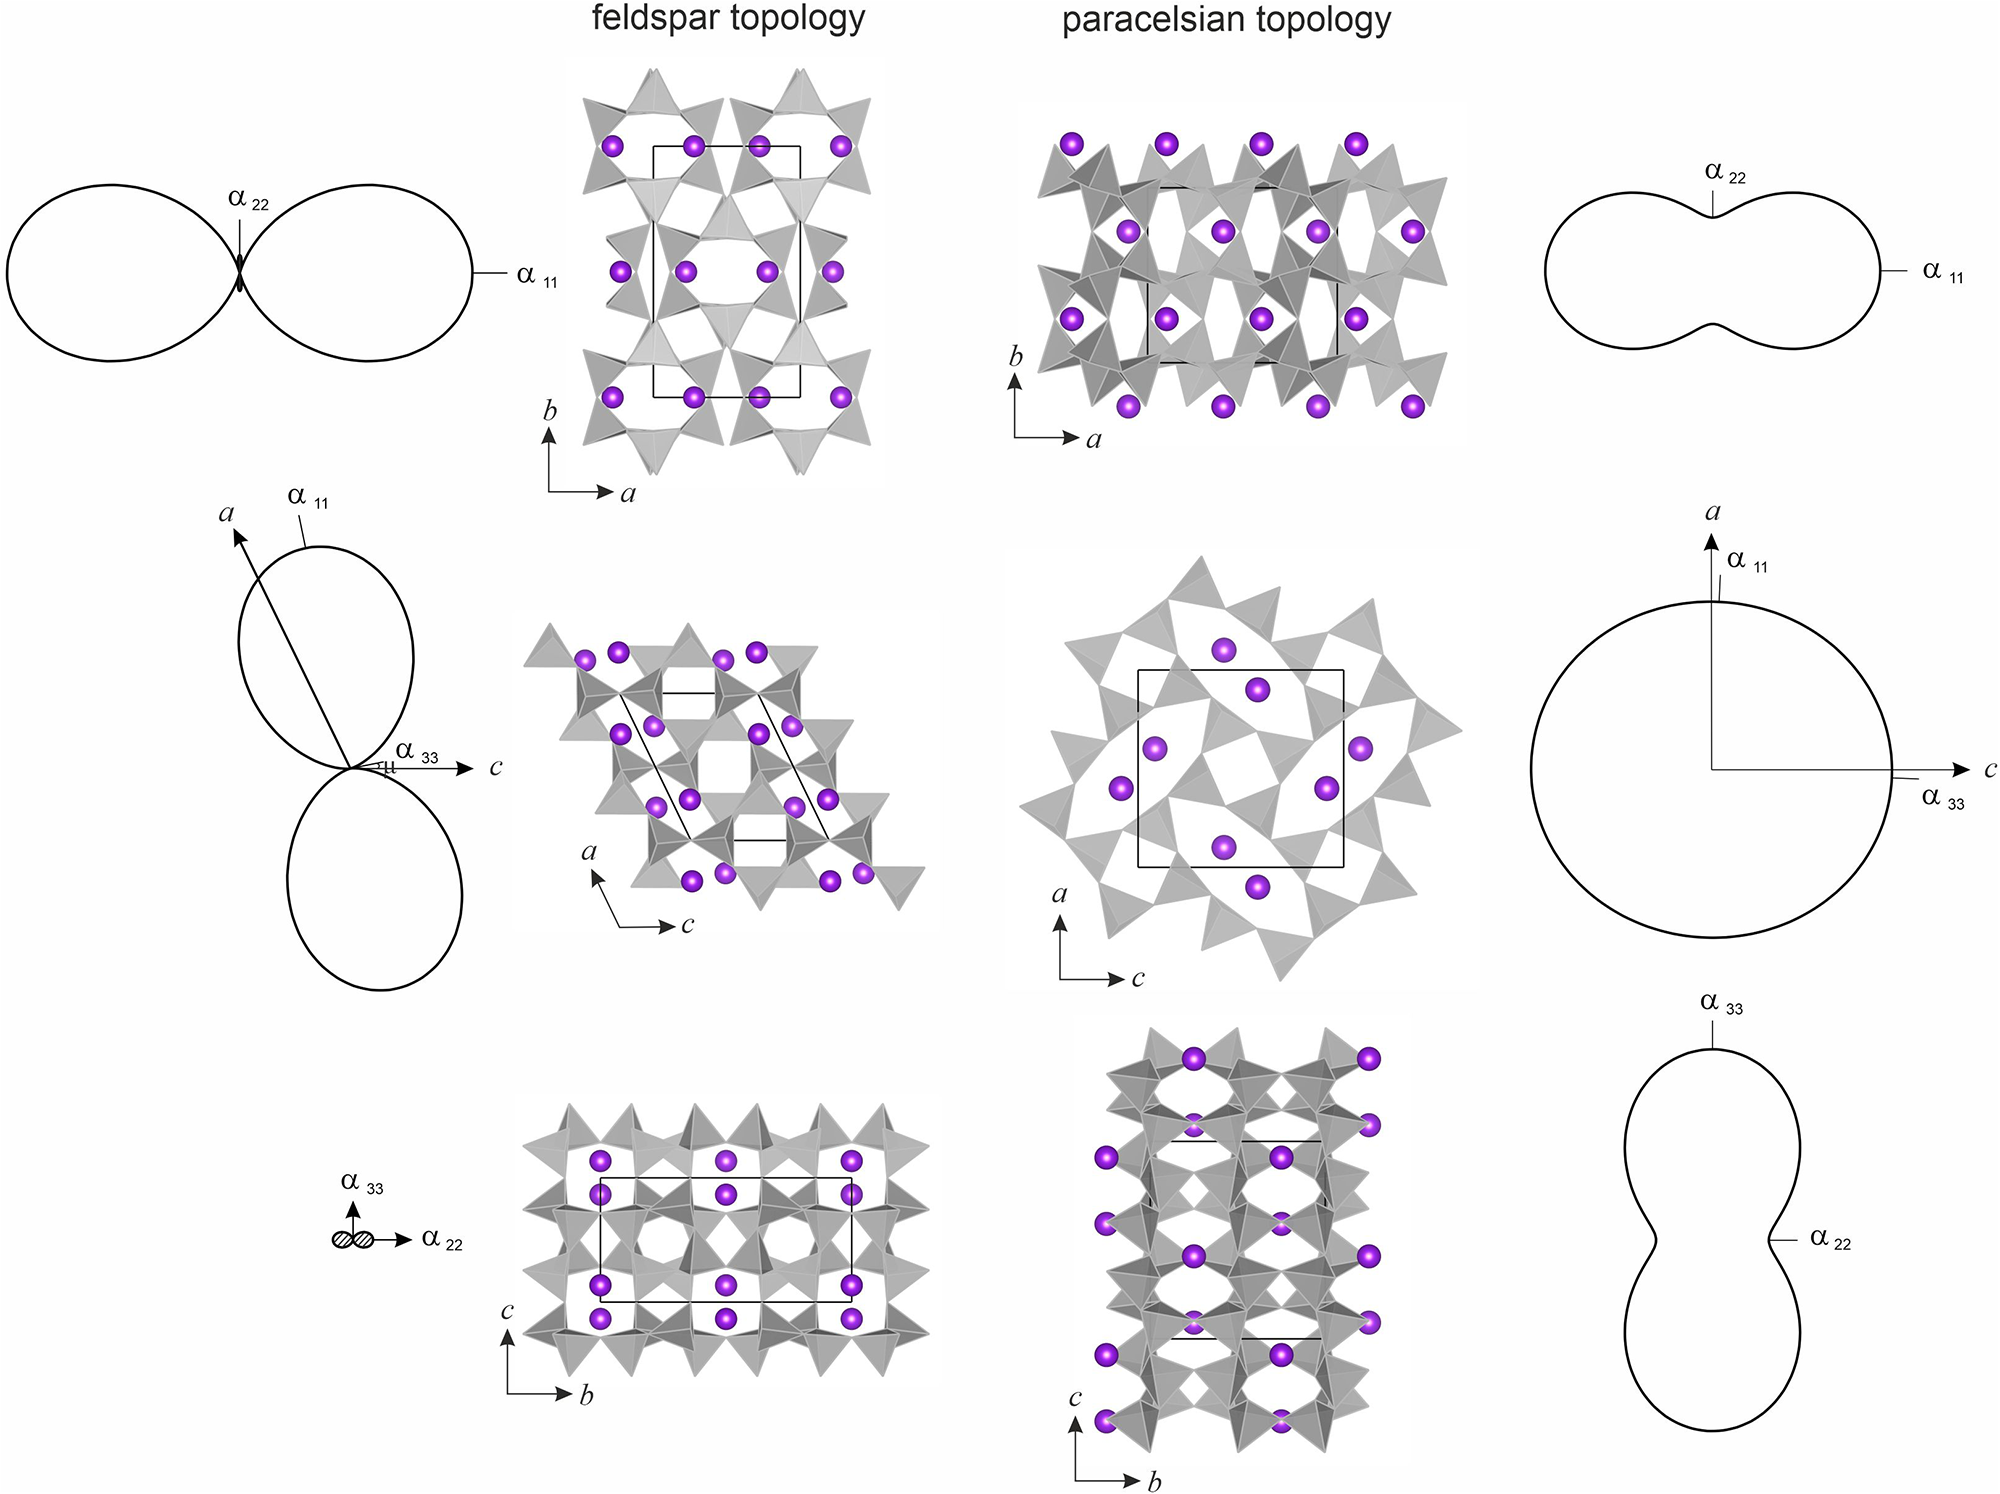
The temperature dependences for the unit-cell parameters of feldspar- and paracelsian-like modifications generally show the similarity of the thermal expansion of phases with similar topology (Fig. 2). The thermal expansion of pcl-like phases is quite anisotropic: αmax/αmin ≈ 3.2 and 2.5 under ambient conditions for KGaGe3O8 and KAlGe3O8, respectively. With increasing temperature the anisotropy degree also increases, most probably associated with the ‘preparation’ of the structure for the polymorphic transformation from pcl to fsp topology. The expansion of phases with fsp topology is even more anisotropic up to negative along the b direction and close to zero approximately along the c axis (Table 3, Figs 2 and 3). The volume thermal expansion of phases with pcl topology is similar (αV ≈ 31 ± 2 ×10⁻⁶ °C–1), but the expansion of KAlGe3O8 is slightly higher. The volume thermal expansion of phases with fsp topologies is practically identical (αV ≈ 20 ± 1 ×10⁻⁶ °C–1), but noticeably lower compared to the pcl-like phases. It should be also noted that among the different phases with fsp topology the volume thermal expansion is slightly higher for KGaGe3O8.
Unit-cell parameters of KGaGe3O8 (white symbols) and KAlGe3O8 (grey symbols) with paracelsian (a) and feldspar (b) topologies at different temperatures. Errors are smaller than symbols.

Figure 2 Long description
Five stacked plots with the vertical label, Lattice parameters and the horizontal label, Temperature, degree celsius. The temperature axis shows 0, 400 and 800. Plot 1 label, V, A superscript 3, with vertical ticks at 800, 820 and 840. Two point series rise with temperature from about 815 to about 845. Plot 2 label, beta, degree, with vertical ticks at 89.99 and 90.09. Two point series are nearly horizontal across the temperature range, one near 90.09 and one near 89.99. Plot 3 label, b, A, with vertical ticks at 9.6 and 9.9. Two point series rise slightly with temperature from about 9.8 to about 9.9. Plot 4 label, a, A, with vertical ticks at 9.4, 9.5 and 9.6. Two point series rise with temperature from about 9.45 to about 9.62. Plot 5 label, c, A, with vertical ticks at 8.7 and 8.8. Two point series rise with temperature from about 8.70 to about 8.86. The image B showing five stacked plots with the vertical label, Lattice parameters and the horizontal label, Temperature, degree celsius. The temperature axis shows 0, 400 and 800. Plot 1 label, V, A superscript 3, with vertical ticks at 800, 820 and 840. Two point series rise with temperature, one from about 815 to about 835 and one from about 800 to about 820. Plot 2 label, beta, degree, with vertical ticks at 115.5 and 116.0. Two point series slope downward slightly with temperature from about 116.0 to about 115.8. Plot 3 label, b, A, with vertical ticks at 13.5 and 13.6. Two point series slope downward with temperature from about 13.62 to about 13.56 and from about 13.55 to about 13.52. Plot 4 label, a, A, with vertical ticks at 8.8 and 9.0. Two point series rise with temperature from about 8.82 to about 9.05. Plot 5 label, c, A, with vertical ticks at 7.4 and 7.5. Two point series are nearly horizontal across the temperature range, one near 7.50 and one near 7.45.
Crystal structures of KMeGe3O8 (Me = Ga, Al) compounds with paracelsian and feldspar topology in different projections with averaged thermal expansion section (dashed parts of the sections demonstrate the negative thermal expansion). TO4 (T = Ga, Ge, Al) tetrahedra are given in grey, K atoms are shown as purple spheres. The crystal structure and sections of thermal expansion coefficients are provided for KGaGe3O8 only, as on the scale of the figure the difference between KGaGe3O8 and KAlGe3O8 is not visible.

Figure 3 Long description
The diagram consists of multiple sub-images comparing crystal structures of KGeO compounds with feldspar and paracelsian topology. On the left, the feldspar topology is depicted in three different projections. Each projection shows grey tetrahedra representing O (equals Ga, Ge, Al) and purple spheres representing K atoms. The first projection includes axes labeled a, b and c, with a thermal expansion section on the right showing a loop labeled with alpha subscript max and alpha subscript min. The second projection also includes axes a, b and c, with a similar thermal expansion section on the right. The third projection shows axes a and b, with a corresponding thermal expansion section. On the right, the paracelsian topology is similarly depicted in three projections. Each projection includes grey tetrahedra and purple spheres, with axes labeled a, b and c. The thermal expansion sections on the right are shown as loops or circles, labeled with alpha subscript max, alpha subscript min and alpha subscript zero. The arrangement highlights the structural differences and thermal expansion characteristics between the two topologies.
Thermal expansion coefficients (TECs) (×106 °C–1) of KTGe3O8 (T = Al, Ga) with feldspar and paracelsian topologies and its silicate analogues along the principle axes of the thermal expansion tensor and along the crystallographic axes

Table 3 Long description
Thermal expansion coefficients are listed for multiple compounds, grouped by feldspar and paracelsian topology, with models, temperature ranges, tensor principal axes alpha 11, alpha 22, alpha 33, and crystallographic axes alpha a, alpha b, alpha c, plus alpha beta and volume expansion alpha V. For feldspar KGaGe3O8 in space group C2 slash m, linear fits give alpha V 23.1 for 30 to 600 degrees C and 24.0 for 30 to 1000 degrees C, while polynomial points give alpha V 21.4 at 30 degrees C, 24.1 at 600 degrees C, and 25.9 at 990 degrees C. For feldspar KAlGe3O8 in C2 slash m, linear fits give alpha V 21.9 for 30 to 600 degrees C and 23.4 for 30 to 1000 degrees C, and polynomial points give alpha V 19.8 at 30 degrees C, 23.40 at 600 degrees C, and 26.4 at 1080 degrees C. Feldspar silicate analogues list alpha V 17.2 for KAlSi3O8 over 20 to 1000 degrees C, 28 for KBSi3O8 over 30 to 600 degrees C, and 16 for K Al Zn 2 As Si 2 O 8 over 30 to 600 degrees C. For paracelsian KGaGe3O8 in P21 slash a, linear fits give alpha V 34.4 for 30 to 600 degrees C and 36.7 for 30 to 1000 degrees C, and polynomial points give alpha V 29.7 at 30 degrees C, 38.2 at 600 degrees C, and 43.1 at 930 degrees C. For paracelsian KAlGe3O8 in Pnma, alpha a, alpha b, and alpha c are stated to match alpha 11, alpha 22, and alpha 33, and alpha V values are 37.8 for 30 to 600 degrees C, 40.1 for 30 to 1000 degrees C, 33.4 at 30 degrees C, 41.2 at 600 degrees C, and 45.6 at 930 degrees C. Several Fei and Kroll rows list alpha V at 30 degrees C or 30 degrees C with an asterisk, and some columns such as mu alpha 33 c and the crystallographic axis values are marked as no data available in those rows.
n/d – no data available; ΔT is a temperature range for linear approximation; Tc, is a calculation temperature
Discussion
Crystallization process of KMeGe3O8 (Me = Al, Ga) compounds
As mentioned above, in this work, pcl-KGaGe3O8 has been obtained by long annealing of fsp-KGaGe3O8 at 860°C, whereas feldspar-like modification itself has been synthesized at higher temperature (1000–1050°C). This synthesis route has been already described by Qin et al (Reference Qin, Kržmanc and Suvorov2008, Reference Qin, Kržmanc, Meden and Suvorov2009), who obtained pcl-KGaGe3O8 using a solid-state synthesis method by prolonged (∼100 h) recrystallization of a phase with fsp topology at 840–860°C, whereas a phase with fsp topology itself has been obtained at 950–1020°C. In addition, pcl-KGaGe3O8 was synthesized using a hydrothermal method at 450°C and 350 bar (Klaska and Jarchow, Reference Klaska and Jarchow1977). Fsp-KGaGe3O8 has been obtained by a glass crystallization method at 950–985°C with a small admixture of another phase (Goldsmith, Reference Goldsmith1950). It has been also demonstrated that increasing temperature up to 1000–1050°C leads to the formation of pure fsp-KGaGe3O8 (Goldsmith, Reference Goldsmith1950). Subsequently, this compound was also synthesized at 600°C (Kroll et al., Reference Kroll, Floegel, Breit, Loens and Pentinghaus1991).
Pcl-KAlGe3O8 was previously synthesized using the hydrothermal method (Liu et al., Reference Liu, Chen, Weng, Tu and Zhao2003). Our data demonstrate similar formation conditions, whereas the solid-state synthesis method was not successful for pcl-KAlGe3O8. Fsp-KAlGe3O8 has been obtained at 1111°C with a tiny admixture of glass, whereas increasing the heat-treatment temperature to 1115 and 1119°C resulted in an increase in the fraction of glass in the sample (Goldsmith, Reference Goldsmith1950). Our attempts to synthesize fsp-KAlGe3O8 by a similar pathway demonstrates the presence of different crystalline admixtures (Table 1) at all heat treatment temperatures, including 1030°C.
According to the published data KAlGe3O8 and KGaGe3O8 crystallize with a disordered element distribution at the T sites (T = Al, Ga, Ge) regardless of crystal structure topology (Klaska and Jarchow, Reference Klaska and Jarchow1977; Kroll et al., Reference Kroll, Floegel, Breit, Loens and Pentinghaus1991; Liu et al., Reference Liu, Chen, Weng, Tu and Zhao2003; Qin et al., Reference Qin, Kržmanc, Meden and Suvorov2009). The same is applied to other alkaline pcl-like structures RbAlGe3O8 and KBSi3O8 and their fsp-like modifications (Kimata and Sasaki, Reference Kimata and Sasaki1990; Kimata, Reference Kimata1993; Tripathi and Parise, Reference Tripathi and Parise2002; Krzhizhanovskaya et al., Reference Krzhizhanovskaya, Bubnova, Depmeier, Rahmoun, Filatov and Ugolkov2012; Gorelova et al., Reference Gorelova, Krzhizhanovskaya, Yukhno, Shorets and Vereshchagin2025). The minerals with fsp topologies crystallize both in ordered and disordered state, depending on the crystallization temperature: ‘high-temperature’ feldspars tend to have disordered Al and Si cation distribution over the tetrahedral sites, while ‘low-temperature’ forms have ordered cation distribution (e.g. Deer et al., Reference Deer, Howie and Zussman2013).
The formation conditions and stability range of phases correlate with their polymorphic modification: the compounds, which can crystallize both in pcl and fsp topology, crystallize in pcl-like metastable modification first, whereas fsp-like modification can be obtained by heating of pcl-like phases and is stable (e.g. Lin and Foster, Reference Lin and Foster1968). The high-temperature behaviour of KAlGe3O8 and KGaGe3O8 is a further confirmation of this trend.
Thermal induced paracelsian-to-feldspar transformation
In general, feldspar-related compounds with alkaline extra-framework cations more often crystallize in fsp topology compared to pcl topology. For example, to date there are no data on natural feldspars with alkaline extra-framework cation with pcl topology (Krivovichev, Reference Krivovichev2020). As far as we know, among synthetic compounds, only four phases with pcl topology are known, namely KBSi3O8, KGaGe3O8, KAlGe3O8 and RbAlGe3O8 (e.g. Dordević, Reference Dordević2011; Gorelova et al., Reference Gorelova, Krzhizhanovskaya, Yukhno, Shorets and Vereshchagin2025). All of them are known in both (fsp and pcl) modifications (Klaska and Jarchow, Reference Klaska and Jarchow1977; Kimata and Sasaki, Reference Kimata and Sasaki1990; Kroll et al., Reference Kroll, Floegel, Breit, Loens and Pentinghaus1991; Kimata, Reference Kimata1993; Tripathi and Parise, Reference Tripathi and Parise2002; Liu et al., Reference Liu, Chen, Weng, Tu and Zhao2003; Qin et al., Reference Qin, Kržmanc, Meden and Suvorov2009; Krzhizhanovskaya et al., Reference Krzhizhanovskaya, Bubnova, Depmeier, Rahmoun, Filatov and Ugolkov2012; Gorelova et al., Reference Gorelova, Krzhizhanovskaya, Yukhno, Shorets and Vereshchagin2025), but there are no data on transformation process of modifications with pcl into fsp topology. To date, available data concern only the decomposition of fsp-KBSi3O8 and fsp-RbAlGe3O8 into of leucite/pollucite-like phases upon heating (Krzhizhanovskaya et al., Reference Krzhizhanovskaya, Bubnova, Depmeier, Rahmoun, Filatov and Ugolkov2012; Gorelova et al., Reference Gorelova, Krzhizhanovskaya, Yukhno, Shorets and Vereshchagin2025). This behaviour is typical for alkaline feldspars with fsp topology (e.g. Henderson et al., Reference Henderson, Bell and Knight2017). Moreover, it is known that orthorhombic (i.e. pcl-like) modification of KBSi3O8 melts incongruently forming quartz (Kimata, Reference Kimata1993).
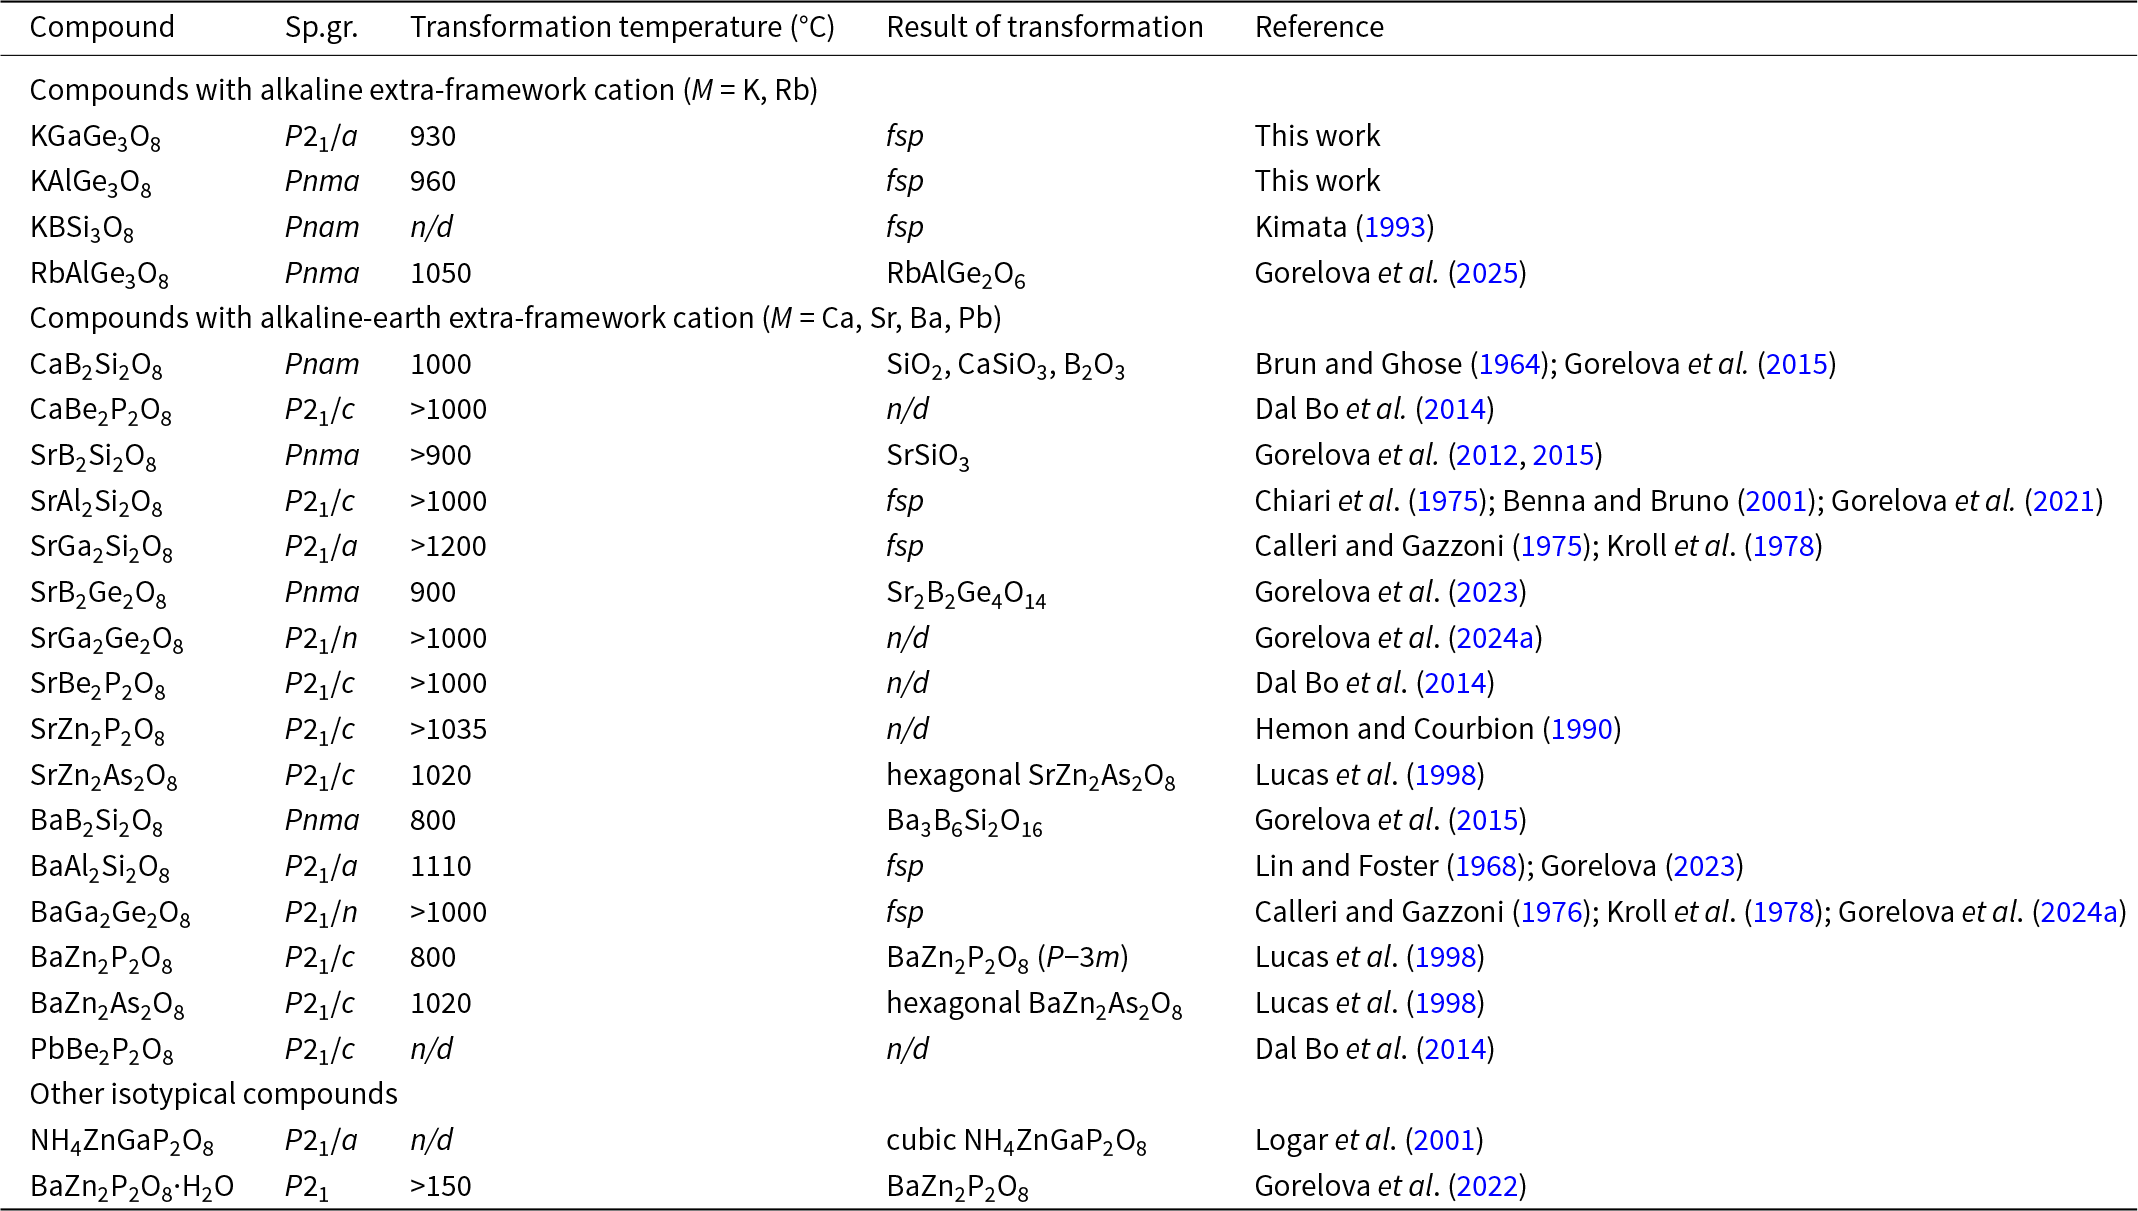
The polymorphic transformation of crystal structures with pcl topology into phases with fsp topology is more typical for feldspar compounds with alkaline-earth extra-framework cations, but it strongly depends on the chemical composition of both extra-framework and framework-forming cations. The data on high-temperature transformation of pcl-like phases available to date are summarized in Table 4. The most obvious example is the transformation of paracelsian, BaAl2Si2O8, into celsian (phase with feldspar topology), which starts above 930°C and ends at ∼1110°C (Lin and Foster, Reference Lin and Foster1968; Gorelova, Reference Gorelova2023). The paracelsian Sr-analogue, slawsonite, does not undergo any phase transformation up to 1000°C (Gorelova et al., Reference Gorelova, Vereshchagin and Kasatkin2021), but there are reasons to believe that it will transform into feldspar modification at higher temperatures, as such a structure is known (Chiari et al., Reference Chiari, Calleri, Bruno and Ribbe1975; Benna and Bruno, Reference Benna and Bruno2001; Benna et al., Reference Benna, Tribaudino and Bruno1995). The study of MGa2Ge2O8 (M = Sr, Ba) with pcl topology up to 1000°C shows the absence of any phase transformations as well (Gorelova et al., Reference Gorelova, Yukhno, Krzhizhanovskaya and Vereshchagin2024a). There are grounds to believe the similar transformation at higher temperatures for BaGa2Ge2O8, as its crystal structure with fsp topology is known (Calleri and Gazzoni, Reference Calleri and Gazzoni1976; Kroll et al., Reference Kroll, Phillips and Pentinghaus1978), whereas for SrGa2Ge2O8 there are no data on crystal structure with fsp topology.
Thermal stability of natural and synthetic compounds MT 4O8 with pcl topology

Table 4 Long description
Columns list compound, Sp.gr., transformation temperature in degrees C, result of transformation, and reference, grouped by alkaline, alkaline earth, and other isotypical compounds. For alkaline extra framework cations, KGaGe3O8 at 930 degrees C and KAlGe3O8 at 960 degrees C transform to, fsp, while KBSi3O8 has no data for temperature and transforms to, fsp; RbAlGe3O8 transforms at 1050 degrees C to RbAlGe2O6. For alkaline earth extra framework cations, CaB2Si2O8 transforms at 1000 degrees C to SiO2, CaSiO3, and B2O3, and CaBe2P2O8 transforms above 1000 degrees C with no data for result. SrB2Si2O8 transforms above 900 degrees C to SrSiO3; SrAl2Si2O8 transforms above 1000 degrees C to, fsp; SrGa2Si2O8 transforms above 1200 degrees C to, fsp; SrB2Ge2O8 transforms at 900 degrees C to Sr2B2Ge4O14. SrGa2Ge2O8, SrBe2P2O8, and SrZn2P2O8 list temperatures above 1000 degrees C or above 1035 degrees C with no data for result, while SrZn2As2O8 transforms at 1020 degrees C to hexagonal SrZn2As2O8. BaB2Si2O8 transforms at 800 degrees C to Ba3B6Si2O16; BaAl2Si2O8 transforms at 1110 degrees C to, fsp; BaGa2Ge2O8 transforms above 1000 degrees C to, fsp; BaZn2P2O8 transforms at 800 degrees C to BaZn2P2O8 with Sp.gr. noted as P minus 3m; BaZn2As2O8 transforms at 1020 degrees C to hexagonal BaZn2As2O8; PbBe2P2O8 has no data for temperature or result. Under other isotypical compounds, NH4ZnGaP2O8 has no data for temperature and transforms to cubic NH4ZnGaP2O8, and BaZn2P2O8 dot H2O transforms above 150 degrees C to BaZn2P2O8.
n/d – no data available
A completely different situation is observed for alkaline-earth borosilicate compounds with pcl topology (MB2Si2O8, M = Ca, Sr, Ba), which do not undergo polymorphic transformation, but decompose with the formation of various phases above 800–1000°C, depending on chemical composition (Brun and Ghose, Reference Brun and Ghose1964; Gorelova et al., Reference Gorelova, Krzhizhanovskaya and Bubnova2012, Reference Gorelova, Filatov, Krzhizhanovskaya and Bubnova2015; Gorelova, Reference Gorelova2023). Similar behaviour is demonstrated by another boron-containing compound, SrB2Ge2O8, which also decomposes above 900°C (Gorelova et al., Reference Gorelova, Khandarkhaeva, Yukhno, Krzhizhanovskaya, Vereshchagin and Dubrovinsky2023).
Thermal expansion of compounds with paracelsian topology
As far as we know, to date the thermal expansion of compounds with pcl topology has been studied for 9 out of 22 known compositions (Sugiyama and Takéuchi, Reference Sugiyama and Takéuchi1985; Gorelova et al., Reference Gorelova, Krzhizhanovskaya and Bubnova2012, Reference Gorelova, Filatov, Krzhizhanovskaya and Bubnova2015, Reference Gorelova, Vereshchagin and Kasatkin2021, Reference Gorelova, Vereshchagin, Bocharov, Pankin and Đorđević2022, Reference Gorelova, Vereshchagin, Bocharov, Potekhina (née Shchipalkina), Zhitova and Pekov2024b; Gorelova, Reference Gorelova2023). The data for 5 of 7 natural pcl-like phases are summarized in Gorelova (Reference Gorelova2023). All studied minerals, namely paracelsian and slawsonite (MAl2Si2O8, M = Ba, Sr, respectively), danburite, pekovite and maleevite (MB2Si2O8, M = Ca, Sr, Ba respectively) are stable at least up to 800°C and have similar volume thermal expansion (αV = 23 × 10–6 °C–1), although the degree of anisotropy is different. The synthetic compounds [MGa2Ge2O8, M = Sr, Ba (Gorelova et al., Reference Gorelova, Yukhno, Krzhizhanovskaya and Vereshchagin2024a); SrGe2B2O8 (Gorelova et al., Reference Gorelova, Khandarkhaeva, Yukhno, Krzhizhanovskaya, Vereshchagin and Dubrovinsky2023); BaZn2As2O8·H2O (Gorelova et al., Reference Gorelova, Vereshchagin, Bocharov, Pankin and Đorđević2022)] show a similar tendency with the volume thermal expansion of ∼21 × 10–6 °C–1. The thermal stability range is also close: the anhydrous compounds are stable at least up to 900°C, whereas BaZn2As2O8·H2O loses the H2O groups at ∼300°C, but it retains the pcl topology up to at least 525°C.
Though the thermal stability range (>900°C) of pcl-KGaGe3O8 and pcl-KAlGe3O8, studied here, is similar to all other isotypical compounds, their volume thermal expansion is noticeably higher: αV > 30 × 10–6 °C–1 (Supplementary Fig. S1a), regardless of approximation method. This difference is apparently related to the size and charge of the extra-framework cation. All the pcl-like phases studied before, had divalent alkaline earth atoms (RCa2+ = 1.06, RSr2+ = 1.21, RBa2+ = 1.38 Å; Shannon, Reference Shannon1976) as the extra-framework cation, whereas K is a monovalent alkaline cation (RK+ = 1.46 Å; Shannon, Reference Shannon1976). This is also in agreement with a tendency of the volume expansion to increase upon the decrease of the residual charge of the anionic group (Bubnova et al., Reference Bubnova, Krzhizhanovskaya and Filatov2025).
The anisotropy degree of thermal expansion of compounds with pcl topology can vary greatly (Fig. S1b). Generally the anisotropy degree decreases with increasing extra-framework cation size. Only BaAl2Si2O8 and BaZn2As2O8·H2O deviate from this trend, as they demonstrate the highest degree of anisotropy [αmax/αmin = 12 and 9.4, respectively (Gorelova et al., Reference Gorelova, Vereshchagin, Bocharov, Pankin and Đorđević2022; Gorelova, Reference Gorelova2023)], that most probably is associated with their further phase transformations. As was mentioned above, BaAl2Si2O8 undergoes polymorphic transformation with the formation of crystal structure with fsp topology (Lin and Foster, Reference Lin and Foster1968; Gorelova, Reference Gorelova2023), and BaZn2As2O8·H2O transforms into BaZn2As2O8 with pcl topology (Gorelova et al., Reference Gorelova, Vereshchagin, Bocharov, Pankin and Đorđević2022), whereas all other alkaline-earth compounds undergo amorphization or decomposition.
The mechanism of the thermal expansion of pcl-like minerals and synthetic compounds is similar and is discussed in detail in a number of works (e.g. Gorelova et al., Reference Gorelova, Filatov, Krzhizhanovskaya and Bubnova2015, Reference Gorelova, Vereshchagin and Kasatkin2021, Reference Gorelova, Khandarkhaeva, Yukhno, Krzhizhanovskaya, Vereshchagin and Dubrovinsky2023, Reference Gorelova, Yukhno, Krzhizhanovskaya and Vereshchagin2024a; Gorelova, Reference Gorelova2023). The K-dominant pcl-like compounds demonstrate similar patterns. The main mechanism of their thermal deformations is the hinge deformations (Sleight, Reference Sleight1995) of the four-membered rings of TO4 tetrahedra.
Thermal expansion of compounds with feldspar topology
A large number of studies, including general ones, have been devoted to the thermal expansion of feldspar compounds with feldspar topology (e.g. Kroll, Reference Kroll and Brown1984; Hovis et al., Reference Hovis, Morabito, Spooner, Mott, Person, Henderson, Roux and Harlow2008, Reference Hovis, Medford, Conlon, Tether and Romamanoski2010; Tribaudino et al., Reference Tribaudino, Angel, Camara, Nestola, Pasqual and Margiolaki2010, Reference Tribaudino, Bruno, Nestola, Pasqual and Angel2011; Henderson, Reference Henderson2021; Bubnova et al., Reference Bubnova, Krzhizhanovskaya and Filatov2025). However, most of the studies have been conducted on feldspars with alkaline extra-framework cations (Na and K) and plagioclases, because such feldspars are the most common in nature. Thanks to this, many regularities inherent in feldspars, including containing potassium, have been described. Among them the following main ones can be distinguished: (1) polymorphic transformation upon heating from an ordered to disordered state (e.g. Henderson, Reference Henderson1979; Deer et al., Reference Deer, Howie and Zussman2013), which can be obtained by ex situ heating or by displacive deformation caused by in situ heating; (2) the ordering state has practically no influence on the thermal expansion coefficients (Hovis et al., Reference Hovis, Morabito, Spooner, Mott, Person, Henderson, Roux and Harlow2008); (3) the maximal thermal expansion occurs close to the a axis, i.e. along crankshaft chain of tetrahedra (Megaw, Reference Megaw, MacKenzie and Zussman1974), whereas the expansion along b and c axes is usually close to zero or even negative (Brown et al., Reference Brown, Openshaw, McMillan and Henderson1984); (4) the volume thermal expansion (varies from 9 to 33 × 10–6 °C–1) depending on the chemical composition (primarily on the extra-framework alkali cation) (Hovis et al., Reference Hovis, Medford, Conlon, Tether and Romamanoski2010; Henderson, Reference Henderson2021 and refs. therein); and (5) the mean volume thermal expansion of feldspars with alkali cations and an aluminosilicate framework can be predicted based on structure type and cell volume under ambient conditions (Hovis et al., Reference Hovis, Morabito, Spooner, Mott, Person, Henderson, Roux and Harlow2008, Reference Hovis, Medford, Conlon, Tether and Romamanoski2010).
The mechanism of thermal expansion of compounds with fsp-topology is the main topic of the large number of studies (e.g. Hovis et al., Reference Hovis, Morabito, Spooner, Mott, Person, Henderson, Roux and Harlow2008, Reference Hovis, Medford, Conlon, Tether and Romamanoski2010; Gorelova et al., Reference Gorelova, Vereshchagin, Bocharov, Potekhina (née Shchipalkina), Zhitova and Pekov2024b). The main mechanism of thermal expansion of the compounds with fsp-topology is shear deformations caused by the significant increase of the M–O bond lengths (Filatov, Reference Filatov1990).
New data, obtained for KGaGe3O8 and KAlGe3O8, are generally in agreement with the aforementioned experimental findings (Table 3). Nevertheless, it is noteworthy to note that volume thermal expansion of five known K-containing compounds with feldspar topology varies from 16 to 24 × 10–6 °C–1, i.e. in a wide range. The minimal expansion is observed for compounds, containing tetrahedrally coordinated silicon and aluminium (KAlSi3O8 and K(Al,Zn)2(As,Si)2O8), whereas borosilicate demonstrates the maximal expansion. No obvious dependence of thermal expansion on the framework composition and unit cell volume is observed (Fig. 3), although a tendency of expansion decrease with volume increase can be presumed. In other words, the dependencies proposed by Hovis et al. (Reference Hovis, Morabito, Spooner, Mott, Person, Henderson, Roux and Harlow2008, Reference Hovis, Medford, Conlon, Tether and Romamanoski2010) for aluminosilicate feldspars or by Bubnova et al (Reference Bubnova, Krzhizhanovskaya and Filatov2025) for different fsp phases cannot be always easily used for isostructural compounds with a different framework composition.
Supplementary material
The supplementary material for this article can be found at https://doi.org/10.1180/mgm.2025.10167.
Acknowledgements
The authors are grateful to Mario Tribaudino and G. Diego Gatta for a careful examination of the manuscript contents and positive feedback. The authors express their gratitude to Principal Editor Stuart Mills for editorial handing of this contribution. The authors thank X-ray Diffraction Centre and Geomodel Centre of Saint Petersburg State University for providing instrumental and computational resources. This research was funded by the Russian Science Foundation, grant number 22-77-10033-П (to L.A.G., V.A.Y. and O.S.V.).
Competing interests
The authors declare none.