INTRODUCTION
It has been widely reported that abiotic factors such as circulation (Rodriguez et al., Reference Rodriguez, Barton, Eve and Hernández-León2001), density fronts, fresh water discharges, depth of the seasonal thermocline and mesoscale activity can act as mechanisms to enhance or reduce survival in fish early life history strategies (FELHS) and recruitment processes (Sánchez & Gil, Reference Sanchez and Gil2000; John et al., Reference John, Mohrholz and Lutjehrms2001; Rodriguez et al., Reference Rodriguez, Barton, Eve and Hernández-León2001; Gonzalez-Quirós et al., Reference Gonzalez-Quirós, Cabal, Álvarez-Marqués and Isla2003, Reference Gonzalez-Quirós, Pascual, Gomis and Anadón2004; Le Pape et al., Reference Le Pape, Désaunay and Guérault2003; Espinosa-Fuentes & Flores-Coto, Reference Espinosa-Fuentes and Flores-Coto2004).
Upwelling processes have a great influence on the transport and survival of early fish life history stages. The offshore displacement of surface waters, due to Ekman offshore transport, is the reason why concentrations of eggs and larvae are found in filaments displaced from the continental shelf (Rodriguez et al., Reference Rodriguez, Hernandez-Leon and Barton1999, Reference Rodriguez, Barton, Hernandez-Leon and Aristegui2004; Santos et al., Reference Santos, Peliz, Dubert, Oliveira, Angélico and Ré2004) and the horizontal distribution of planktonic components appears to be strongly related to mesoscale oceanographic structures (Gil et al., Reference Gil, Valdés, Moral, Sánchez and Garcia-Soto2002).
The Bay of Biscay is an important area for many commercial fisheries (Ibaibarriaga et al., Reference Ibaibarriaga, Irigoien, Santos, Motos, Fives, Franco, Lgo de Lanzós, Acevedo, Bernal, Bez, Eltink, Farinha, Hammer, Iversen, Milligan and Reid2007), with many of the stocks depleted or collapsed (e.g. hake and anchovy). Recruitment is a key process for the fish population and it is well established that physical conditions and transport play a key role on recruitment. As an example several physics related hypotheses have been proposed for the collapse of anchovy recruitment in recent years, but those are based either on non validated circulation models (Allain et al., Reference Allain, Petitgas and Lazure2001) or fragmentary, large scale descriptions of the main circulation patterns (Irigoien et al., Reference Irigoien, Fiksen, Cotano, Uriarte, Avarez, Arrizabalaga, Boyra, Santos, Sagarminaga, Otheguy, Etxebeste, Zarauz, Artetxe and Motos2007).
The large scale physical spatial dimension and the large scale temporal changes (seasonality scale) in the ocean do not explain the biological processes that occur in limited coastal areas, which are greatly influenced by local phenomena. One of the most important problems that a research scientist finds when he tries to study the mesoscale pattern on the continental shelf and the slopes is the scarcity of information that exists for these areas, which meets the conditions of synopticity and the possibility to separate the phenomena with mesoscale dimensions. This is the case in the Bay of Biscay, especially in the southern area, where partial description of the circulation has been provided, and there is detailed information on eddies (Pingree & Le Cann, Reference Pingree and Le Cann1992; Fernández et al., Reference Fernández, Alvarez-Marques, Anadón, Barquero, Bode, García, Garcia-Soto, Gil, González, Iriarte, Mouriño, Rodríguez, Sánchez, Teira, Torres, Valdés, Varela, Varela and Zapata2004; Sánchez & Gil, Reference Sánchez and Gil2004), but a coherent description of the circulation at different scales is still lacking.
It is therefore indispensable, when undertaking these studies, to have very precise knowledge of the physical framework, especially the mesoscale, of the environment where such processes take place. Therefore, the main objectives of this paper were to describe the physical oceanography (macro and meso) in one cohesive description. A recent paper by (Bakun, Reference Bakun2006) concluded that investigations on physical–biological links on a macroscale must be shift to investigations on a meso (and smaller) scale.
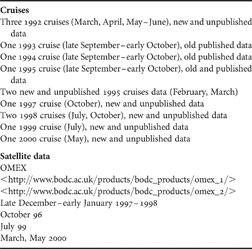
The physical database that we used in this study meets the conditions for resolving most of the mesoscale phenomena on the Cantabrian and French shelf and slopes. The data mostly represents new information that has never been published before (see Table 1) and, therefore, does not deal with a review of old data.
Cruises carried out in the Bay of Biscay and satellite data used.

MATERIALS AND METHODS
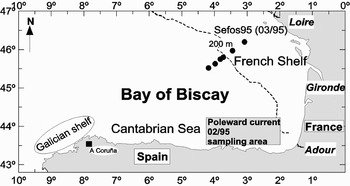
This study was based on three conductivity–temperature–depth (Seabird 25) databases. First, new and unpublished data from cruises carried out in the Bay of Biscay in different seasons of the year for the most important oceanographic phenomena that take place in the area of Galicia, the Cantabrian Sea and the French shelf. Second, a small amount of existing data that was necessary to complete the data study (1993–1994–1995 late September–early October cruises). The study areas and cruises are shown in Figure 1 and Table 1. Additional information from satellite data was also used for some seasons from 1997 to 2000 (Table 1).
The study area and the Shelf Edge Fisheries and Oceanography Studies (SEFOS) transect.

To obtain the temperature, salinity and density fields, a 2-D univariate spatial analysis of station data, using the successive correction method proposed by Bratseth (Reference Bratseth1986), was used. The band-pass response of the filtering was centred at a wavelength of 35 km, and the short wavelength noise was filtered out. The mesoscale field was obtained by subtracting a macrofield (filtering was centred at a wavelength of 90 km). Then, the total field was made from the mesoscale and macroscale contribution. All the analyses presented in this study, except for the mesoscale analysis, are the total field noise filtered out.
Geostrophic computations were done on the 450 dbar reference level where the isopycnal and isobaric surfaces are almost parallel. Hence, by adopting this level, relevant information concerning the baroclinic field was not lost.
RESULTS
Physical oceanographic conditions in the southern Bay of Biscay
The winter Poleward Current
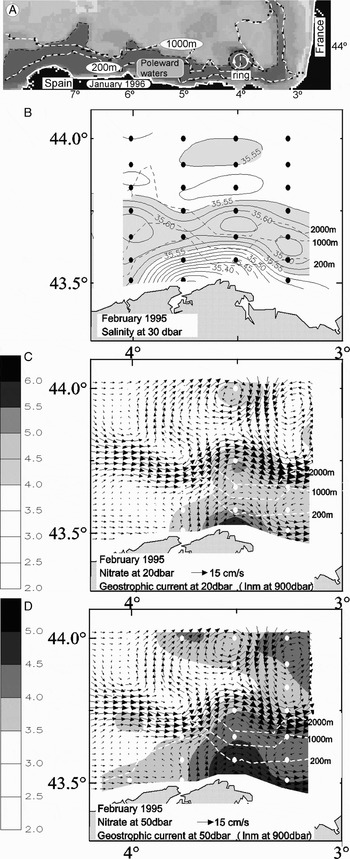
Meridional displacements of the Azores High govern the offshore meteorological conditions of the Iberian Peninsula. In winter, the weakening and southward migration of the Azores High leaves the western Iberian Peninsula under the influence of south-westerly winds and the upper layer circulation pattern is characterized by a poleward slope current (Haynes & Barton, Reference Haynes and Barton1990; Frouin et al., Reference Frouin, Fiúza, Ambar and Boyd1990; García-Soto et al., Reference García-Soto, Pingree and Valdés2002). Upon reaching the north-west corner of Spain, this Poleward Current (PC) turns eastward almost at right angles in order to preserve its potential vorticity (Frouin et al., Reference Frouin, Fiúza, Ambar and Boyd1990). Once it enters the Bay of Biscay it continues through the Cantabrian Sea and along the French slope. This current is characterized by the waters it transports, which are warmer and saltier than those surrounding it on its way northwards (Figure 2B). Satellite images show a conspicuous meandering pattern caused by baroclinic instabilities in the flow (Figure 2A). When these meanders break away from the current they become anticyclonic eddies with mesoscale dimension (40–60 km) (Figure 2C&D).
January 1996: (A) typical thermal infrared satellite AVHRR SST (°C) temperature image showing the warmer Iberian Poleward Current (darker tone). February 1995: (B) salinity at 30 m; (C) nitrate (μg l–1) and geostrophic current at 20 dbar; and (D) nitrate (μg l–1) and geostrophic current at 50 dbar.

The intensity of the current is variable and can be 45 cm s–1 in a year of greater intensity, as in the case of the PC in the winter of 1995–1996 (Gil, Reference Gil and Sánchez2003), although it more commonly has values close to 20–30 cm s–1. The current gradually weakens as a result of the easterly winds in spring and summer but in February–March it can still flow at up to 10–15 cm s–1 (Figure 2C&D).
The well mixing poleward waters carries a greater concentration of nutrients than in the surrounding waters but less than the fresh continental waters on the shelf (Figure 2B–D), and indeed greater than in the autumn, with very low concentrations of nutrients in the superficial layers, because of the photosynthetic bloom in spring–summer (Gil, Reference Gil2003). Also, the detached rings carry nutrients away from the slope into the deep oceanic areas (see Figure 2C&D).
The spring time
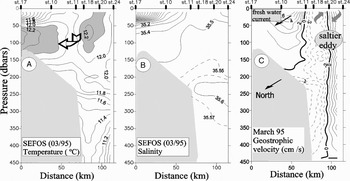
The spring thaw carries a large quantity of continental fresh water to the sea. The area of greatest discharge is located in the south-eastern most corner of the Bay of Biscay and is mainly due to the French rivers Villaine, Loire, Charente, Gironde and Adour, with a total contribution of around 2500 m3 s–1. Thus, the very cold waters from the thaw that flow into the sea are situated along the coast that occupies a narrow strip of the Cantabrian Sea and nearly all of the southern French continental shelf. A clear example that explains the processes that originate in the shelf and slope area is provided by the SEFOS (Shelf Edge Fisheries and Oceanography Studies) transect. This study was based on the information obtained by a cruise carried out in March 1995 (Alvarez et al., Reference Alvarez, Motos, Uriarte and Egaña2001) and the location is shown in Figure 1. The discharges of continental waters into the sea were very considerable at the beginning of spring in the area where the transect was located. Figure 3A&B, shows how the first 50 m of the continental shelf are occupied by very cold fresh waters, with a marked thermal inversion, since the water temperature at 100 dbar is 1°C higher than at the surface. These are low density waters due to their low salinity in relation to those found outside the continental shelf.
March 1995 Shelf Edge Fisheries and Oceanography Studies (SEFOS) transect: (A) potential temperature °C; (B) salinity; and (C) geostrophic velocity (cm s–1).

At the beginning of spring the PC does not exist as such. The flow towards the north is no longer continuous and there are rings of salty warm waters rotating anticyclonically over the slope and the shelf break. As the thaw takes place, an intense outflow of cold, fresh, light waters gradually floods the continental shelf. Almost instantaneously there is a geostrophic adjustment between the pressure gradient, due to the accumulation of low density waters and the Coriolis effect. The result is a northward flow along the shelf break of around 6–8 cm s–1. Then, an anticyclonic ring of salty waters from the PC appears in an offshore direction (Figure 3C).
Figure 3A&B, shows how the waters over the bottom of the outer continental shelf have the same temperature–salinity characteristics as those of the ring that originates in the PC. If we assume that the northward current of fresh waters appears and intensifies in spring, this means that the onshore edge of the ring transporting waters southwards will be slowed down by the fresh water current circulating towards the north. As a result, a process of increasing relative vorticity begins and since a system in geostrophic equilibrium needs a process of stretching and convergence of surface waters from the ring towards the bottom in order to maintain its potential vorticity, this leads to the disappearance of the ring. This may be a transfer mechanism of waters from the ring to the bottom of the continental shelf.
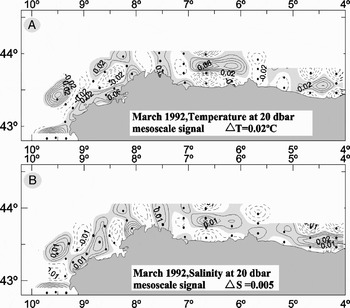
As a result, in the Cantabrian Sea, a mesoscale pattern, in which the remains of the PC, in the form of anticyclonic rings over the shelf break, provides the positive inputs of salinity and temperature, while the coastal waters of continental origin bring the negative inputs (Figure 4A&B).
March 1992: (A) temperature mesoscale signal at 20 dbar ΔT = 0.02°C; and (B) salinity mesoscale signal at 20 dbar ΔS = 0.05.

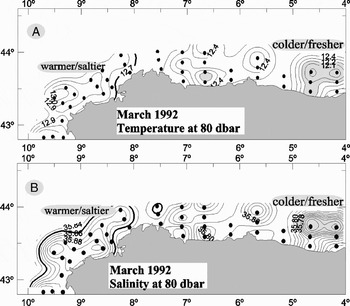
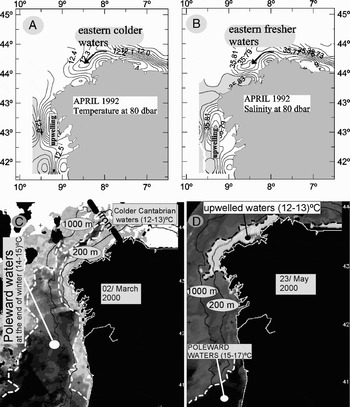
The withdrawal and extinction of the PC is of great relevance in Galician waters in spring. Figures 5 and 6, show how the poleward waters withdraw leaving in their place the colder and fresher waters of the Cantabrian Sea. The situation of the water masses from March to April 1992 (Figures 5&6A, B), indicates how the front between the warm salty western waters and the cold fresh eastern waters was situated over the border of Galician waters and how it was withdrawing slowly. Thus, the location and movement of this physical barrier are determined by the climatic conditions of the area. Figure 6C&D shows the withdrawal of PC waters and the start of coastal upwelling over the Galician continental shelf in the year 2000 as a consequence of winds with an easterly component.
March 1992 at 80 dbar: (A) temperature (°C); and (B) salinity.

April 1992 at 80 dbar: (A) temperature (°C); (B) salinity; (C) 2 March 2000: AVHRR SST (°C) temperature showing the poleward waters withdrawing; and (D) 23 May 2000: AVHRR SST (°C) temperature showing the start of coastal upwelling over the Galician continental shelf.

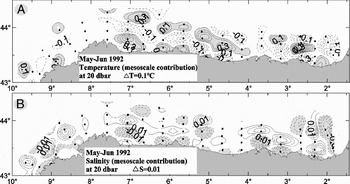
As the Azores High moves further north, the situation changes radically in relation to that of winter. Winds are more often of an easterly component and the PC stops. Moreover, winds of an easterly component favour coastal upwelling processes throughout the southern edge of the Bay of Biscay, with flows towards the west. In addition, fresh and warm mesoscale rings form which are made up of waters with a continental origin from the south-eastern most corner of the Bay Biscay (Gil et al., Reference Gil, Valdés, Moral, Sánchez and Garcia-Soto2002). As spring advances, these fresh and light coastal waters warm up more quickly than those of greater salinity, since they are isolated from the deeper waters by an intense pycnocline. The warm mesoscale inputs now correspond to low salinity inputs (Figure 7A&B). It can be observed how the mesoscale signal becomes stronger throughout the spring, with Figure 4 showing ΔT = 0.02°C, ΔS = 0.005 in March and Figure 7 showing ΔT = 0.1°C, ΔS = 0.01 in May–June. It is important to point out that, in all cases, salinity is a determinant in the field of density and that if low salinity waters accumulate over the continental shelf, then, even though they are cold, they are less dense than those on the edge of the continental shelf and the flow generated due to the later geostrophic adjustment is in an eastward direction.
May–June 1992: (A) temperature mesoscale signal at 20 dbar ΔT = 0.1°C; and (B) salinity mesoscale signal at 20 dbar ΔS = 0.01.

Therefore, whereas in winter there is a large macroscale phenomenon, the PC water masses and their dynamic pattern, which cover the shelf break and slopes around Portugal, the Cantabrian Sea and the French Atlantic continental shelf in spring, are mainly mesoscale with abundant small spatio-temporal structures and a great variability in the flows. At first, the flow is towards the east, as a result of the low salinity continental waters, and later, as a result of denser water upwelling onto the continental shelf, the geostrophic flow is towards the west.
The summer time
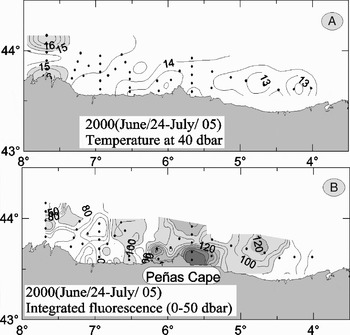
In the Cantabrian Sea, easterly winds represent the main driving mechanism that drags surface waters from the continental shelf in a net Ekman transport. This process triggers upwelling of sub-surface waters and a strong front with flows towards the west. However, superimposed on this macroscale view (i.e. the whole of the Cantabrian Sea area) is a large variety of physical phenomena acting on the mesoscale field. For example, at the beginning of summer, easterly winds still have neither the persistence nor sufficient intensity to create continuous upwelling along the coast. Consequently, if it is to develop, coastal upwelling requires another factor, such as the effect of the orography of the coast, the bathymetry of the bottom of the continental shelf or other factors related to the spatially varying wind stress. It is common to see how intense upwelling occurs around the capes due to the divergent Ekman effect (Figure 8). The effect of bathymetry (underwater canyons, shelf-slope break, the dimensions and orientation of the continental shelf) provides local characteristics that lead to different upwelling situations with mesoscale dimensions.
24 June and 5 July: (A) temperature (°C) at 40 dbar; and (B) integrated fluorescence (0–50 dbar).

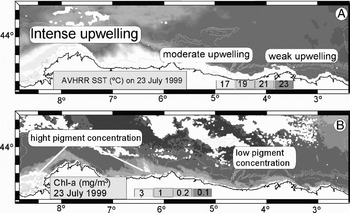
The position of the Azores High is the main reason why the winds in the summer are predominantly easterly, and so the areas to the west of the gulf (Galicia, western Cantabrian Sea), closer to the edge of the anticyclone, are more intensely influenced by the wind than the more eastern areas in the south-eastern most corner of the gulf. It is therefore common to see a decrease in upwelling from west to east along the coasts of Galicia and the Cantabrian Sea (Figure 9). At a given latitude, such as along the Cantabrian coast, transport in the Ekman layer is proportional to wind stress. Therefore, if the westward stress increases along the coast from east to west, transport also increases. Consequently, the zonal mass flow is not preserved and divergences and convergences occur in response to varying wind stress. As a result, successive upwelling–downwelling events appear along the coast.
23 July 1999: image of the southern Bay of Biscay illustrating the zonal gradient of coastal upwelling strength (decreasing from west to east). (A) AVHRR SST (°C) temperature; and (B) SeaWiFS chlorophyl-a (mg m–3).

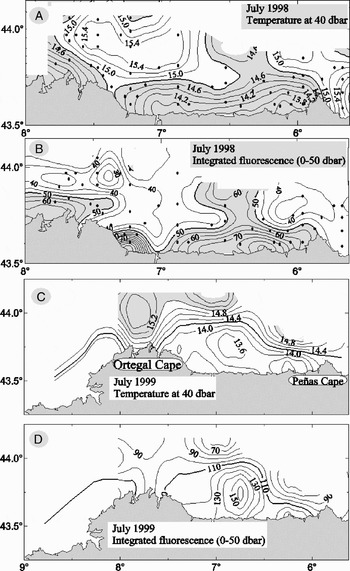
As summer advances, if the Azores High remains stationary, upwelling will have quasi-macroscale characteristics covering the entire Galicia, Cantabrian Sea area with a close agreement between upwelling and chlorophyll (Figure 10). It is common to find anticyclonic rings, formed by warm and slightly fresher waters, at the edge of the front produced by upwelling that are often held back by the orography of the large capes, as in the case of Cape Ortegal (see Figure 10A&C).
July 1998: (A) temperature (°C) at 40 dbar; (B) integrated fluorescence (0–50 dbar). July 1999: (C) temperature (°C) at 40 dbar; and (D) integrated fluorescence (0–50 dbar).

The autumn time
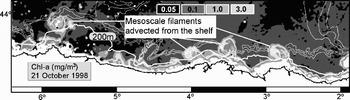
The process of fertilization of the continental shelf waters in the Galicia, Cantabrian Sea area starts in spring and continues through summer to the beginning of autumn. This process, which brings nutrients to the photic layer and leads to primary and secondary production, is of critical importance in the early life history of fish and in their later recruitment as juveniles. However, it must be taken into account that the dragging of surface waters over the continental shelf by the wind and the later rise of deep waters to replace them is not a single uniform process, since it is fundamentally mesoscale and has local peculiarities. In some cases, it may represent a danger to ichthyoplankton since it can drag large quantities of them out into the open sea (see Figure 11).
SeaWiFS chlorophyll-a (mg m–3) satellite image showing an effective cross-shelf transport process.

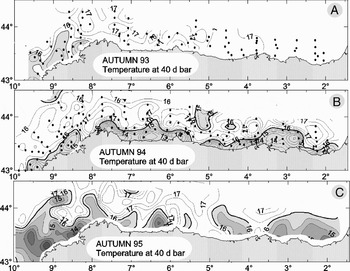
Moreover, if upwelling is important for the creation of phytoplankton–zooplankton and the survival of pelagic fish in spring, it is also important in summer–autumn for the maintenance of demersal juveniles (hake) feeding on zooplankton. Also, it must be taken into account that the pattern of the water masses in autumn, in addition to the climatic conditions in autumn, is a consequence of all the processes that have taken place in spring and summer. Thus, in the Cantabrian Sea, three different kinds of water masses in autumn can be found related to both the upwelling of the previous summer and the autumn climate, as shown in Figure 12. In the case of autumn 1993, the temperature at 40 m, which is a good indicator of rising sub-surface waters, showed the characteristics of an absence of upwelling with a predominance of the macro- over the mesoscale, an absence of frontal areas and a great uniformity of temperatures. The situation in 1994 was completely different, since there was a continuous strip of cold waters separated from those outside the continental shelf by an intense front. It was also different in 1995, when the upwelling strip was discontinuous and occupied areas outside the continental shelf. The fronts, moreover, while not as intense as in 1994, were appreciable, above all on the Galician continental shelf. These three situations, due to three different climatic conditions, the absence of easterly winds in 1993, persistent winds in 1994 and intense but local winds of low persistence in 1995, have enormous consequences for the survival of larvae and juveniles to be recruited. Sanchez & Gil (Reference Sanchez and Gil2000) described very poor hake juvenile recruitments in 1993, whereas they were excellent in 1994 and only normal in 1995.
Autumn (late September–early October) temperature at 40 dbar, showing three different upwelling situations in: (A) 1993; (B) 1994; and (C) 1995.

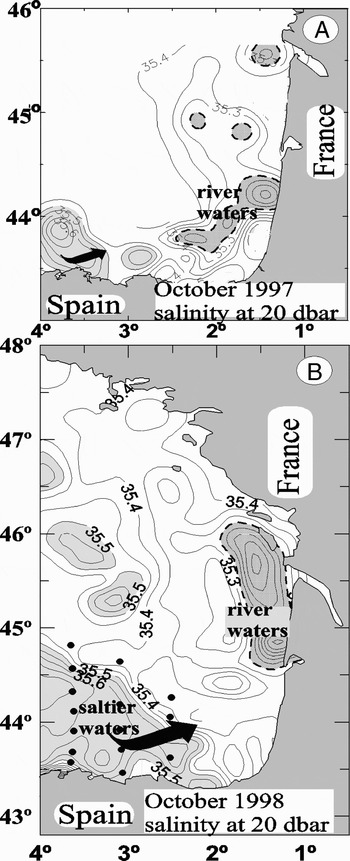
In spring, the waters of the continental shelf contain a large quantity of continental fresh waters, S < 35.0 on the French continental shelf and S < 35.5 along the continental shelf of the Cantabrian Sea. During the summer, the intense evaporation, upwelling and the drastic fall in continental water discharge, produce a considerable increase in salinity and a transformation of the salinity pattern throughout the southern edge of the Bay of Biscay. Hence, it is during this period that the fresh waters move back and withdraw from the Cantabrian Sea towards the southern French continental shelf, where they are also found in lesser quantity than in spring (Figure 13). The arrival of the saltier PC at the beginning of winter then finishes the process by transforming the salinity pattern of the water masses, filling the entire southern edge of the Bay of Biscay with high salinity waters (35.9 > S > 35.7). As a result, the cycle closes and the fresh waters that fill the Cantabrian Sea in spring are converted into high salinity waters in winter. Consequently, when the discharges of fresher (colder) continental waters begin, they will be low density waters, running to the north-east, due to their low salinity in relation to those found on the shelf in late winter.
Salinity at 20 dbar, showing how the fresh waters move back and withdraw from the Cantabrian Sea towards the southern French continental shelf in: (A) October 1997; and (B) October 1998.

DISCUSSION
The physical oceanography on the southern edge of the Bay of Biscay is mainly seasonal with regard to macroscale phenomena (winter and the PC, summer and upwelling) and is mesoscale during the changeover from one season to another (spring–autumn). Accordingly, physical–biological interactions, in the spawning cycle of eggs, the development of the larvae and later recruitment of juveniles, the two characteristics will considerably affect the success or failure of these processes.
In winter, the PC quickly invades the continental shelf and slope from Galicia to the French continental shelf. As a result of this current pattern, the ichthyoplanktonic material over the continental shelf and shelf break would be transported with all certainty towards the south-eastern most corner of the gulf and thereafter continue along the French shelf break. In other cases, if it is trapped in anticyclonic eddies, it will move out into the open sea far from the continental shelf. Near the coast, there will be a narrow strip where the current is not very intense, limited by the intense flow running through the outermost part of the continental shelf and shelf break. Only under these conditions, due to ageostrophic movements transversal to the current, can a flow towards or away from the continental shelf be generated. These processes can be produced by winds acting on water masses with anomalous density characteristics, as in the case of the waters of continental origin, which are characterized by low salinity and very low density.
In March, the physical conditions begin to change, with the spatio-temporal macroscale giving way to an intense mesoscale, in which climatology and local characteristics determine the type of distribution for each water mass and its associated flows. On the one hand, the progressive weakening and extinction of the PC makes the anticyclonic rings fragment over the shelf break. Once the flow of continental fresh waters towards the sea increases, they end up occupying the entire continental shelf. On the southern French continental shelf of the Bay of Biscay, the massive discharge of continental waters rapidly fills the continental shelf with low density waters. In the case of the ichthyoplankton retained on the shelf break and slopes by the rings of the poleward waters, the possibility of being recruited to the bottom of the continental shelf may be favoured by the interaction between the flow created by the continental waters, above all on the southern French continental shelf where they are highly abundant, and the rings of the poleward waters. In the Cantabrian Sea area, the continental discharges are much less than on the French continental shelf and therefore the process of filling with light waters is slower. Thus, the density fronts and the geostrophic velocity pattern are much weaker than on the French continental shelf. Over the shelf break there will be westwards transport because of the rings of the poleward waters, since they are anticyclonic rings with flows towards the west close to the continental shelf. In the western Cantabrian Sea, a westward displacement of the rings and their entrance in the wider Galician continental shelf is more likely. In this case, the situation of the front between the poleward waters, which are retreating towards Portuguese waters, and those of the Cantabrian Sea (see Figure 10C&D) is of great importance to the development of these rings and to their possibility of reaching the Galician continental shelf from the Cantabrian Sea, and is a determinant for upwelling over the Galician continental shelf.
During spring (April, May and June), spatio-temporal mesoscale processes are dominant, with spatial dimensions of a few tens of kilometres and time periods of weeks. During the summer months, certain macroscale structures replace the spring mesoscale structures. Most of the Galician and Cantabrian Sea continental shelf is occupied by cold waters rich in nutrients. However, the water layer affected by the wind, the Ekman layer, which depends on the intensity of wind stress and is not generally greater than 50 m, is displaced and filaments of waters are then lost far from the continental shelf. Whatever the case, the physical conditions of upwelling provoke advection outside the continental shelf. At the beginning of autumn, changes begin to appear in the forces that determine the dynamics of the area. As in the changeover from winter to spring, the forces that generated large spatio-temporal macroscale structures begin to weaken and give way to a transitory period in which the situation that the water masses pattern has at the end of the summer is of great importance. If, during the summer, upwelling at the southern edge of the Bay of Biscay has been weak and discontinuous, then the displacement towards the south of the Azores High permits the passage of the Atlantic Lows, which bring winds of a westerly component. Thus, in a short period of time and due to a downwelling process over the continental shelf, all trace of upwelling disappears (see Figure 12A). On the other hand, a summer like that of 1994 in combination with a not particularly rainy autumn in the Cantabrian Sea would result in a water masses pattern similar to that shown in Figure 12B. The situation at the end of the summer is the initial condition on which the forces pattern will act, especially the wind regime in the area, in order to determine the final situation during the autumn. As a result, depending on the different types of initial situations and the forcing pattern, a wide variety of situations are possible for the water mass patterns over the continental shelf, the shelf break and slopes. In some situations, the macroscale predominates, as in autumn 1993, and, in others, one will be just as important as another, as occurred in 1994. The situation that arose in 1995 can be considered intermediate between the two mentioned above and was a consequence of different initial conditions and climatic conditions. Nevertheless, even though the situation in autumn at the southern edge of the gulf can mainly be classified into these three types, the local conditions may cause variations in this general pattern. Thus, the local oceanographic situation will be highly important when early life history processes are assessed.
Regarding macroscale processes in the south Bay of Biscay, it is a known fact that during the years from 1992 to 2001, the upwelling in the Galicia and Cantabrian Sea area have not been favourable to the supply of nutrients to the photic layer (Gil & Sanchez, Reference Gil and Sánchez2003). Only those of 1994 and 1997 can be considered good. From the above, it might be deduced that macroscale changes may benefit some species more than others, particularly in terms of food availability, and that those not benefiting are subject to a higher mortality by predation. Has this situation affected the pattern of interaction between anchovies and sardines? And is it the cause of the almost complete disappearance of anchovy stock from the Spanish coast? A paper by Bakun & Broad (Reference Bakun and Broad2003) uses the term loopholes to refer to interactions between strategies and environmental conditions that result in a significant mortality reduction in fish early stages. Understanding and assessment of macroscale environmental conditions in relation to loopholes is relatively simple since coastal upwelling, the intensity of the PC and the general circulation pattern can be measured using highly reliable tools (satellite data and a few cross-shelf transects). On the other hand, an understanding of variability and the way in which it affects mesoscale phenomena in relation to FELHS is more difficult. For example, river discharges are one of the most important factors generating mesoscale variability in flows and water masses. The anchovy spawning areas are in estuarine areas and therefore are very directly related to variability in river discharges. The discharges of the main rivers flowing into the Bay of Biscay may vary by a factor of four between the high discharges of one year and the low ones of the next, and these periods of low–high discharges may last up to three years. But this macroscale fresh water pattern is profoundly modified by wind effects and, in some cases, the fresh water is advected offshore, destroying the coastal north-eastern geostrophic flow, and the coastal fresh water is replaced with upwelled saltier water (Lazure & Jegou, Reference Lazure and Jegou1998; Puillat et al., Reference Puillat, Lazure, Jegou, Lampert and Miller2006). Thus, the increase in run-off is not sufficient to maintain the freshwater mesoscale pattern and its variability may be much greater than the variability of river discharges. This requires control over two factors and their consequences on the physical estuarine pattern in order to relate freshwater discharges with the success or failure of FELHS. The same arguments can be applied to a multitude of mesoscale phenomena of high variability that require a multiple factor analysis. Moreover, the opportunity factor must also be added to the physical mesoscale variability pattern. Therefore, the same physical phenomenon, which generates mesoscale variability in the physical pattern, may be a consequence of large mortality or not, depending on the time–space frame in which it takes place. This characteristic of time–space opportunity for the same physical effect means that the statistical analyses often fail to give good results when correlating physical variables with FELHS.
Therefore, throughout the year at the southern edge of the Bay of Biscay, cyclical variations occur both in the current pattern and in the water masses pattern. Thus, fresh waters begin to fill the continental shelf in spring from the east, which are transformed in summer, and they are finally replaced by salty waters from the west of the gulf in winter. On the other hand, the flows begin as eastward flows over the continental shelf at the beginning of spring, before turning westward over the shelf break during the summer and finally to the east once again in winter due to the PC. All of these cyclical variations in the dynamics and water masses pattern may be considered to be of a macroscale character. Therefore, good agreement might be expected between these macroscale cyclical phenomena and the FELHS phenomena in the Bay of Biscay. However, unfortunately, we have seen that this does not always happen, and the main problem is that the macroscale cyclical field imposes itself over the non-cyclical mesoscale field, which means that the field as a whole is very difficult to predict.
ACKNOWLEDGEMENTS
We would like to thank the AZTI Instituto de Investigacion y Tecnologia para la Pesca, Oceanografía y Alimentación, (L. Motos, P. Alvarez, A. Uriarte), Herrera kaia portualdea z, g 20110 Pasaia (Gipuzkoa) Spain, as they provided the physical SEFOS transect data. Thanks to Xabier Irigoien and Ricardo Sánchez Leal for their help.