I. INTRODUCTION
Powder bed fusion (PBF) is a category of additive manufacturing (AM) that includes the specific technology known as laser sintering (LS). 1 LS is one of the main additive processes which can be used to produce functional parts by fusing together successive layers of polymer powder. Reference Kruth, Levy, Klocke and Childs2 LS is of interest to industry as it does not require tooling and therefore enables manufacturers to offer parts with a high degree of design freedom. This opens new opportunities toward an increased level of personalization or individualization and reduces the often high investments for tooling within luxury or one-off products. Furthermore, it is possible to combine many individual parts of an assembly into a single component helping to eliminate part numbers, inventory, assembly steps, labor, and inspection. Reference Wohlers and Caffrey3 Since there are many different requirements for polymer consumer products, it is clear that the current repertoire of available polymers in LS is no longer sufficient. The most common polymers used in LS are semicrystalline polymers typically polyamides (PA12 or PA11), polyamide-based compounds as well as some filled varieties and a small number of thermoplastic elastomers. Reference Schmid, Amado and Levy4,Reference Goodridge, Tuck and Hague5 During LS of polymers, the laser is used to only introduce the amount of energy needed to push the material into the melting phase, requiring that the majority of the energy is provided by part bed heaters. Reference Diller, Yuan, Bourell and Beaman6 As a result, the polymer often spends many hours close to its melting point during the process. This leads to issues regarding the reuse of the unsintered powder. The material undergoes repeated heating cycles that cause changes in the polymer's physical and chemical properties. Reference Gornet, Davis, Starr and Mulloy7,Reference Dotchev and Yusoff8 For polyamide-based powders, previous work has shown that there is a tendency to cause cross-linking and chain degradation increasing the polymer's molecular weight through this extending processing regime. Reference Kühnlein, Drummer, Rietzel and Seefried9,Reference Rietzel, Kühnlein, Hülder and Drummer10 In the case where the viscosity of the polymer melt increases, the connection of the single layers could be hindered. As a consequence, this affects the quality of the manufactured parts due to weak inter-laminar bonding and possible air voids that are enclosed. Reference Zarringhalam11,Reference Mielicki, Wegner, Gronhoff, Wortberg and Witt12 The ability to reuse a LS polymer powder without the need to refresh it with virgin material therefore strongly influences its efficient use and the reliability of these materials being processed repeatedly without expecting major changes in their properties. Reference Dotchev and Yusoff8,Reference Rietzel, Kühnlein, Hülder and Drummer10 Hence, knowledge about the performance capabilities and limitations of the elastomeric materials observed in this paper aims to contribute toward the further advancement of AM.
To generate additional property profiles and therefore to broaden the field of applications for parts manufactured in LS, a new thermoplastic polyurethane (TPU) powder has been studied by the authors, a type of polymer which has not been well reported in the AM literature up to now. The aim of this research was to characterize the aging processes of the TPU and compare it with the commercial elastomeric reference DuraForm®Flex (3D Systems). Both thermoplastic elastomers (TPEs) allow the production of flexible, rubbery parts by the LS process and have very similar mechanical properties at ambient temperatures. However, the chemical resistance and characteristics differ due to their chemical basis. Therefore, it is aimed to evaluate the tendency of the two polymers to be affected by the thermal loads within a LS build. The investigations included the effects of aging on the intrinsic properties, such as molecular weight, as well as the changes in the bulk material. A preliminary study that looked at the aging of a TPU undergoing four aging cycles being processed by LS has been reported. Reference Plummer, Vasquez, Majewski and Hopkinson13 However, in a real manufacturing environment, the materials have to reach maximum efficiency, and thus within this paper, the materials have been processed 14 times generating 15 different aging stages of powder without refreshing with virgin material, gaining a more substantial input for industrial use as well as input for a comprehensive database for LS materials. Nano CT was applied to detect the density of the fabricated specimen to validate potential changes in the polymer melt flow and the effects on part density. The methods applied have aimed to gain a deeper insight into the polymer aging processes and the use of suitable analysis methods following that aim.
II. EXPERIMENTAL
A. Materials
The LS powders observed by comparison in this work were
-
(i) A TPU exclusively supplied and developed for the LS process within a project between BMW AG and Freudenberg Forschungsdienste SE & Co. KG. The TPU is an aliphatic, ester-based (building the soft segment) block copolymer (polyurethane building the hard segment) without ether linkages.
-
(ii) DuraForm®Flex (DF) is supplied by 3D Systems and serves as benchmark material as described before. The supplier does not give information on the formulation or type of polymer, but the information available in the literature and the IR-analysis carried out in this study suggests that the DF also is a block copolymer based on aromatic ester blocks (building the hard segment) and aliphatic ether blocks (building the soft segment). Reference Levy, Boehler, Martinoni, Schindel and Schleiss14
B. LS system and production of test samples
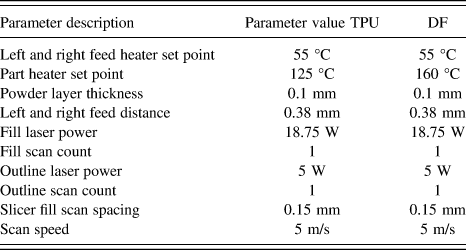
A SinterStation® 2500 plus (3D Systems, Rock Hill, SC) was used to generate the different aging states and produce tensile test specimens applying the parameters shown in Table I for each of the materials observed. The process parameters were qualified in a preceding study that aimed to achieve favorable tensile properties in terms of percentage elongation at break (%EaB) and ultimate tensile strength (UTS). In the study, a broad range of energy densities as well as parameter combinations for exposure was investigated. As expected, at higher energy densities, ranging between 0.015 and 0.025 J/mm2, the tensile properties reached their maximum. Their influence on part properties and the range in varying possible parameters during LS are described elsewhere. Reference Gibson and Shi15–Reference Dupin, Lame, Barrès and Charmeau18 To allow for comparison, the typical default scan parameters according to 3D Systems are 9 watts laser power; 0.15 mm scan spacing; 5 m/s scan speed and a powder layer thickness of 0.1 mm. Reference Soe, Martindale, Constantinou and Robinson19,20
Machine parameters used for the production of the TPU and DF test specimens.

Type S2 tensile test specimen was produced according to DIN 53504:2009-10 (as specified by the International Standard ISO 37:2005). 21 The tensile samples were produced in the XYZ-direction according to ASTM F2921-11e3 ensuring a flat build that did not require a large amount of powder. 1 As there is neither a specific scenario described in the literature how to condition LS powders for optimal processing, nor is it known so far how moisture affects the process, the powders for all builds were processed at equilibrium moisture between 0.2–0.3% to ensure comparable starting conditions. A total of 14 builds led to 14 different aging states of tensile specimen and 15 different states for powder samples including virgin and aged powder. For the analysis of the fine powders, it was important to ensure representative sampling. Therefore, each powder sample was taken with a sample splitter (according to DIN 51701, part 4) before being analyzed with regards to its particle size distribution (PSD).
C. Analysis methods and standards
1. Mechanical properties and part density
The mechanical properties were detected by means of tensile testing. All tensile tests were performed in a controlled environment, 20 °C and 50% relative humidity (RH) detecting Young's modulus, UTS and percentage elongation at break (%EaB). The testing machine used was a Zwick Z020 (Zwick GmbH & Co. KG, Ulm, Germany) equipped with a 1 kN load cell, an optical extensometer, and a testing speed of 200 mm/min (DIN 53504:2009-10). For each of the aging states, a number of five S2 tensile bars were tested at constant conditions and the average value was used for comparison.
To detect the effect of aging on part density, a computer tomograph (CT) GE Nanotom 180 (GE Sensing & Inspection Technologies GmbH, Huerth, Germany) with a molybdenum target was used. Within this study, the part density was intended mainly to serve as a parameter to validate the effects of changing powder properties and melt flow on part density. CT allows the generation of 2D and/or 3D reconstructions of the internal microstructure of an object. Reference Solórzano, Pardo-Alonso, de Saja and Rodriguez-Perez22 In capturing numerous layers of a specimen and stacking them together in a three-dimensional x-ray image, it is possible to detect differences in the parts' density and likely porosity. Reference Van Geet, Swennen and Wevers23,Reference Solórzano, Pinto, Pardo, Garcia-Moreno and Rodriguez-Perez24 The image can be visualized as a grayscale or as a pseudo-colored image, depending on the best contrast that can be generated for each object. To achieve a high resolution and contrast, it is necessary to set a proper threshold between the gray levels of air (no attenuation) and polymer (attenuation due to sample) that leads to a differentiation within the gray level histogram. Reference Solórzano, Pinto, Pardo, Garcia-Moreno and Rodriguez-Perez24 While analyzing samples out of just one type of material, as it was the case in this study, it is possible to reach a maximum error of around 0.01%. 25 As other methods of density measurement can lead to a significant measurement error as a result of the rough surface of the parts, it was decided to measure the density of three aging states in the nano-CT. Therefore, for each material, a sample manufactured out of virgin material, one for aging state seven and one for aging state 14 were analyzed. For this analysis, cubes with an edge length of 10 mm were used to achieve a CT resolution of around 3 µm throughout the sample dimension.
2. Analysis of aging effects on macromolecular scale
For the correlation of potential changes in molecular weight with the change in the viscous flow of the polymer melt, the melt volume rate (MVR) was measured with a GÖTTFERT MI-4 melt index tester (GÖTTFERT Werkstoff-Prüfmaschinen GmbH, Buchen, Germany) according to DIN EN ISO 1133. The test load applied for both polymers was 2.16 kg with a pre-melt time of 4 min. TPU was tested at 170 °C and DF at 230 °C due to their different melting temperatures. All powder samples were measured at equilibrium moisture between 0.2–0.3%. The moisture content was analyzed with a Mettler-Toledo HX204 halogen moisture analyzer (Mettler-Toledo GmbH, Gießen, Germany).
To detect potential changes of macromolecules, the molecular mass distribution was analyzed over all 15 aging states applying high temperature gel permeation chromatography (HT-GPC). Reference Ehrenstein and Pongratz26,Reference Kühnlein, Drummer, Wudy and Drexler27 The separation column used was a PLXT-20 Rapid GPC (stationary phase was highly cross-linked polystyrene with defined pore sizes) with orthocresol used as the solvent for TPU at 140 °C and trichlorobenzene for DF at 160 °C.
For the investigation of low molecular weight fractions within the polymers, potentially emerging due to thermal cracking at the chain ends, an extraction method was applied. The samples used were the remaining parts of the tensile specimen. The polar, volatile, and aprotic solvents applied (tetrahydrofuran (THF) and acetone) served to only leach out the monomers and oligomers of the sample parts and do not dissolve the high molecular weight chains of the original polymers. With this method, it was investigated whether the concentration of low molecular weight fractions increased with aging of the material over multiple processing cycles. An analysis balance from Mettler with an accuracy of 0.1 mg was used. The sample parts with the corresponding aging states were dried by heating in an oven for 30 min at 80 °C and subsequently for 30 min at 100 °C. To further dry the samples, they were sorted in a desiccator on top of hygroscopic concentrated sulfuric acid at room temperature for 18 h. Fractions of the parts were put into glasses that also were dried for 3 h at 100 °C beforehand. The test samples (n = 3 per aging state and solvent applied) were then fully covered with the respective solvent and mildly agitated for 18 h. After allowing loose particles to settle the solvent was decanted carefully and fresh solvent was applied. Afterward the samples were stored for an additional two hours under mild movement. The particles that might have been replaced from the samples surface were allowed to settle for an hour and the solvent was again decanted off carefully. After being dried for three hours at 80 °C and subsequently for 1 h at 100 °C, the weight of the samples was determined again and the material percentage weight loss compared with the samples' original mass was calculated.
With Fourier transform infrared spectroscopy (FTIR), it is possible to detect both chemical and physical changes of polymers, especially the aging induced, oxidative degradation reactions. Reference Ehrenstein and Pongratz26,Reference Wilkie28,Reference Zhang, Maxted, Barber, Lowe and Smith29 The spectrometer used in this work was a Nicolet 5700 (Thermo Fisher Scientific Inc., Waltham, MA) with an ATR-Crystal in reflective mode with a spectral resolution of 0.4 cm−1 again investigating all 14 aging states of the test pieces for both types of polymer.
3. Analysis of aging effects on powder scale
To identify the physical characteristics of the powder particles, a Camsizer XT (RETSCH Technology GmbH, Haan, Germany) was used. It applies a high resolution camera system that consists of two digital cameras, one to detect the size and characteristics of fine particles, while the second camera is optimized for the analysis of large particles. Reference Raatz30,31 For the quantification of changing bulk properties, a FT-4 Powder Rheometer (Freeman Technology, Tewkesbury, UK) was used measuring the conditioned bulk density (CBD) [g/ml] relative to the single aging states. Reference Freeman32–Reference Ziegelmeier, Wöllecke, Tuck, Goodridge and Hague34 An important requirement for the analysis of fine bulk powders, especially for those with a broad PSD, is to ensure representative sampling. Therefore, samples have always been taken out of a previously tumbled and well mixed bulk before being lead through a chute riffler to generate representative samples. From the literature, it is known that the sampling with a chute riffler is a practical method leading to the second smallest standard deviation of approximately 1.10% underneath the state of the art splitting techniques. Reference Merkus35
III. RESULTS
A. Mechanical properties and part density
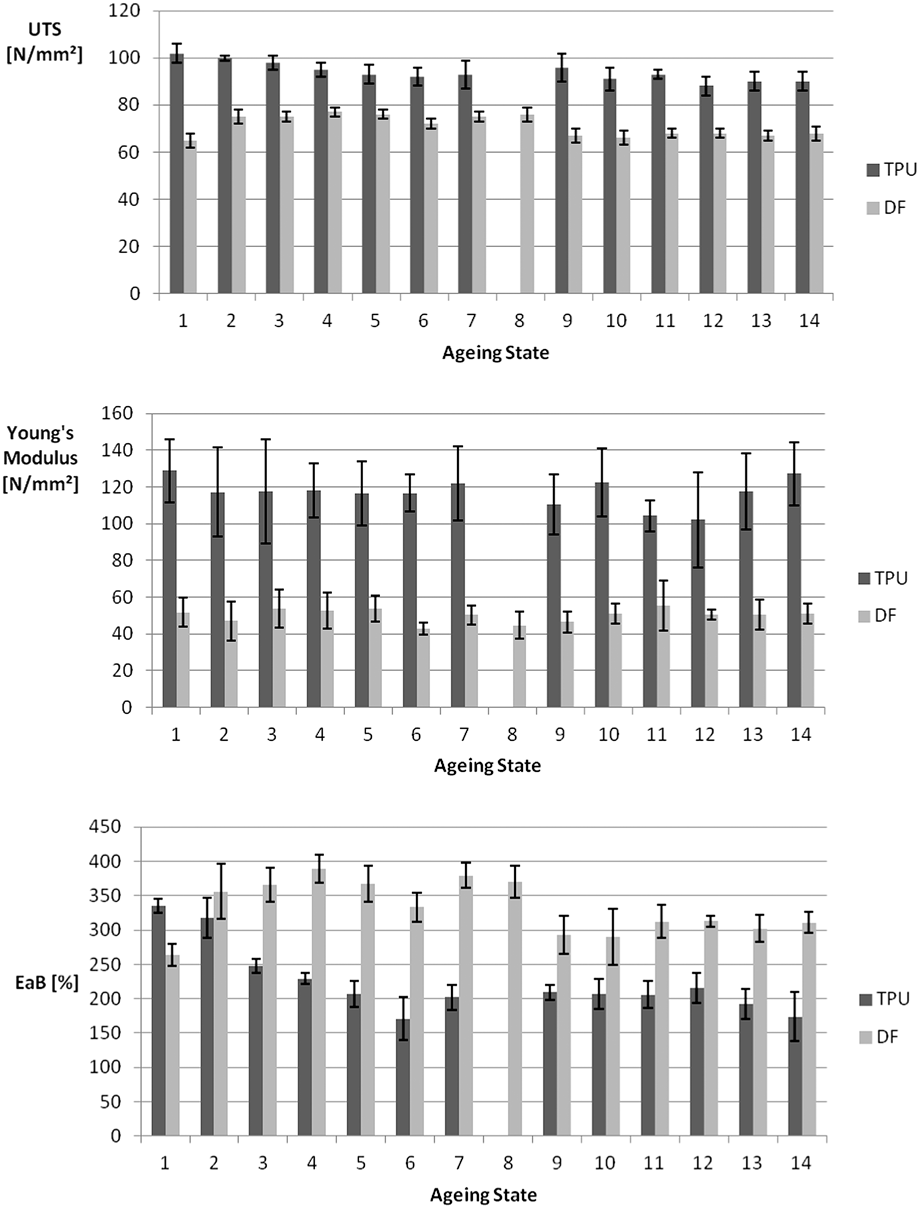
The tensile data are shown in Fig. 1 and present a direct comparison of TPU and DF over all aging stages. No data for TPU aging state number 8 were collected due to a process breakdown caused by a change in the powders PSD and therefore its bulk density that led to a ‘short feed’ within the process (see Sec. III. C).
Results of tensile testing for TPU and DF over all aging states.
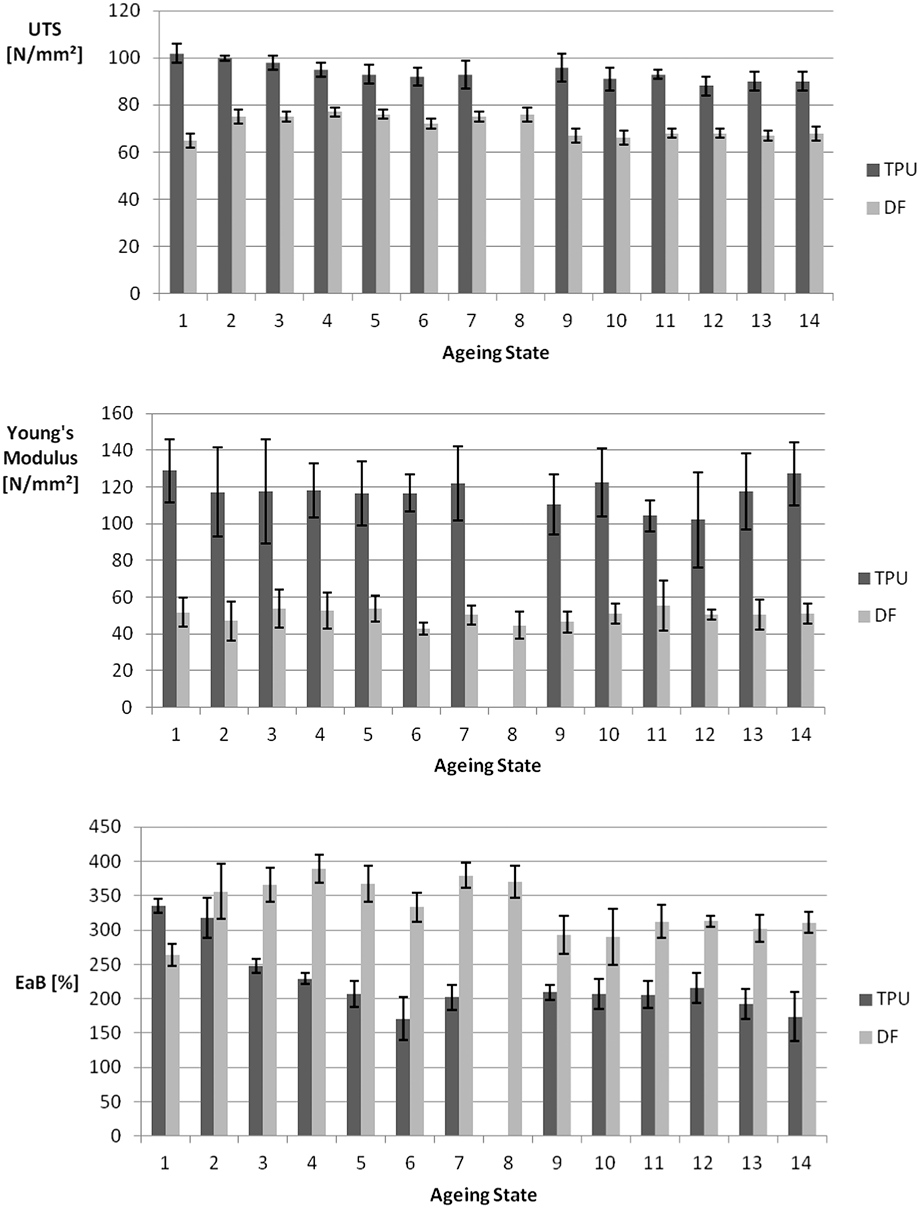
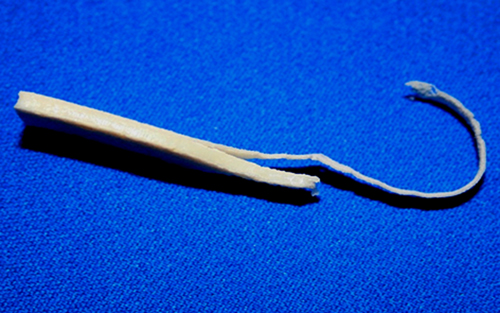
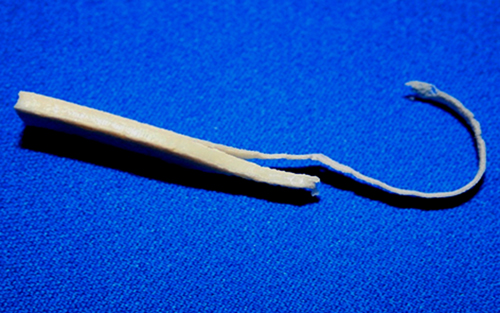
In general, TPU recorded higher tensile strength and stiffness compared with DF. The mean values of UTS and Young's modulus for both materials do not show a significant change over their aging cycles. TPU did show a slight decrease in UTS from 102 N/mm² to around 90 N/mm² while DF showed a slight increase in UTS from 65 to 75 N/mm². From aging cycle eight, DF then decreased in UTS but leveled off at around 68 N/mm². During the tensile testing of DF, a clear delamination of the single layers was observed in the tensile test specimens representing weak and inhomogeneous layer bonding. Such weak bonding seemed to cause the breakage in single layers rather than in the entire cross section of the tensile specimen and is likely to reduce the polymers original capabilities even more (see Fig. 2).
DF tensile specimen showing delamination between single layers.
The stiffness of TPU with a Young's modulus of around 117 ± 18 N/mm² was significantly higher compared with DF with a modulus averaging 50 ± 7 N/mm². Neither material seemed to be affected by the repeated processing and the thermal load in terms of their stiffness and UTS. When comparing the values for %EaB, the results differ. While the TPU shows a higher %EaB at the first processing cycle at 335 ± 10% compared with DF with 263 ± 16%, there is a reversed trend from cycle number two. From then on the TPU decreases significantly from around 335% to 170% EaB until aging state number six to remain at this level until the 14th aging state. The %EaB of DF increases from 263% to 389% coming from the first to the second processing cycle, descending to a %EaB of approximately 300% at cycle number 14.
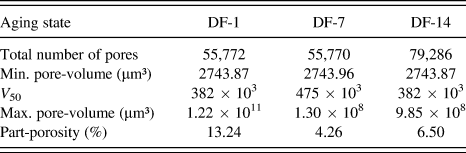
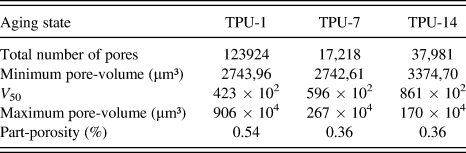
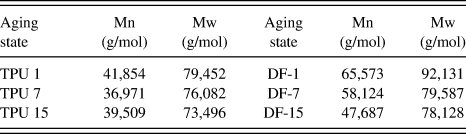
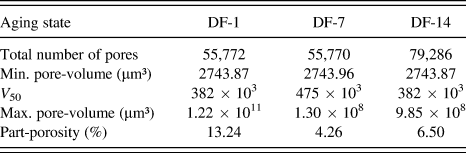
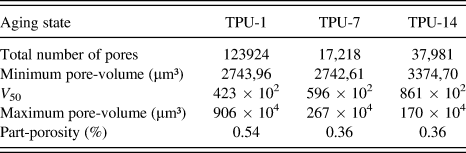
Tables II and III depict the results of the CT analysis indicating that the TPU in general showed a part porosity that was significantly lower than DF. This is connected to the level of viscosity which is significantly lower (−12% in average molecular weight in aging state one, see Table IV) for TPU, favoring particle coalescence during the exposure of the material. Reference Bellehumeur, Kontopoulou and Vlachopoulos36 Both materials showed a reduction in porosity with progressing aging cycles along with a decrease in molecular weight and even more clearly an increase in MVR.
Pore-analysis for DF aging states 1, 7, and 14, V 50: mean pore-volume.
Pore-analysis for TPU aging states 1, 7, and 14, V 50: mean pore-volume.
Results of HT-GPC analysis for TPU and DF of the aging states 1, 7, and 15, reference in both cases was polystyrene standard with Mp = 98.000 g/mol.
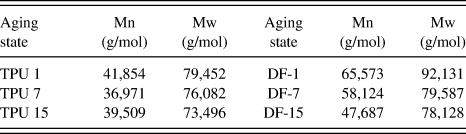
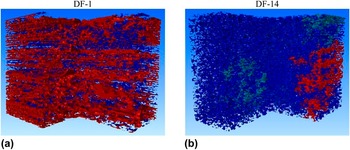
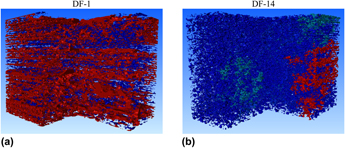
Table II shows that DF did not vary significantly in number of pores coming from aging state one to seven but showed an increase of around 30% at aging state 14 compared with DF-7. In previously conducted studies on the effect of different PSDs on part density and tensile properties, applying the same processing parameters and the same DF powder as within this research, porosities at around 12.75% were recorded. Even for the preferable PSD with a reduced amount of fine particles leading to the highest packing density, the part porosity could only be decreased down to 11.15% in a virgin material state. Therefore, it can be assumed that this represents a typical porosity level for virgin DF parts even at favorable processing parameters and is the reason for often infiltrating the later parts to increase, i.e., shore hardness. Reference Ziegelmeier, Christou, Wöllecke, Tuck, Goodridge, Hague, Krampe and Wintermantel37 The overall part porosity within this study was the highest at DF-1 with 13.24% decreasing by 67.8% at the seventh aging state and further increasing by 34.5% up to aging state 14. The smallest pore size did not vary as the values were close to the resolution limit of the CT. The maximum pore size though does change with the biggest pore in DF-1 at 1.22 × 1011 µm3 (the second largest pore in DF-1 is 1.02 × 108 µm3), 939 times larger than the biggest pore in DF-7. This largest pore in DF-1 is one open-pore system. For virgin DF powders, this effect has been observed within preceding unpublished studies looking into the effects of PSD on part density and this effect occurs reproducibly for this material state. The same LS system as well as parameter setup and nano-CT was applied to detect the parts' densities. The overall part porosity for DF investigated in this study was 14.6% and the maximum pore-volume was 5.87 × 1010 µm3 (the second largest pore was 4.72 × 107 µm3). From DF-1 to DF-14 that the largest pore [Fig. 3(a)] was downsized gradually with the aging states. At aging state 14, the maximum pore size increased again by 8.55 × 108 µm compared with aging state seven. This seems to be an artifact of the powder application process or issues within the temperature control of the LS-system, as the pore did not generate systematically over the whole part rather than on one side of the part [see Fig. 3(b)].
Pore analysis for (a) DF-1 with single open pore network and (b) DF-14 with reduced pore size.

Table III highlights the results for the pore analysis of TPU. From TPU-1 with a total number of pores of 123,924 this amount decreases by 86.1% to TPU-7 followed by an increase of 54.7% to TPU-14.
From TPU-1 to TPU-7, the total number of pores did not change significantly while the maximum pore-volume decreased by 70% and its mean pore-volume V 50 increased by 29%. From TPU-7 to TPU-14 though, there is a slight increase of around 632 µm3 in the minimum pore-volume alongside with an increase of V 50 by 30% and a decrease in maximum pore-volume by 36%. The development of the maximum pore size shows a clear trend steadily decreasing. From TPU-1 to TPU-7, the maximum pore size is reduced by 71% and a total of 81.2% from TPU-1 to TPU-14. With this increase in the large pores the overall part porosity, which in general is already very low for TPU, also shows a decrease of 0.18% from TPU-1 to TPU-7 to level off until the last aging state.
B. Aging on macro-molecular scale
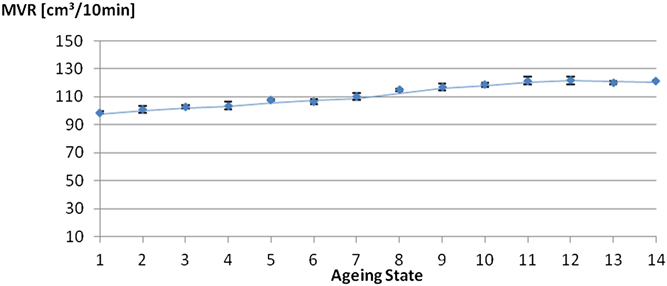
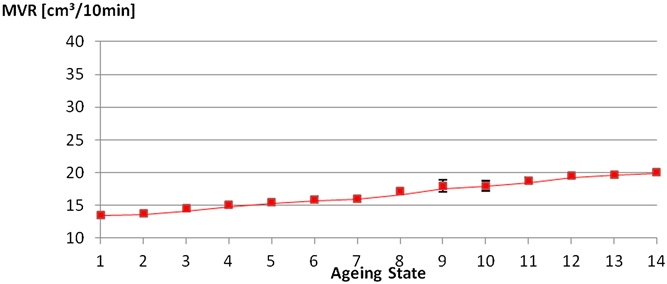
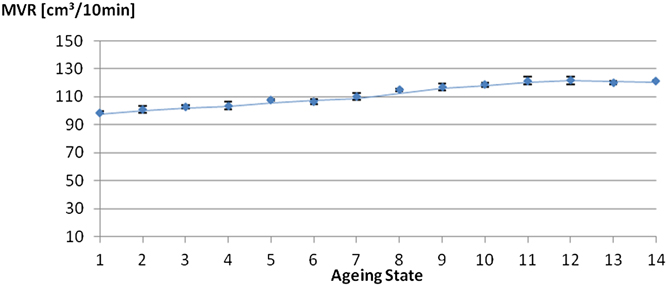
The stability of the melt properties of a LS polymer is an important criterion for reproducible part properties. Reference Beal, Paggi, Salmoria and Lago38–Reference Kontopoulou and Vlachopoulos41 For the work presented here, a practical method like the melt index tester introduced in Sec. II. C was used to measure a total of 18 different aging samples and correlate potential changes in molecular weight with the effect on the melt flow. To interpret the results the right way, it is important that one does not correlate the values for MVR between the two different polymers. The tendency of a polymer to change the MVR due to thermal loading in LS, though, allows a statement on how sensitive a certain material reacts on these stresses. For both TPU and DF, an increase in MVR can be detected with ongoing processing cycles representing an enhanced flow of the polymer melt (see Figs. 4 and 5). Coming from aging state one, the TPU showed a MVR of approximately 96 cm³/10 min to steadily increase up to around 120 cm³/10 min at the 15th aging state (+20% maximum change in MVR aging state one to 15). The DF came from 13 cm³/10 min reaching its highest value at the aging state 15 at around 20 cm³/10 min (+33.3% maximum change in MVR aging state 1–15).
MVR of TPU over aging states.
MVR of DF over aging states.
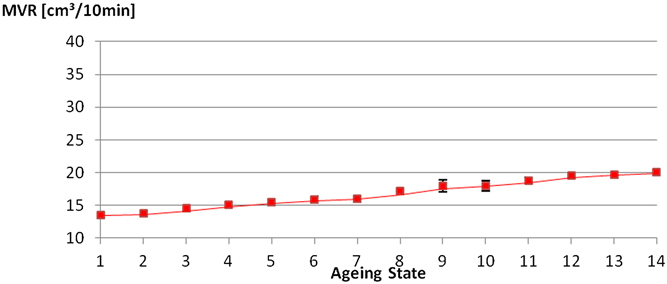
Over all its aging states, DF did not level off as the TPU did from aging state 12 and therefore might show a further increase in the MVR likely to affect the test bars EaB undergoing additional processing cycles.
Deduced from the HT-GPC analysis, a statement on the absolute molar mass can be made. Hereafter, the TPU virgin material has a molecular mass at around 79.000 g/mol and the virgin DF a molecular mass of 90.000 g/mol. The weight average molecular weight, Mw, shows a reproducible trend of chain degradation for both materials (see Table IV).
Looking at the number average molecular weight, Mn, there also appears to be a decrease in the average value from aging state one to 15 for the two polymers, though the trend is not systematic for the TPU. However, the results show that there is slight chain degradation present for both polymers with increasing processing cycles. Reference Hernández42
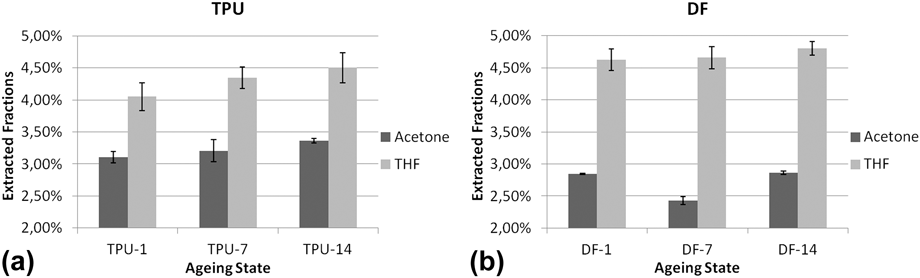
Although polycondensation (principle reaction for DF) and polyaddition (principle reaction for TPU) are different reactions, the mechanism of both types is similar, being the step reaction mechanism. Therefore, a chain scission will be the primary degradation mechanism with a random chain scission in the segments, representing the weakest “linkages”. As the drop in viscosity (MVR) was significant compared to the changes in molecular weight, the extraction method was applied as a practical and especially quick method to detect whether the unexpected effect of depolymerization from the end of the chains occurs. The results of the extraction method in Fig. 6 show that THF obviously is the solvent with higher solubilizing power compared with acetone, as the THF also dissolved oligomer fractions to a certain degree, as it created the higher percentage in weight loss. Both TPU and DF showed a slight increase in extractable low molecular weight fraction, although this increase was not significant within the standard deviation of the measurement.
Results of extraction method showing the weight loss of the aging states 1, 7, and 14 for (a) TPU and (b) DF.
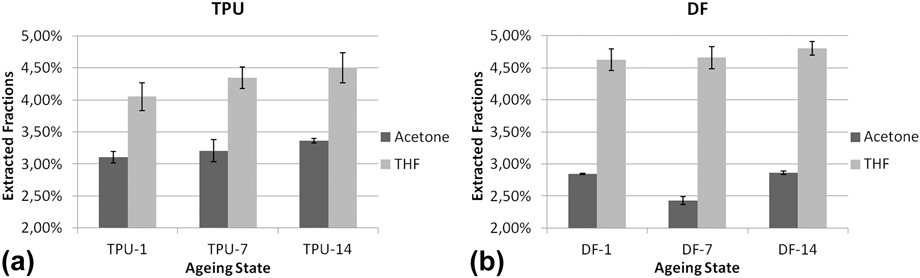
Therefore, within the accuracy of the investigation, no significant change of the low molecular weight fraction in the polymers was found. This indicates that the increase in viscosity was not necessarily caused by low molecular components that might act as a plasticizer within the polymer chains. This observation is in accordance with the step mechanism these types of polymers result from. Polyadducts like polyurethane and polycondensates like polyesters do not typically degrade from the chain ends but randomly break the macromolecule, most likely the ester links. Reference Ehrenstein and Pongratz26,Reference Domininghaus, Elsner, Eyerer and Hirth43 The probability for a scission close to the end of the polymer chain is low, so the increase of the fraction of oligomeres in the polymer matrix can generally be expected to be low too. The reduction of melt viscosity, indicated by the increased MVR in Figs. 4 and 5, can therefore be attributed to the overall reduction of the mean chain length of the polymers due to randomly occurring chain scission. Figures 7 and 8 depict the results of the FTIR analysis to detect potential chemical changes of the macromolecules of both polymers due to the high processing temperatures. Ester-based thermoplastic elastomers in general show enhanced resistance to oxidation, whereas ether-based TPEs are more resistant toward hydrolysis while showing more pronounced oxidative reactions when exposed to thermal loads in atmospheric oxygen. Reference Lovett and Eastop44–Reference Suhara, Kutty and Nando46 The thermal weak point in TPUs is the hard segment of the macromolecules, the polyurethane bond. Reference Grassie, Zulfiqar and Guy47,Reference Petrovic, Zavargo, Flynn and Macknight48 As the LS process works under inert conditions (nitrogen flooded build chamber), oxidation is not expected to dominate potential degradation effects.
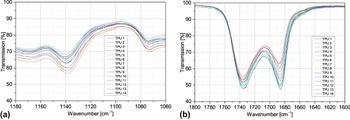
IR-spectrum of TPU aging state 1 to 14, (a) carbon–oxygen stretching vibration (wave number 1150 to 1040 cm−1) and (b) the urethane-bond (wave number around 1700 cm−1).

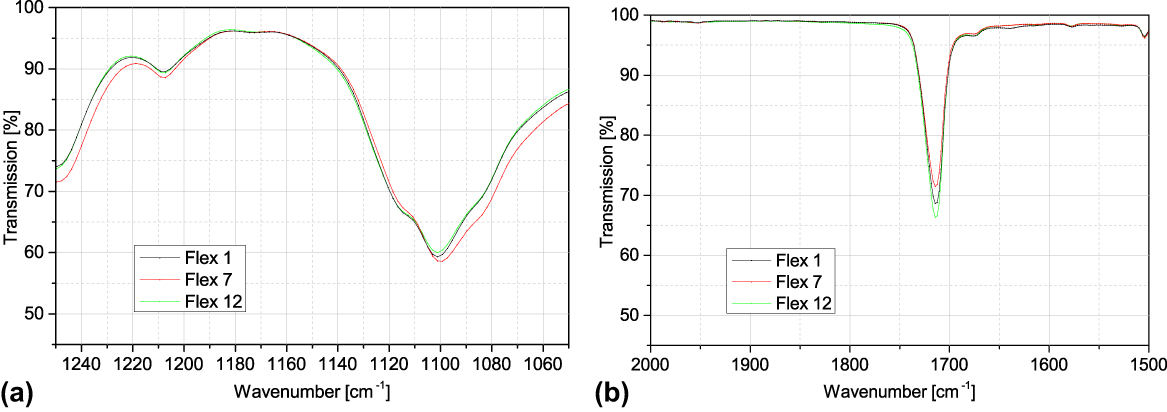
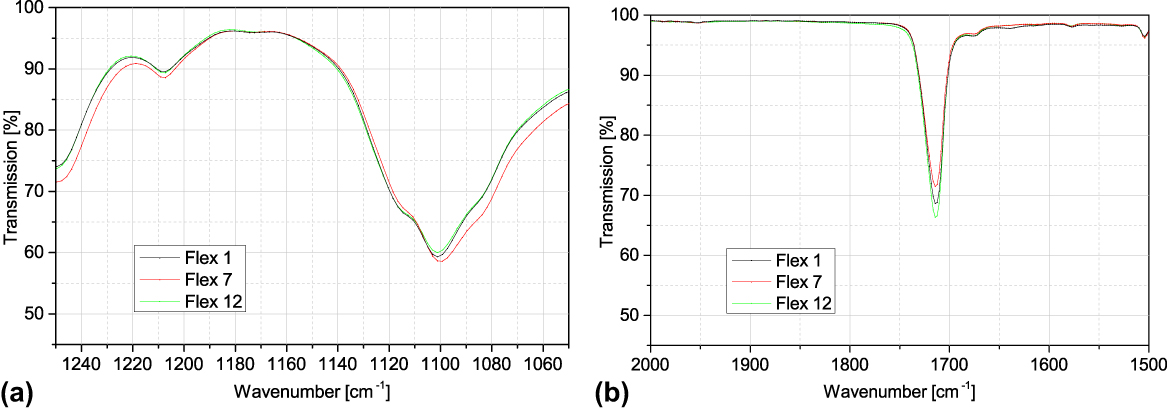
IR-spectrum of DF aging state 1, 7, and 12, (a) carbon–oxygen stretching vibration (wave number 1150 to 1040 cm−1) and (b) the ester-bond (wave number around 1714 cm−1).
Figures 7(a) and 7(b) indicate the IR-spectrum for TPU aging states one to 14. In Fig. 7(a), the characteristic range for the C–O bond stretching vibration (1150–1040 cm−1) can be seen. Effects of oxidation would potentially affect this bond. Reference Hesse, Meier and Zeeh49,Reference Forrest50 Figure 7(b) shows the characteristic shoulder peak signal of the urethane bond between 1680 and 1750 cm−1 which for the ester-based TPUs is likely to be affected by hydrolysis. Reference Lattimer and Williams51–Reference Chapman, Rakiewicz-Nemeth, Swestock and Benrashid53 Both sections in Fig. 7 as well as the entire IR-spectrum of the TPU do not show shifts in their peaks in terms of changing wave numbers. The small shifts in transmission relative to the corresponding signals for the aging states do not allow any conclusions about chemical changes due to oxidation or thermal cracking and might rather be associated with the specific sample preparation (density of sample and pressure during sampling). In addition, the changes are not systematic in correlation to the aging steps 1 to 14.
Figures 8(a) and 8(b) show the results for the FTIR analysis of DF over its aging states one, seven, and 12. As the results for DF also do not show any systematic change over their aging cycles, they have only been tested up to aging state 12.
Again Fig. 8(a) shows the characteristic range for the C–O bond stretching vibration (1150–1040 cm−1) potentially affected by oxidation, whereas Fig. 8(b) depicts the single peak for the ester bond at around 1714 cm−1 which might show a shift in its wave number due to thermal cracking. The fact that no systematic change of the chemical bonds is present for both polymers over their aging states indicates that no new molecular structures or bonds emerge, so that in accordance to the IR-analysis and its measuring accuracy no chemical changes of the materials observed were detected.
C. Aging on powder scale
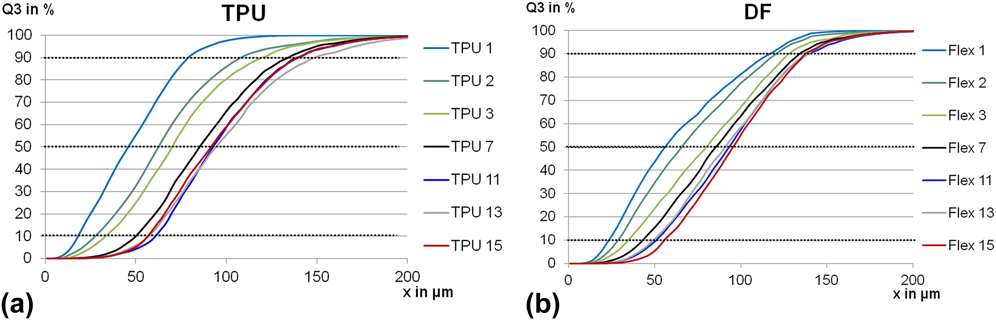
Thermoplastic elastomers have a lower softening temperature than semicrystalline polymers do, leading to the effect that they show a higher tendency to build out agglomerates in the PBF process compared to semicrystalline polymers. Reference Domininghaus, Elsner, Eyerer and Hirth43,Reference Sauer54 Thereby smaller particles start tacking at the larger ones and lead to a change in PSD also affecting the powders' behavior in terms of flowability and bulk density. Reference Fu, Huck, Makein, Armstrong, Willen and Freeman55,Reference Kaddar56 The change in PSD for the two materials studied is depicted in Figs. 9(a) and 9(b) over the aging cycles one to 15, whereby aging state one equals virgin powder and aging state 15 equals powder that was processed 14 times. For reasons of clarity and as the trend over the different samples was the same, not all aging states and their corresponding curves are shown. The most significant shift in PSD took place between the first and the seventh aging state; this shift attenuated between states seven and 15 where no significant shifts could be observed after aging state 11 for both TPEs. The amount of small particles was reduced significantly while the share of large-sized grains increased. All samples have been taken from a previously sieved and tumbled bulk before being passed through a chute riffler ensuring representative samples. Therefore, the shifts in PSD can be related back to agglomeration that took place throughout the processing cycles as smaller particles adhered to larger ones.
Cumulative PSD based on volume for (a) TPU and (b) DF.
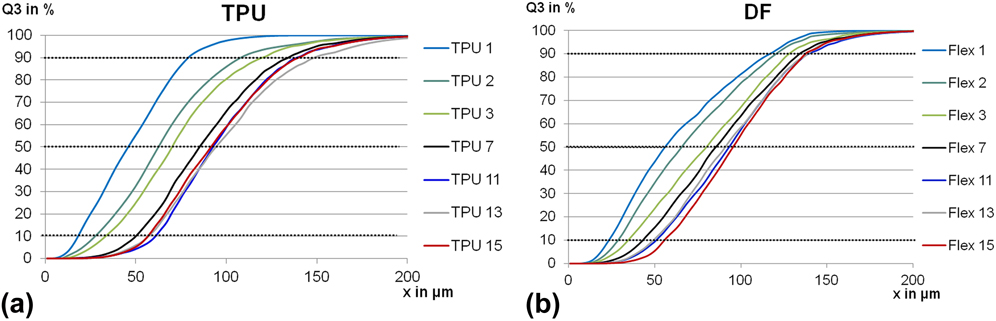
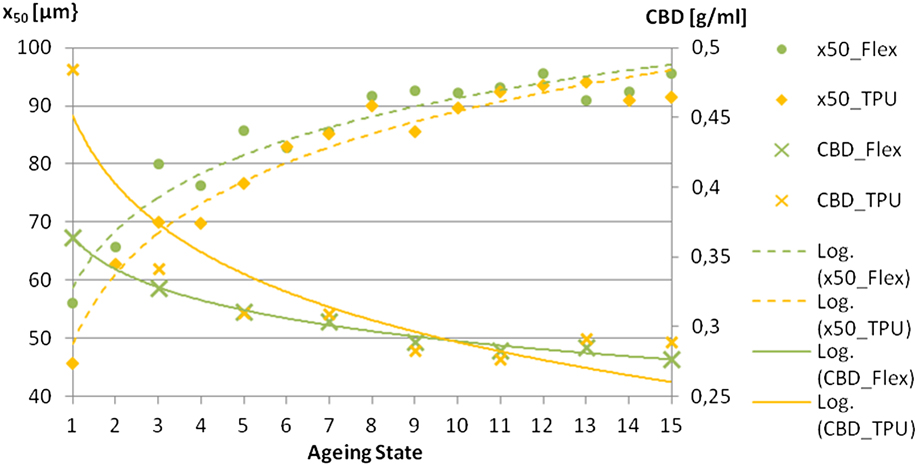
Figure 10 shows the change in medium grain size (X 50) as well as the change in CBD over the aging states one (virgin) to 15 for both powders. It can be seen that both materials showed a significant increase in the medium particle size that went hand in hand with a drop in CBD (for TPU approximately 30% from virgin to the first aging cycle).
Correlation of change in medium grain size and CBD.
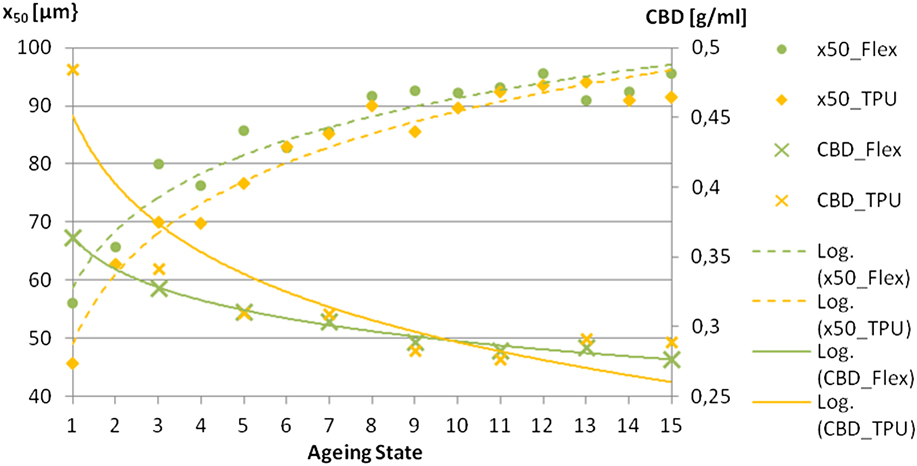
As described in Sec. III. A, this drop in CBD and therefore the real bulk density inside the feeds of the LS-system led to a short feed for the TPU build cycle eight. The maximum change in CBD for the TPU was much higher than it was for the DF. While the feeders still supplied a constant volume of powder (they were feeding a fixed distance in the z-direction) for the next layer to be applied, this reduction in powder density brought forth a reduced mass that was not sufficient to cover the whole build chamber.
IV. CONCLUSIONS
In this study, it was shown that with increasing processing cycles slight changes in molecular weight are present, indicating chain scission due to thermal stresses. This effect could be the reason for the enhanced flowability of the polymer melt and the reduced elongation at break that were observed. The significant decrease in bulk density as a result of changing PSD was expected to also affect the density of the sintered parts. However, the increased viscosity shown in the MVR results seems to be dominating this effect. It enables the parts to build out higher densities due to enhanced particle coalescence and formation of homogenous melt films. To make sure that this is an effect associated to the decreased viscosity, measurements on potential changes of the absorption coefficient with respect to the different aging states are going to be carried out. Nevertheless, the former experiments have shown that with decreasing powder bed density the absorption toward the CO2 laser decreases for both polymers observed. In any case, the significant drop in CBD present for the TPU has to be considered to guarantee a stable process and adjusting parameters regarding the powder supply. The results from IR-spectroscopy do not show systematic changes and therefore no chemical changes could be detected. Overall, the TPE materials showed good performance in terms of powder life and their reuse representing a promising type of polymer for LS.
ACKNOWLEDGMENTS
The authors gratefully acknowledge the support of Dr. Thomas Schauber of Freudenberg Forschungsdienste SE & Co. KG, who was responsible for the formulation of the TPU LS polymer and Dr. Michael Leitl BMW AG during the chemical analysis of the materials.