1. Introduction
The consensus of an extensive literature on the economic effects of new sports facilities is that new professional sports stadiums, and thus also the teams that play in them, have a rather small, and possibly negative, net effect on economic activity (Campbell, Reference Campbell1999; Siegfried & Zimbalist, Reference Siegfried and Zimbalist2000; Zimbalist, Reference Zimbalist2004; Coates, Reference Coates2007; Coates & Humphreys, Reference Coates and Humphreys2008; Coates, Reference Coates2015; Bradbury et al., Reference Bradbury, Coates and Humphreys2023).Footnote 1 In spite of this, local and state governments have consistently provided generous subsidies to professional teams that seem not to have credible financial needs (Alakshendra, Reference Alakshendra2016).
Table 1 shows the upward trend in construction costs and public subsidies between 1991 and 2020 in the four biggest professional leagues in the United States. During these three decades, 86 professional stadiums or arenas were built in the country, and the public sector contributed 45.7 % of their construction costs. In the last decade considered, between 2011 and 2020, 14 stadiums were built for professional teams, with an average cost of $1,527 million, 111 % higher than in the previous decade. During this last period, the public sector covered 33.1 % of the costs.Footnote 2 This share is lower than the 52.8 % covered in the two previous decades together, but the average subsidy per stadium continued to grow significantly, reaching an average of more than half a billion dollars per stadium. Part of these subsidies, Propheter (Reference Propheter2017) suggests, have just fueled unnecessary increases in “stadia’ opulence.”
Professional stadiums’ costs and share of the public burden

a The number of new stadiums for the “four leagues” is smaller than the sum of stadiums built in each of the four leagues due to duplications. There are eight cases (six in 1991–2000) in which NBA and NHL teams share the same arena.
Why do local and state governments continue to subsidize professional sports teams? Stadium advocates use different strategies to promote investment in professional stadiums in the local community. According to Delaney and Eckstein (Reference Delaney and Eckstein2003), stadium proponents seem to make “conscious strategic decisions” to justify the use of public funds in different cities. While at the beginning of the 1990s, the main strategy was based on very favorable, but methodologically flawed, economic impact studies focused on tangible benefits (Humphreys, Reference Humphreys, Andreff and Szymanski2006), later there was a shift to intangible benefits, which are more difficult to dispute. Delaney and Eckstein (Reference Delaney and Eckstein2003) suggest that, in part due to the unimpressive findings of the specialized literature, and to avoid contentious debates with “anti-subsidy forces” armed with less favorable academic studies, stadium advocates became less inclined to promise economic wonders and moved to emphasize intangible benefits like “community self-esteem” and “collective conscience.”
Intangible benefits can plausibly offer a valid justification for government subsidies. Owen (Reference Owen2003), for instance, argues that teams create a social value that cannot be fully captured through the teams’ operational revenue; but they can use the threat to move away (or not to move in) to demand subsidies from local governments. However, it is not clear that teams should fully own the social value they help to create, especially because that value also depends on other factors like public investments and the participation of the community. Moreover, the methodologies used to estimate the intangible benefits are imperfect, and most available studies (e.g., Johnson et al., Reference Johnson, Groothuis and Whitehead2001; Johnson et al., Reference Johnson, Mondello and Whitehead2007) conclude that intangible benefits are not high enough to provide a convincing justification for the degree of current public sector involvement.Footnote 3
This article contributes to the debate about public financing of stadiums by providing a clear account of the main benefits and costs associated with the construction (or renovation) of professional stadiums in the United States and integrating many of the insights provided by the literature into one cohesive framework. The need for this discussion comes from the great confusion that still exists on the topic, especially among taxpayers and policymakers. Unfortunately, both teams’ promoters and detractors have incentives to provide misguiding information that serve their own purposes (Delaney & Eckstein, Reference Delaney and Eckstein2003), and decision-makers in the public sector use “motivated reasoning” to justify policies that are not necessarily convenient for their communities (Rogers, Reference Rogers2020). There can also be problems with the quality of technical studies. Crompton (Reference Crompton1995), Coates and Humphreys (Reference Coates and Humphreys2008), and Farrow (Reference Farrow2013) warn about mistakes and malpractices in the preparation of economic impact reports, and in doing so provide some guidelines about how an “honest” cost–benefit analysis should be performed.
The main objectives are to better inform decision-makers and the public about the key variables that determine the overall economic impact of new stadiums and, in the same vein, to support the community outreach efforts that Rogers (Reference Rogers2020) urges scholars to make in order to guide and influence public policy decisions. The goal is to help local communities avoid the main sources of risks and losses associated with investing in professional stadiums.
Since the benefits and costs of a stadium and the team(s) playing in it are concomitant, the analysis informs equally about the benefits and costs of hosting a professional sports team. Using available data, this article estimates some of the main “average” effects and the net economic impact of hosting a professional sports team. The estimations are made for each of the four main professional leagues in the United States: Major League Baseball (MLB), National Basketball Association (NBA), National Football League (NFL), and National Hockey League (NHL).
The direct (tangible) net effects of professional teams on the local economy are found to be negative on average. In particular, attendance appears to have negative net effects in the four leagues (mostly due to substitution effects); ranging from average losses of almost $56 million per year (after accounting for multiplier effects) for NHL teams, to losses of $90 million per year for MLB teams. Since almost half of the professional teams’ revenue goes to players, and an important percentage of the remaining revenue is received by owners, the final effects of a team on the local economy depend critically on whether players and owners spend their income locally or not. After considering these factors, as well as the local spending by other team employees, the average negative effects on the local economy ranges from a loss of $20 million per year for NFL teams to a loss of more than $54 million for MLB teams. These losses may or may not be offset by the intangible benefits of hosting a team, and it is very likely that, in many cases, intangible benefits will not be enough to also offset the subsidies financed by the local communities.
Of course, costs and benefits will vary widely across cities and teams, and it is not possible to properly estimate the net effect of hosting a professional team without careful consideration of specific local conditions. Having said this, however, the negative net effects of average teams found in this article stand in striking contrast to the local economic gains described in studies used to promote the construction of new stadiums, and suggest that all cities evaluating the decision to host professional teams should carefully consider the factors that drive these results.
Negative net monetary effects on the local economy are expected to also have negative effects on employment. The reason is that professional teams concentrate a significant share of their revenue on very few high-income earners, while the sectors of the economy that suffer a revenue reduction due to professional games tend to employ many low-income earners. Consequently, the decision to host a team is generally associated with a worsening of local income inequalities, a consequential problem that is too often overlooked in the literature and public debates about professional teams’ relocations.
The rest of the article is structured as follows: Section 2 describes the analytical framework; Section 3 presents back-of-the-envelope estimations of the average economic effects of professional teams and stadiums on local economies; Section 4 concludes.
2. Analytical framework
This section identifies the main costs and benefits for a local economy of building a new professional sports stadium, or alternatively, investing in the renovation of an existing stadium. Since the effects of building (or renovating) a professional sports stadium are tightly intertwined with the effects of hosting a professional team, these two decisions can be seen as only one joint decision associated with a common set of benefits and costs. For this reason, from the perspective of the local community, all the benefits and costs to be described in this article can be associated indistinctively with both the presence of a team and the stadium where the team plays. The relevant counterfactual, or the situation with respect to which (changes of) benefits and costs are measured, is not to invest in a stadium and not host a professional team, which might mean either not to receive a new team in the city or let the current team leave.
There is a vast literature devoted to estimating the economic effects of large physical investments like stadiums, as well as less tangible benefits like the social value of teams. For example, Scandizzo and Pierleoni (Reference Scandizzo and Pierleoni2018) offer a complete list of benefits and costs and a summary of relevant valuation methods used in sports, although with a focus on the Olympics. For the purpose of this article, it is sufficient to distinguish Economic Impact Analysis (EIA) from Cost–Benefit Analysis (CBA). The former focuses on the effects on economic activity, usually measured in terms of the value of total local production and employment, and commonly based on assumptions about the size of multiplier effects. The latter also requires measuring these effects, but it usually puts more emphasis on the costs of the project, and in addition, attempts to estimate all unrealized (not monetized) welfare costs and benefits resulting from changes in the economic conditions.Footnote 4
Here we follow the more general CBA approach, although some of the traditional practices of CBA need to be adjusted in order to tailor the analysis to the specific circumstances of privately owned professional sports teams. For instance, professional teams are willing and able to monetize part of the welfare benefits they help to create, which implies that the methodology of CBA, originally designed to analyze public projects or investments, would tend to overstate the net benefits of a community hosting a professional team.
It is crucial to distinguish the different parties involved and their competing stakes in stadium projects. A revenue increase for a team may be publicized as evidence of economic success, but the actual economic impact on the local economy may well be negative. This point is clear for most (not all) economists, but less so for the general public. To clearly describe the economic impact of teams we need to identify the flows of revenue and expenditure between the team and the rest of the economy. To make those flows explicit, we consider three mutually exclusive perspectives:
-
(i) Team: the benefits received by the team are necessarily channeled through revenue, which will be the direct source of income for both team owners and players.
-
(ii) Local economy: consists of the community that hosts the stadium, which faces both tangible and intangible benefits and costs. Tangible benefits and costs may be subject to multiplier effects. For simplicity, we assume that the local economy corresponds to the benefit area and that this is the area where taxpayers contributing to the financing of the stadium reside.
-
(iii) Outside (national) economy: it is the part of the national economy that is immediately beyond the local economy. It also faces both tangible and intangible benefits and costs, but local authorities deciding whether to host a team or not can be expected to disregard those effects. Since the positive and negative effects of cities with teams tend to offset each other because teams distribute their games symmetrically, it can be useful to think about the national economy as having no other teams. Moreover, absent net national gains from a team’s relocation, national effects would balance out the sum of team and local effects.
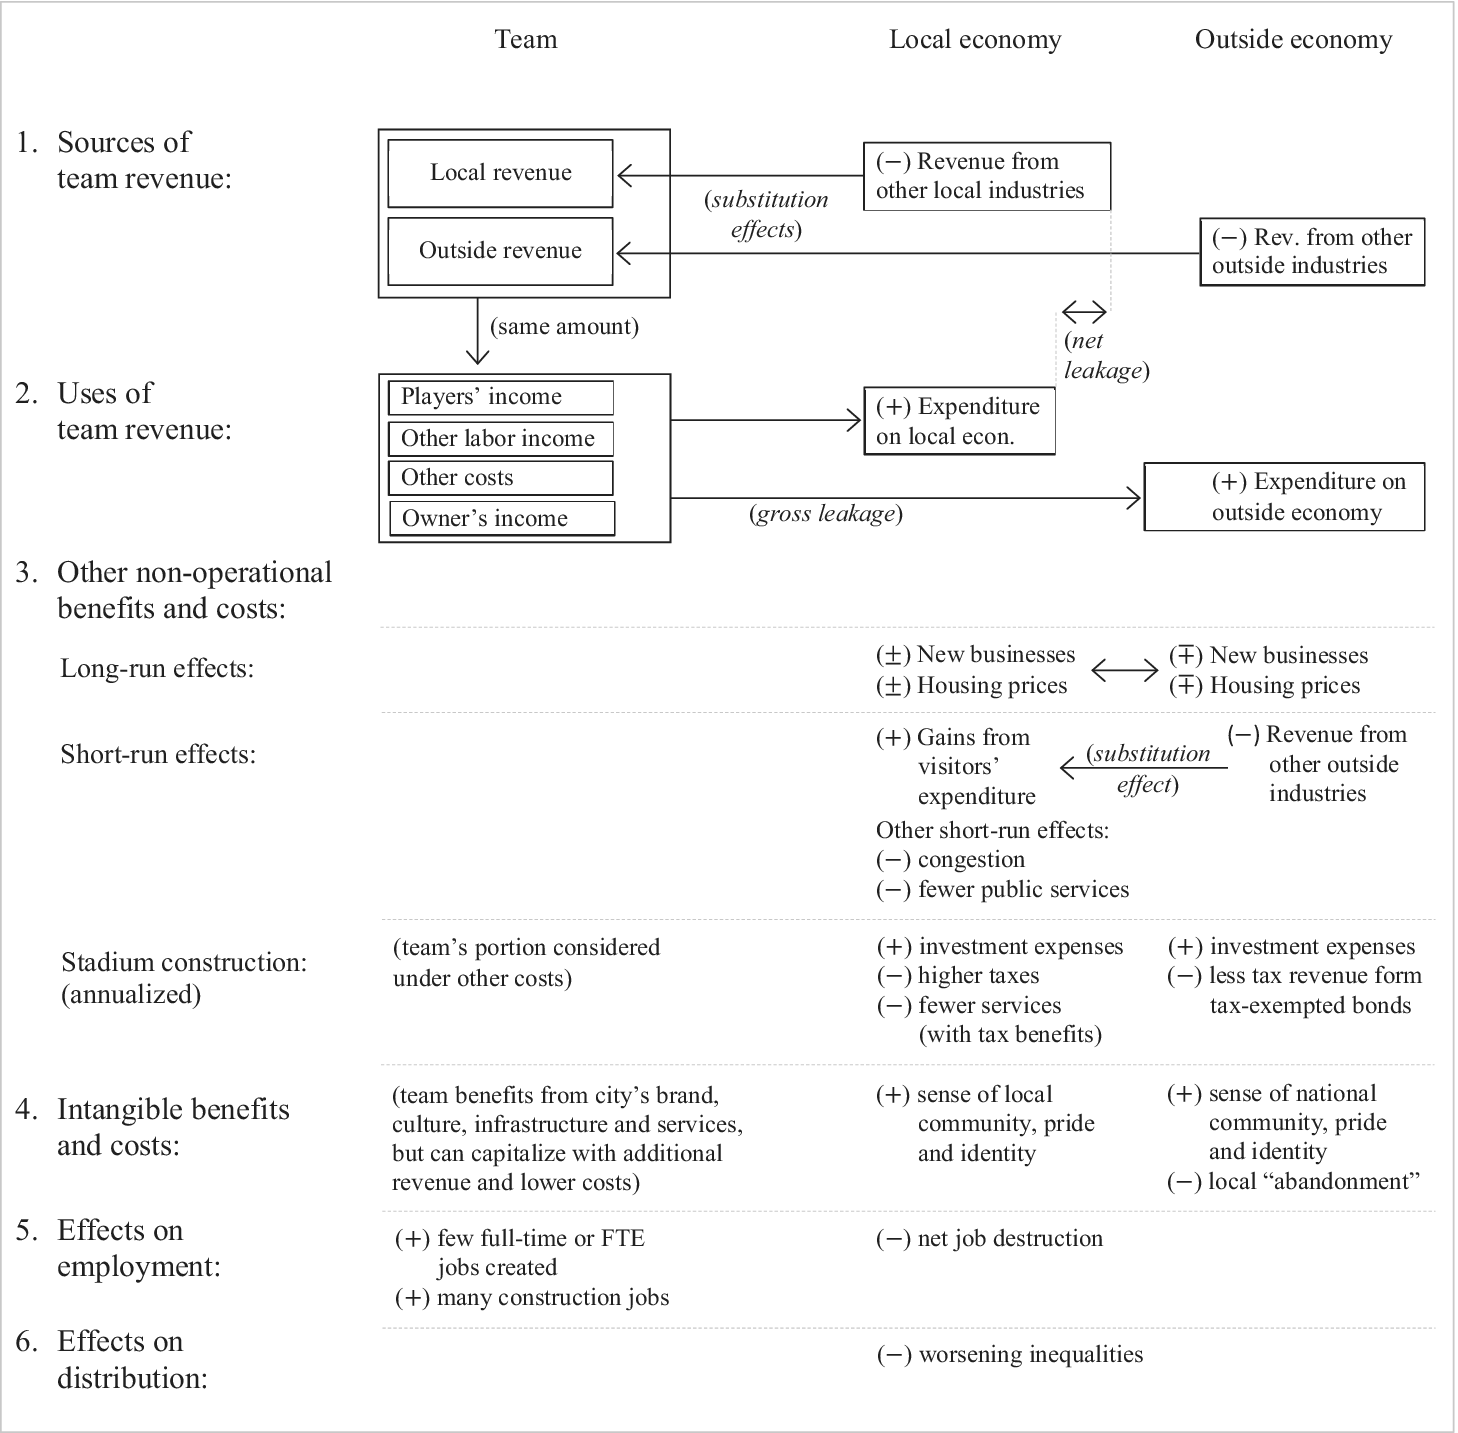
The analysis is here divided into six mutually exclusive categories (see Figure 1). The first three categories are sources of team revenue, uses of team revenue (team expenditure), and other (nonoperational) benefits and costs. These categories encompass the main tangible effects that teams and stadiums have on economic activity at the local and national levels. The fourth category is intangible benefits, which incorporates an important, albeit difficult to estimate, group of benefits for the local and national economies. In order to obtain the net gains or losses for the team, the local economy and the national economy in monetary terms, the estimations obtained for these four categories should simply be added at each level.
Benefits and costs of professional sports teams, local and outside (national) economies.

The fifth category consists of the effects on employment, which need to be presented separately because they are expressed in terms of full-time equivalent (FTE) jobs, not in monetary terms.Footnote 5 Finally, the sixth category is the effects on distribution, which identifies the winners and losers of investing in a stadium and hosting a sports team.
A complete CBA analysis should contain numerical estimations in each of these six categories. In contrast, a complete EIA normally excludes intangible benefits and the costs and effects of income distribution, and it is less clear about what benefits and costs are included, which in practice opens the door for less accurate estimations and has often led to an overestimation of net benefits (Taks et al., Reference Taks, Kesenne, Laurence Chalip and Martyn2011).
The rest of this section presents a more detailed discussion of each of the six categories, with a focus on the identification of the key sources of benefits and costs and some of the main insights provided in the specialized literature.
2.1. Sources of team revenue
Revenue is not created in a vacuum. The revenue received by the team comes either from within the local economy or from outside. Even when the presence of a team has a positive net effect on the local economy, the redistribution of revenue across sectors of the economy creates winners and losers. Identifying and quantifying the gains and losses of different sectors and groups of the local community is necessary to properly account for all the relevant economic effects of teams.
Revenues are grouped here into three categories: attendance, revenue sharing, and other revenue. Attendance revenue consists of ticket sales, concessions, parking fees, and so forth. Fans, and consumers in general, have limited budgets for entertainment, and when they decide to go to the stadium they could be implicitly deciding not to go to a restaurant, movie theater, or to spend their money on other local business. The revenue that a team obtains from residents of the local economy mostly corresponds to a reduction in revenue from other local industries. Sports games cannot significantly increase local economic activity if only local residents are attending the games; in that case, there would only be a transfer of revenue from other local industries to the team. This result, usually called the substitution effect, is widely acknowledged by economists and considered an important cost of hosting a team for the local economy (Siegfried & Zimbalist, Reference Siegfried and Zimbalist2000; Zimbalist, Reference Zimbalist2004).
Revenue-sharing systems differ from league to league, but they are all similar in their objectives and general effects.Footnote 6 Their main objective is to enhance competitive balance, and for this purpose, they usually transfer resources from teams in affluent economies to teams in less affluent economies. The MLB, the NBA, and the NFL share the national broadcast revenue equally across all teams, and the NFL is unique because it does not give individual teams control over local broadcasting rights. In addition, the national broadcasting deal of the NFL is the largest media contract in professional sports: Each NFL team received $347.3 million in 2022 as national revenue, which is 4.5 times the average amount of gate revenue in the league.Footnote 7 In other leagues, teams depend more heavily on local revenue, so there are greater disparities in revenue. Teams in bigger markets generally make more revenue (Bradbury, Reference Bradbury2019), and we expect this pattern to be partially offset by the revenue-sharing system. The expected sign of the revenue shared, therefore, will largely depend on the popularity of the team and the market where it plays.
Other revenue includes a variety of sources. Among the most common we find naming rights (which generally belong to the team regardless of the ownership of the stadium), the unshared portion of broadcasting rights, and licensing income. An important part of these revenue sources comes from outside the local economy and thus has no negative (substitution) effects on other local businesses. Their impact on the local economy will depend, instead, on how they are spent. That is the focus of the next subsection.
2.2. Uses of team revenue
Uses of teams’ revenue can be divided into players’ income, other workers’ income, other costs of operation, taxes, and owners’ income. Close to half of sports teams’ expenditure goes to the salaries of players; a relevant portion goes to other team member salaries (coaches, assistants, etc.), and another portion to full-time administrative positions and part-time workers hired in a per-game basis. Details about each team’s cost structure are not publicly available, as private companies are not required to disclose them; however, the Green Bay Packers’ Annual Reports provide some information about the composition of a franchise’s expenses: In the period 2018–2022, although excluding 2021 because the pandemic led to unusual changes in the financial structure that year, 52.4 % of Green Bay Packers expenses went to the players, 12.3 % to the rest of the team (coaches, team assistants, etc.), 14.5 % to sales and marketing, 6.7 % to stadium maintenance, and 14 % to administration costs.
Economists have for long recognized that a significant share of these resources can easily leak out from the local economy (Siegfried & Zimbalist, Reference Siegfried and Zimbalist2000; Zimbalist, Reference Zimbalist2004). The reason is that very few people (players, coaches, and owners) receive most of the team revenue and will likely spend it somewhere else. This is not a minor technical concern. If the amount of money that stays in the local economy is lower than the team proceeds from economic activity displaced due to the substitution effect, then there will be a continuous leakage of resources that will negatively affect local economic growth and development. In that case, a teams’ promise of development may turn only into a veiled redistribution of local residents’ income and wealth.
Zimbalist (Reference Zimbalist2004) describes three sources of leakages from players and owners’ incomes, which describe how part of the money paid to them can be expected to leave the local economy. The first source is federal taxes. Players and owners receive more than enough income to face the top marginal tax rate for federal taxes, currently at 37 %. Considering that the top marginal tax rate is not applied to the entirety of taxable income (the effective rate is lower than the top marginal rate), and an additional Medicare tax of 1.45 %, the percentage of revenue leaving the economy to pay federal taxes can be assumed to be around 37 %. The second source is given by the high percentage of high earners’ income that is either saved or invested, most likely in international financial markets or affluent economies inside or outside the country. Third, what is left for consumption is not fully spent locally. Players, owners, and their families do not necessarily live in the team’s area. Siegfried and Zimbalist (Reference Siegfried and Zimbalist2002) collected information about NBA players during the 1999–2000 season and found that only 29 % of the players had permanent residence in the city of the team.
Besides the players, other full-time workers include coaches, team assistants, and other “team” members, and administrative employees. Among them, coaches can receive very high salaries, but other full-time positions are more in line with the average salary in the country. Part-time workers include hundreds of workers hired for the games. Given the limited number of games per season and hours of work per game, part-time workers represent a relatively small number of FTE jobs.
Other operational expenditures can vary substantially depending on the stadium used, its ownership, and the business strategies of the team. For instance, 32.4 % of the maintenance costs of the Green Bay Packers stadium, the Lambeau Field, was covered in 2022 with lease-obligated contributions from the Brown County Professional Football Stadium District. In the case of publicly owned or publicly subsidized stadiums, it is common for teams and the local municipalities to reach agreements about rent payments, tax incentives, and the government contributions to operating, maintenance, and improvement costs (Zimbalist, Reference Zimbalist2011). Note that government contributions, as well as spending on public services in the area surrounding the stadium, would offset spending on other public services for the local community. Without knowing the specific circumstances, it is not clear what the sign of the economic effects of these operational expenditures will be.
Siegfried and Zimbalist (Reference Siegfried and Zimbalist2002) describe two additional sources of leakages related to other operational costs. Between 11 and 12 % of professional teams’ revenue may go to minor league teams, usually located in other cities, for players’ development. In addition, food sales at the stadium may also flow away toward the headquarters of the concessionaire company.
Teams are often expected to contribute to the economy (local or national) with significant tax payments. However, there are at least two reasons why this may not happen. One is that teams are routinely granted tax reductions and tax exemptions, for instance, in local property taxes applied to the stadium. Another reason is that professional sports teams enjoy special tax benefits due to the roster depreciation allowance (RDA), which currently allows them to depreciate close to the full market value of the team during a period of 15 years.Footnote 8 The practical effect of the RDA is that owners can drastically reduce the taxable income and avoid substantial state and federal tax payments.Footnote 9 As a result, team owners may be able to retain most of the operational profits of the team.
An important partial conclusion is that, if cities cannot make sure that a significant share of team expenditures will stay in the area, then they face the risk of draining local economic activity due to the redistribution of income caused by the team. In this line, Siegfried and Zimbalist (Reference Siegfried and Zimbalist2002) have already warned about the “unusually large” and “huge” leakages that sports expenditures can impose on the local economy.
2.3. Nonoperational benefits and costs (externalities)
The literature describes many nonoperational benefits and costs of teams and stadiums. This section is not intended to provide a comprehensive review of these benefits, but instead to identify the main externalities of professional stadiums and to place them in the broader context of our analytical framework.
We can distinguish the short-term from the long-term effects of stadiums. Short-term effects are associated with game attendance. If a game attracts visitors from other jurisdictions, then these visitors may also spend money on local restaurants, hotels, stores, and so forth, increasing net revenue in those sectors of the local economy. Of course, that additional revenue will likely mean that other jurisdictions are suffering a revenue loss. Especially around the stadium, attendance can also produce negative externalities in the form of congestion, littering, and in some cases, property damage.
Long-term effects are related to economic development, the housing market, and the construction of a new stadium. According to available empirical studies, the long-term effects on other sectors of the local economy are rather mixed. For instance, Dehring et al. (Reference Dehring, Depken and Ward2007) found that the Dallas Cowboy’s announcement in 2001 that the team might move to Dallas downtown had a positive effect on property values in that area, but a negative effect in property values in Dallas County, where taxes were going to increase to pay for the stadium. Once the proposal was abandoned, these effects were reversed. Harger et al. (Reference Harger, Humphreys and Ross2016) analyze 12 U.S. cities between 2002 and 2005 and find no evidence that new professional stadiums increase the number of new businesses openings. Feng and Humphreys (Reference Feng and Humphreys2012) consider all the facilities used in the four main professional sports leagues in the country and find positive effects on housing value within a 5 miles radius. Comparable positive effects are found by Tu (Reference Tu2005) for the case of the FedEx Field, and in Feng and Humphreys (Reference Feng and Humphreys2018) for the case of two sports facilities in Columbus, Ohio. However, Humphreys and Nowak (Reference Humphreys and Nowak2017) conclude that the presence of a professional team stadium “is not the most important factor” explaining increases in housing values, and that games can even have a negative impact on property value due to disamenities in the form of congestion, noise, trash, and so forth.
The literature on minor baseball leagues provides additional insights. Van Holm (Reference van Holm2019) finds that minor league baseball stadiums can help to revitalize a city’s downtown, but at the expense of other areas that are held back. He concludes that stadiums result in a concentration of redevelopment, not in greater economic growth. Agha (Reference Agha2013) suggests that, in some minor baseball leagues, teams are starting to have positive effects on per capita income.
All in all, the effects of professional sports stadiums on long-term economic development depend on a complex array of factors and seem to vary widely on a case-by-case basis. Stadiums can be part of successful development and redevelopment plans, but by themselves are expected to have a small effect on the local economy (Zimbalist, Reference Zimbalist2004).
Other long-term effects depend on the funding arrangements reached between teams and local governments. Alakshendra (Reference Alakshendra2016) and Drukker et al. (Reference Drukker, Gayer and Gold2020) describe the extent and characteristics of public subsidies. A number of financial schemes (e.g., tax-exempted bonds, interest-free loans, tax rebates, subsidies) are used to provide assistance to the teams, and several tax instruments (mainly sales tax, excise taxes, hotel tax, car rental tax, and ticket or admission tax) are used to collect the public funds.Footnote 10 The greater the public contributions, the greater the annual costs for the community and, most likely, the longer the community will be bearing that burden, either in the form of higher taxes or fewer public services.
2.4. Intangible benefits
Intangible effects include several nonmonetary, mostly subjective (even psychological) effects that the presence of a team may have on the community. Although difficult to measure, we should not underestimate their importance and value, and stadium advocates rightly claim that they need to be considered when evaluating the contributions of a team to the local economy (Delaney & Eckstein, Reference Delaney and Eckstein2003, pp. 21–24). Among the main sources of intangible benefits of teams, we can count community pride and self-esteem, and a sense of identity and collective conscience.
Estimations of intangible benefits are meant to inform about the value of nonmarket goods. It follows that any portion of intangible benefits that teams are able to monetize through the market goods they produce should be subtracted from the estimation of the intangible benefits of the local economy; otherwise, the same benefit would be assigned to both the team and the community. This is important because intangible benefits like community pride and self-esteem can be partially monetized in the prices paid for tickets and other goods sold by the team.
Owen (Reference Owen2003, Reference Owen2006) argues that it is important and correct to consider the intangible benefits when evaluating the economic impact of teams and stadiums on the local economy, because public subsidies can be understood as payments for the “unrealized social value of the team.” According to the argument in the previous paragraph, however, only a limited share of the intangible benefits may correspond to unrealized social value.
Moreover, it is not entirely clear that professional teams and leagues should claim for themselves the unrealized social value of professional sports. The same as the city and even the country can gain from a team because of the intangible benefits it creates, the team also depends on the local and national economies, as well as on the enthusiasm of fans, to be profitable, increase its own value, and contribute to the creation of intangible benefits for society. For instance, Bradbury (Reference Bradbury2019) finds that the amount of revenue received by a team depends on the size of the market in which it plays, and not so much on its own performance, and Ehrlich and Potter (Reference Ehrlich and Potter2023) conclude that even a team’s “home advantage” depends on the presence (although not the quantity) of fans in attendance. The social value is created together between the teams, the fans, and the government; but only the teams have the power and will to capitalize those benefits.
Intangible benefits need not be a zero-sum game, as benefits can be enjoyed locally, at the national level, and even internationally. Naturally, however, in the case of relocations, the intangible effects may be negative for that city being left by the team, where fans may experience a “sense of abandonment,” and may not change much (if at all) in the country as a whole.
In general, there is no reason to expect that a team will not try to obtain subsidies in an amount higher to its unrealized social value, or that subsidies in that amount would induce the team to make socially optimal decisions.
2.5. Effects on employment
Teams usually claim to create a significant number of jobs. However, economists are well aware that the number of jobs created by teams can be small compared to the number of jobs lost when the team arrives in a city. The reason is that most of the salaries paid by the team go to a few players and coaches, and part of the revenue required to pay them comes from other industries in the local economy. As a reference, note that the average salary of a professional player, $4.6 million in 2022, could otherwise be used to pay 74.5 salaries of $61,900, which is the average salary of “all occupations” in the same year.Footnote 11
In the long run, we can expect the employment effects on the national economy to mirror the effects on the local economy; the city left by the team will likely see trends in the opposite direction than the city where the team is moving into. Other than a temporary increase in construction jobs if a new stadium is built, there is no a priori reason to expect a team that is relocating to change the number of workers hired for its operation.
2.6. Distributional effects
By adding up all the effects of teams and stadiums on the local (or national) economy from Sections 2.1–2.4, we obtain the key result that determines whether having the team in the area justifies the public subsidy or not. A positive net benefit implies that this “project” is worthwhile, and a negative net benefit implies that it is not. Although this is arguably the most relevant result in a cost–benefit analysis, it does not inform about the distributional effects of hosting a professional team. Distributional effects are not quantifiable in monetary terms because we cannot compare welfare across individuals.Footnote 12 But distributional effects are real, and communities do have (at least implicitly) preferences about them. For this reason, it is important to identify the winners and losers in the local economy and to assess the extent of income inequalities created by hosting a professional team. Unfortunately, even though economists realize that the presence of professional teams can negatively affect income distribution in the local economy (Zimbalist, Reference Zimbalist2004), the impacts of stadiums and professional teams (and sports events in general) on the distribution of income remain critically under-researched (Potter, Reference Potter2016).
3. Economic impact of an “average” professional sports team
This section presents back-of-the-envelope “average” estimations of the economic effects on a local economy of hosting a professional sports team in each of the four biggest major leagues in the United States. Even though the average effects are not directly applicable to any specific case, they can be considered as a relevant reference to most cities evaluating the decision of hosting a professional sports team, and the illustration can help identify the key determinants of net economic effects.
To have some perspective about the magnitudes of the economic flows channeled through the professional sports industry, it is helpful to know about the basic structure of teams’ revenues and costs. Table 2 presents average figures per team in 2022, for each major league.
Revenue and cost structure for average teams in the U.S. (in 2022 US$ million)

a Revenue from tickets sales; includes club seats.
b Includes revenue sharing, unshared broadcasting rights and licensing income, concessions, stadium naming rights, and so forth.
c Net of stadium revenues used for debt payments.
d Includes benefits and bonuses.
e Computed as total revenue – player expenses – operating income.
f Earnings before interest, taxes, depreciation, and amortization, EBITDA (net of stadium debt service).
3.1. Attendance and multiplier effects
We focus first on the economic impact of attendance, which includes the substitution effects associated with gate revenue, as well as the inflow of new spending on other local businesses by the visitors attracted to the games. The estimations are presented in Table 3. According to Siegfried and Zimbalist (Reference Siegfried and Zimbalist2000), visitors represent between 5 and 20 % of attendance. Here we assume, rather optimistically, that 15 % of gate revenue comes from visitors. Assuming also that local spending by residents remains constant, this implies that 85 % of gate revenue is being displaced from other local businesses. From the perspective of the local economy, the money moved away from local businesses is a loss, and thus it is presented with a negative sign in row (2).
Economic impact of attendance for average teams in the U.S. (in 2022 US$ million)

Note: Assumptions and relevant references by row: (2) 85 % of gate revenue from local fans (revenue lost by local businesses). Based on Siegfried and Zimbalist (Reference Siegfried and Zimbalist2000); (3) 15 % of gate revenue from visitors. Based on Siegfried and Zimbalist (Reference Siegfried and Zimbalist2000); (4) Gate revenue by visitors corresponds to 36 % of visitors spending (2018 estimate). Source: U.S. Travel Association. https://www.ustravel.org/system/files/media_root/document/2019_Sports-Travel_07.11.19.pdf. In order to obtain the formula for (4), define
 $ x $
= “gate receipts from visitors” and
 $ y $
= “total spending by visitors,” and note that, according to the U.S. Travel Association,
 $ x=0.36\;y $
, or
 $ y=x/0.36 $
. We want to estimate the gain for the (rest of the) local economy, which is equal to
 $ -x=\frac{x}{0.36}-x=\frac{0.64}{0.36}x $
; (6) Multiplier assumed equal to 1.5.
The other 15 % of gate revenue is received by the team (row 3) and has no direct effect on the local economy; however, the visitors providing that revenue do spend money on the local economy. Bradbury et al. (Reference Bradbury, Coates and Humphreys2023) provide a broad review of recent studies about the effects of teams on the local economy, and conclude that “when positive effects exist, they occur very close to venues, within 1 or 2 miles, and in sectors closely related to sports consumption (e.g., food and beverage).”Footnote 13 For simplicity, and based on an estimate of the U.S. Travel Association for 2018, here we consider that, on average, 36 % of visitors’ sports travel spending goes to sports events. We can use this figure to estimate the total amount spent by visitors in the area and thus also the amount received by other local businesses (row 4).
The net effect of attendance on the local economy (row 5) corresponds to the sum of the substitution effect (row 2) and the gain of other businesses in the local economy (row 4). The total economic impact on the local economy should consider also the indirect and induced effects of this spending, which will not be realized because the money has left the area. Simply put, indirect effects correspond to the additional economic activity created at the level of input providers, and the induced effects to the economic activity created by the additional income earned by workers in the area. These two effects lead to what economists call the multiplier effect. A change in local spending is multiplied by a factor whose value varies widely in accordance with economic conditions.
It is important to note that in this case the amount to be multiplied (row 5) is a net loss, and thus the multiplier can be interpreted as a magnification of that negative effect. The concept of “negative multiplier effect” is not novel. For instance, Siegfried and Zimbalist (Reference Siegfried and Zimbalist2000, p. 104) explain that reductions in per capita income are “consistent with a higher (negative) multiplier for the displaced leisure expenditures than for the expenditures on a new team or in a new stadium,” and Bradbury (Reference Bradbury2022, p. 211) suggests that the activity associated with professional sports “may crowd out other industries with higher multipliers, ultimately reducing overall economic activity.”
More generally, multipliers are applied to positive changes in spending and have positive values (usually between 1 and 2) that vary widely across industries and locations.Footnote 14 Unfortunately, multipliers are difficult to understand and sometimes not properly used. A common “mistake” is not to account for substitution effects or offsets (Bess & Ambargis, Reference Bess and Ambargis2011). In addition, consulting firms preparing studies to support the promotion of new stadiums “almost inevitably adopt unrealistic assumptions regarding local value-added, new spending, and associated multipliers” (Siegfried & Zimbalist, Reference Siegfried and Zimbalist2000, p. 103), while their reports suffer from a “long list of methodological and theoretical problems” (Coates & Humphreys, Reference Coates and Humphreys2008) and “are notorious for over‐exaggerating the new spending that would actually occur as a result of the building of a new arena, ballpark, or stadium” (Rosentraub & Zondlak, Reference Rosentraub and Zondlak2016).
In the estimation of the multiplied effect of attendance in Table 3 (and the rest of this section), it is assumed that the value of the multiplier is 1.5. The justification for this value is the expectation that some of the local spending being crowded out use local resources intensively (e.g., some local restaurants and bars); the spending lost on these activities is associated with relatively high multiplier effects that also need to be subtracted to account for all the losses of the local economy.Footnote 15
The estimated economic impact of attendance is shown in row (6). The average teams from all leagues appear to create losses for the local economy each year. Since the assumptions used are similar across leagues, the level of annual losses is correlated with the level of gate revenue, which is systematically higher in the MLB due to the greater number of games played per season.Footnote 16
3.2. Gross and net leakages
The net effects of attendance would improve (or become less negative) if teams put more money back into the local economy. However, it is not possible to guarantee that professional (for-profit) teams will generally do that. Even though other sources of revenue are much greater than gate revenue across the four leagues (see Table 2), and teams may need to assume significant operating costs, nothing prevents them from buying and hiring services in other areas. Indeed, economists have warned about the several ways in which the team can channel resources away from the local economy.
First, we estimate the leakages from players’ income. Following Siegfried and Zimbalist (Reference Siegfried and Zimbalist2002), we can estimate the share of players income that is expected to be spent locally based on the percentage of players that reside in the city of the team, denoted by
 $ R $
, the effective income tax rate
 $ t $
that they face, the percentage of their disposable income that they do not save –their marginal propensity to consume
 $ MPC $
, and the percentage of consumption on “imports”
 $ M $
, or goods not from the jurisdiction (e.g., travel, online shopping). The percentage of players’ income actually spent locally is given by
 $ R\times \left(1-t\right)\times MPC\times \left(1-M\right) $
. Using the main finding of Siegfried and Zimbalist (Reference Siegfried and Zimbalist2002),
 $ R= $
29 %, an effective tax rate
 $ t= $
37 %, and the two additional assumptions they made in Siegfried and Zimbalist (Reference Siegfried and Zimbalist2000),
 $ MPC= $
66.6 % and
 $ M= $
50 %,Footnote
17 the percentage of players’ income spent locally is 6 %.
Table 4 presents the results. The expected first-round spending by players on the local economy is shown in row (2), and the total amount leaked from players’ income is shown in row (3). We cannot yet interpret these leakages as losses to the local economies because players’ incomes are not fully financed with local resources. However, the leakage does show that local economies, on average, do not gain much from players’ income. As a reference, note that the amounts in row (2) are all smaller than the losses from attendance shown in row (5) of Table 3. When considered together in row (4) of Table 4, the average teams in the four leagues continue to have negative net effects on the local economy. The average baseball team appears to impose the greatest net loss, and the average football team the smallest. Moreover, these negative effects can be expected to be magnified due to multiplier effects.
Leakages from players’ incomes for average teams in the U.S. (in 2022 US$ million)

Note: Assumptions and/or sources by row: (2) Based on Siegfried and Zimbalist’s (Reference Siegfried and Zimbalist2000) assumptions, the percentage of players’ income spent locally is assumed to be 6 %; (5) Multiplier assumed equal to 1.5.
In addition, we can also expect a share of the owners’ income to leave the local economy. There are many factors determining the owners’ spending decisions, but little information to make reliable estimations. In the professional sports industry, the RDA helps owners retain a significant share of teams’ earnings before interest, taxes, depreciation, and amortization (EBITDA).
Table 5 provides estimations of the average owner’s income per league, and the effect of owners’ expenses on net leakages from the local economy. The RDA allows owners to amortize almost the entire market value of the team (row 1), for a period of 15 years. Since losses can be carried on, however, the amortization period can in practice be extended. Row (2) shows the average length of ownership, or the average number of years that teams in each league have been owned by the 2022 owner. Row (3) provides the average amortization amount per year of ownership. In the cases of the MLB, the NBA, and the NHL, that amount is significantly higher than the EBITDA (row 4), which suggests that, on average, income in these leagues is not taxable during the average ownership period. In practice, of course, some income will still be taxable, but here we will assume that federal taxes in these leagues are zero. This is equivalent to assuming, rather optimistically from the point of view of the local economy, that all the money that would leave the local economy in the form of federal taxes, remains instead in the hands of the teams’ owners. Only in the case of the NFL there is a positive (and thus taxable) difference between the EBITDA and the amortization per year. Using a corporate income tax rate of 21 %, the expected average tax payments per year are those reported in row (6). Assuming for simplicity that interest expenses are zero, the estimated owners’ income is given by row (7).Footnote 18
Leakages from owners’ incomes for average teams in the U.S. (in 2022 US$ million)

Note: Assumptions and/or sources by row: (1) Source: Forbes; (2) Based on data from Sports Facility Reports, National Sports Law Institute of Marquette University Law School (July, August 2020); (4) Source: Forbes; (6) 21 % tax rate applied on EBITDA in excess to team value amortization; (8) Assumption: Owners spend 6 % of their income locally; (10) The net “cumulative” leakage is adding the owners’ income spent locally to the net leakage obtained with players’ expenditure; (11) Multiplier assumed equal to 1.5.
The portion of owners’ income spent locally cannot be estimated reliably with (the lack of) available information, but proceeding with an assumption will be useful to understand the impact that owners’ spending decisions can have on net local leakages. In principle, there is no reason to expect individual owners to spend more on the local economy than the players. Owners will likely not need to move to the area of the stadium, and in those cases in which they already live there, their local expenses will not represent a net gain for the local economy. For these reasons, here we also assume that 6 % of their income from the team will be available to offset part of the leakage. In that scenario, the NFL is the league with the smallest average net leakage, and it is possible that for some teams in this league, the sum of expenses by players and owners ($14.7 and $8.6 million on average, respectively) could exceed the net effect of attendance in the local economy ($44.6 million on average according to Table 3), and thus turn the net effect on the local economy into a positive number. For this to happen, it is necessary that players and owners spend a significant amount of their disposable income in the area.
This analysis leads to three key (partial) conclusions. One is that revenue from attendance is owned exclusively by teams, and by no means can be used as a measure of local economic gains. The second is that the estimation of the economic impact of professional teams must be informed by realistic estimates of the number of visitors that will be attracted, as well as their expected expenses in the local economy. The third is the importance of players and owners spending decisions; the net economic effect of hosting a professional sports franchise on the local economy will critically depend on the spending decisions of few high-income individuals.
Of course, each case is different, and we cannot claim that hosting a team will necessarily lead to net losses (or gains) for the local economy. However, it seems safe to say that, if conditions are not given for players and owners to spend locally, then the presence of a professional sports franchise will likely have a negative effect on local economic activity. For instance, if owners take all their money away from the host cities, then the expected net and total loss of economic activity will be given, respectively, by rows (4) and (5) in Table 4. These conclusions are consistent with the specialized literature, but unfortunately, these aspects of the problem can be difficult to quantify and are rarely discussed in the press or by political actors.
Different than players and owners, other full- and part-time employees of professional teams can be expected to spend a significant share of their income in the local economy. This additional spending will have positive effects on local economic activity and further reduce the size of the net leakages. An estimation of that spending and the final net leakages is presented below in Section 3.5, immediately after the estimation of the number of jobs created by professional sports teams.
3.3. Other monetary benefits and costs
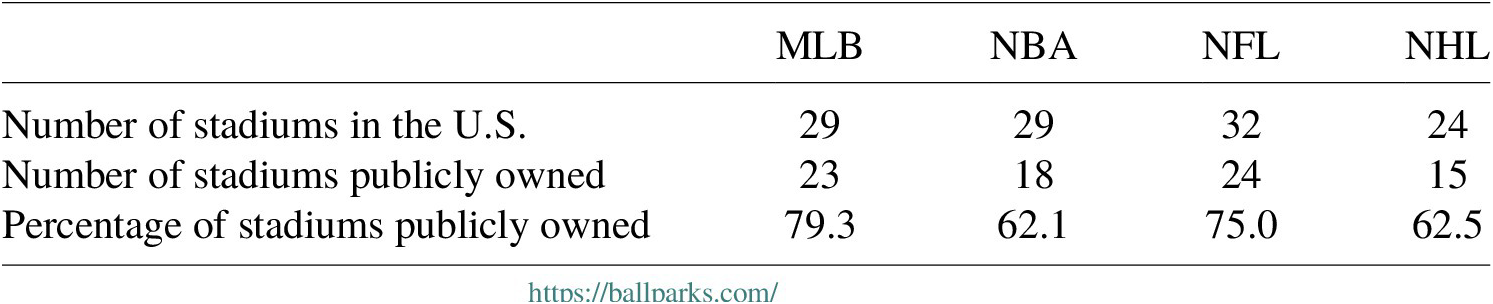
There are several other sources of benefits and costs that can be incorporated into the analysis. This subsection provides a brief overview of them but does not produce average estimations because they can vary too widely across cities. One of the main reasons explaining this variability is that stadiums can either be owned by a team, in which case all operational costs are likely borne by that team, or can also be owned by a local or state government, in which case the government may be able to receive revenue from the team and other events performed at the stadium. Table 6 shows the percentage of stadiums owned by the public sector, usually represented by a city or county government, but in some cases district and state governments or other agencies (e.g., Sports or Stadium Authority) that are involved in the ownership. In the four major leagues considered, the public sector owns most of the stadiums.
Public versus private ownership

From the perspective of the local economy, we can classify the other sources of benefits and costs in three categories: significant, potentially significant, and insignificant.
The most significant source of benefits and costs is the construction of the stadium. Among the benefits, construction spending will most likely have a positive and significant impact on local economic activity. As a reference, considering an average population of 1.2 million and a GDP per capita of $78,425, the average size of the local economy can be estimated at $94.1 billion.Footnote 19 Also considering the average stadium cost of $1,494 million between 2011 and 2020, and assuming that such a stadium is built in 2 years, then the construction phase may result in an inflow of money equivalent to 0.8 % of the local economy during each of the 2 years, which may be augmented by the multiplier effect.Footnote 20 Among the costs of construction, we can consider the portion of spending financed by local taxpayers, which will vary greatly depending on the magnitude of the investment and the extent of the public subsidies.
Potentially significant sources of benefits and costs depend on the specific agreements reached between governments and teams. While private stadiums are owned by teams, and often receive benefits in the form of financial subsidies (e.g., with tax-exempted municipal bonds), tax rebates, or public spending on services and development, public stadiums are used by teams under very different circumstances, and in some cases can provide local governments with significant additional revenue. The following are some items that deserve special attention:
-
(i) Annual rent: If the stadium is publicly owned, then the leasing arrangement will determine the stream of payments to the relevant government authority. There is no standard practice about the amount to be paid. In the NFL, for instance, the average annual rent among 23 public facilities in 2017 was around $2.9 million; with a maximum annual payment of $24.5 million by the San Francisco 49ers for the use of the Levi’s Stadium, two teams paying nothing for the use of a public stadium (Baltimore Ravens and Cincinnati Bengals), and the New Orleans Saints even being paid $6 million yearly for playing at the Mercedes-Benz Superdome.Footnote 21
-
(ii) Revenue from other events: Concerts and other events can bring additional revenue to local governments when the stadium is publicly owned. This can be an important source of revenue for the government, but it can vary considerably in accordance with the location of the venue, the number and type of events that are hosted, and the specific leasing arrangements with the team(s). In the case of playoff games, the attendance effects described previously (in Section 3.1) will likely be magnified.
-
(iii) Other costs: The local government may have to cover, partially or fully, the operational costs of the stadium, and may have to provide costly public services to the stadium and the area around it. Disruptions to the transportation system during the construction phase and during games may also lead to high costs for the government and the community.
It is important to recognize that all these sources of benefits and costs must be considered jointly. An apparently good deal for the city in the form of, for instance, a high rent per year, can easily be offset by the operational costs assumed by the local government or by the public services provided to the stadium.
Insignificant sources of benefits and costs are given by items that, even if large, cannot be expected to have a relevant effect on the local economy. One example is naming rights, which are very visible because they are responsible for associating well-known commercial brands to the stadium and the teams. As of agreements in place in 2019, naming rights of arenas (used by NBA and NHL teams) ranged from $0 to $17.5 million and averaged $4.95 million per year. Naming rights of stadiums (used by MLB and NFL teams) ranged from $0 to $30 million, and averaged $6.88 million per year.Footnote 22 Nevertheless, naming rights are usually received entirely by the teams, and therefore are irrelevant for the local economy. Only in few cases, naming rights revenue is used to pay for part of the stadium construction costs, implying that the revenue is being indirectly used to finance spending in the local economy during the construction phase.
3.4. Intangible benefits
A recent but growing literature has applied the contingent valuation method (CVM) to estimate the value of intangible benefits from stadiums, which are sometimes referred to as the “surplus” or the “public goods” created by teams.Footnote 23 For instance, Johnson et al. (Reference Johnson, Groothuis and Whitehead2001) analyzed the case of an NHL team, Owen (Reference Owen2006) the case of professional sports teams in Michigan and Minnesota, and Johnson et al. (Reference Johnson, Mondello and Whitehead2007) the case of an NBA team. The results of these studies suggest that the value of intangible benefits is significant; but in most cases lower than the public subsidies provided. There are also studies reaching the opposite conclusion. For instance, Fenn and Crooker (Reference Fenn and Crooker2009) estimated the welfare contribution by the Vikings to households in Minnesota under a credible threat of relocation. The authors argued that the credibility of this threat made the surveys more reliable and estimated that the welfare contribution (ranging from $445.3 to $1,571.3 million) could be significantly superior to the cost of a new stadium (between $450 and $500 million).
Overall, the body of empirical evidence accumulated suggests that intangible benefits exist and could justify a certain level of public subsidies, but also that “the total social benefits tend to be far less than typical subsidies provided for new facility construction projects” (Bradbury et al., Reference Bradbury, Coates and Humphreys2023, p. 22).
The value of intangible benefits will likely not be enough to also compensate the local community for the possible losses suffered due to net leakages. As explained, it is important to consider net intangible benefits, as opposed to total intangible benefits. Intangible benefits lost with the activity displaced by the team should be subtracted from the total intangible benefits associated with the team. In addition, if the team is able to monetize part of the benefits that the community receives in the form of pride or sense of belonging (by selling team’s jerseys or more expensive team gear, for instance), that part should also be subtracted.Footnote 24 Estimations of intangible benefits are not included here because they can vary substantially across cases, and it is not clear how available estimates should be adjusted to fit with the cost–benefit framework presented in the article.
3.5. Effects on employment and final net leakage
Employment effects are measured in terms of the number of jobs created or destroyed, not in monetary terms, and without much regard for the level of income per worker. The objective is to identify the number of people directly affected by changes in economic conditions. This section focuses on jobs created during the regular operation of teams; jobs created during the construction phase of stadiums are excluded because, although relevant, are temporary and do not necessarily have long-term impacts on the local economy.
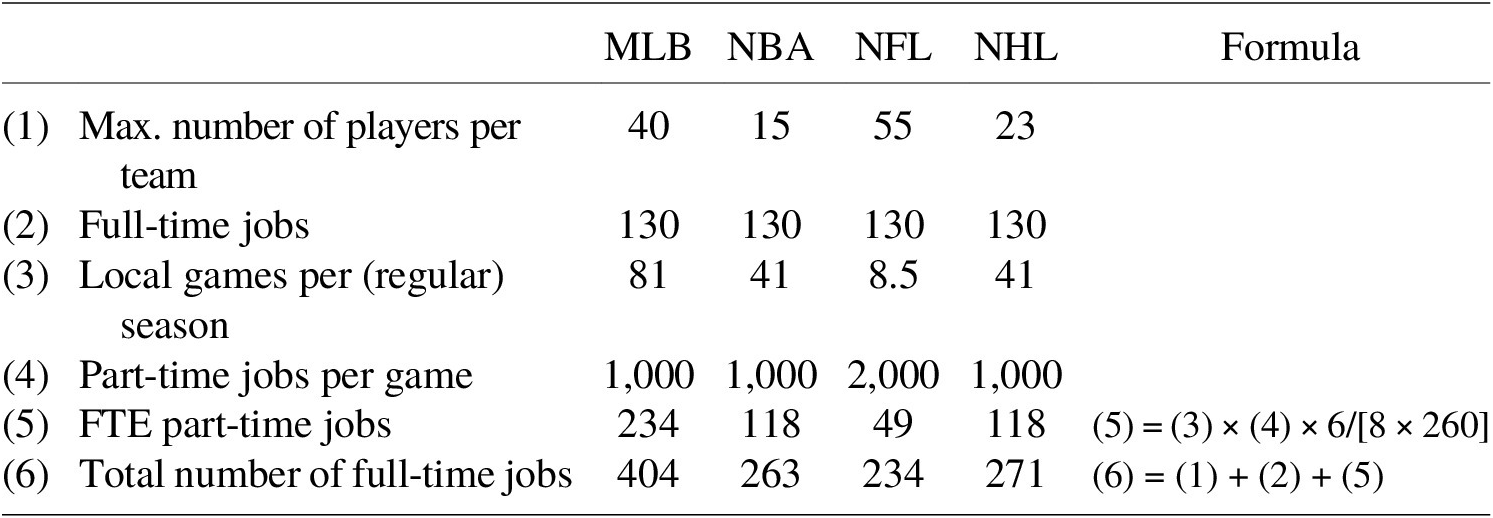
The number of jobs created by the presence of teams is relatively low. Generally, there are few individuals earning very high incomes, including players, coaches, and owners. According to Siegfried and Zimbalist (Reference Siegfried and Zimbalist2000), teams typically employ 70–130 workers on a full-time basis and 1,000–1,500 workers for part-time, day-of-game, low-wage positions. Table 7 provides estimations for the average number of jobs created per team in each of the four major leagues. The assumptions are rather “optimistic” and consider the maximum number of players per team (row 1); 130 additional full-time jobs per team; 1,000 part-time jobs per game in the MLB, NBA, and NHL, and 2,000 in the NFL (due to consistently higher attendance per game and additional amenities and services provided in newer stadiums). In order to find the FTE number of jobs associated with the part-time hires, it is assumed that these workers are paid for 6 hours of work each day-of-game, and that a full-time job consists of 8 hours of work for 260 days.
Job creation

Note: Assumptions and/or sources by row: (2) and (4) Assumption based on Siegfried and Zimbalist (Reference Siegfried and Zimbalist2000). The number of part-time jobs by game in the NFL has been assumed to be higher than the maximum suggested by Siegfried and Zimbalist (Reference Siegfried and Zimbalist2000) because of the additional amenities and services provided in newer stadiums; (5) Assumptions: Each PT worker is paid for 6 hours of work per game; a FTE job consists of 260 working days of 8 hours each.
The total number of jobs created by the average teams ranges from 234 in the NFL, to 404 in the MLB. The main driver of the differences is the number of games played in each regular season.
Other than players and coaches, the jobs created by a team can be expected to be mostly low- or middle-income jobs given to local residents. Table 8 presents an estimation of the income that remains in the area because these workers spend part of their income locally. For simplicity, we assume that they spend (after taxes, savings, etc.) 80 % of their income locally; that the annual income of the 130 full-time jobs created by an average team corresponds to the average salary of “all occupations” in 2022, equal to $61,900; and that the FTE part-time jobs are paid at $16.50 per hour.Footnote 25 Provided that a full-time job has been assumed to consist of 8 hours per day and 260 days per year, each FTE part-time job is associated with an annual income of $34,320.
Local spending by employees and final net leakage (in 2022 US$ million)

Note: Assumptions and/or sources by row: (1) Full-time employees receive the average salary for “all occupations” in the U.S. in 2022, equal to $61,900 (Source: Occupation Employment Statistics, BLS); (2) Part-time employees are assumed to receive $16.50 per hour. An FTE job consists of 260 working days of 8 hours each; (5) Multiplier assumed equal to 1.5.
Under the assumptions, the four leagues appear to leak resources away from the local economy. The MLB leaks the greatest amount of money, $36.2 million on average per year, and thus has the greatest negative impact on local economic activity, $54.3 million per year. In contrast, the NFL leaks the smallest amount of money, $13.6 million per year, and thus leads to the smallest negative impact on local economic activity, $20.4 million per year. The average losses are positively correlated with the number of games played in each league.
Table 9 provides estimations for the average number of jobs destroyed by the presence of professional teams. The main source of employment losses is the reduction of revenue in other sectors of the economy. The revenue reductions in other sectors can be measured under alternative scenarios. Here we consider five scenarios. Separately, they can be interpreted as different sets of plausible assumptions; combined, they describe different stages of influence that a team can have on local labor markets. The first scenario (S1) considers the substitution effect of attendance, which measures the direct negative impact of the team on other local industries. The second scenario (S2) corresponds to the net effect of attendance, obtained by considering the substitution effects, together with the contributions of visitors to the local economy and their multiplier effect on the local economy. The third scenario (S3) adds the positive effects of players’ spending (assumed equal to 6 % of their income), the fourth scenario (S4) incorporates the positive effects of owners’ spending (assumed also at 6 % of their income from the team), and the fifth scenario (S5) incorporates the positive effects of other employees’ spending.
Job destruction per year

Abbreviations: E, Employees (full- and part-time); O, Owners; P, Players.
a The average salary for “all occupations” in the U.S. in 2022 was $61,900 (Source: Occupation Employment Statistics, BLS).
b The average salary for “waiters and waitresses” in the U.S. in 2022 was $33,020 (Source: BLS).
The negative effects on employment are calculated as the number of workers that could be hired with the monetary changes in economic activity. As relevant references, we consider the average salary of “all occupations” and “waiters and waitresses” in 2022, equal to $61,900 and $33,020, respectively.Footnote 26
For the four major leagues, the job losses are far greater than the job gains reported in Table 7, implying that the net effects on employment can be expected to be negative. For instance, the substitution effect that reduces revenue in other sectors of the economy, like other entertaining services, or restaurants and bars located far from the stadium, can be better represented by row (S1.b), which shows the number of waiters and waitresses that can be paid to with the revenue transferred from these sectors to the team. An average MLB team appears to have a negative net effect of 2,258 jobs (404 jobs created vs. 2,662 jobs destroyed), and the minimum net loss, equal to 1,371 jobs, is associated with the average NHL team.
The results are sensitive to the underlying assumptions, and specific conditions of each host city will likely lead to great differences in the employment effects of hosting a professional team. In line with previous conclusions (in Section 3.2), if cities cannot expect the high-income earners of teams to spend their income locally, then a professional sports franchise can have a significant negative effect on the local labor market.
3.6. Distributional effects
As explained, it is not possible to obtain monetary measures of the distributional effects of hosting a professional team, but it is nonetheless important to identify the winners and losers.
Specific demographic and economic characteristics of the host city will ultimately determine the distributional effects. However, the scenarios used previously to estimate the extent of job losses can help identify the groups of workers that could be impacted in negative and positive ways. Scenario 1 (S1) identifies those workers in sectors that compete with games’ attendance, like restaurants, bars, and retail stores far from the stadium, movies theaters, and so forth. These sectors tend to employ unskilled workers at low wages, many of whom may lose their jobs after the arrival of a new team. The second scenario (S2) also considers the local gains from visitors spending and the multiplier effects that would be spread around the local economy. The additional workers affected under S2 need not be in the same sectors as the ones affected in S1. It would be interesting to know what are the sectors (and geographical areas) that would be hurt and those that would benefit from visitors’ spending and multipliers effects. The next three scenarios (S3–S5) incorporate the positive effects of local spending by players, owners, and other employees, respectively. It seems reasonable to expect that high earners individuals (players and owners) will tend to consume more luxurious goods and services than the average resident (e.g., luxury restaurants, financial advisers, lawyers), which will tend to concentrate the benefits of their spending in higher earners. If this were the case, the estimations of jobs destroyed under S3–S5 would underestimate the number of jobs lost at lower income levels, and income inequalities could be expected to worsen even further.
Besides the likely negative effect on low-wage jobs, and possibly the positive effect on high-wage jobs, economists have identified other ways in which the presence of a professional team could increase income inequalities. Zimbalist (Reference Zimbalist2004), for instance, highlights the use of regressive tax instruments, like the sales tax, to finance public subsidies for stadium construction.
Overall, there are convincing reasons to expect relevant negative effects on the distribution of income in the local economy. This, surprisingly, seems to be one of the most significant and inescapable effects of the presence of a professional team in an economy, but at the same time the most overlooked. It seems that, in the words of Potter (Reference Potter2016), economists have not done justice to the impact of teams on inequality.
4. Conclusions
This article describes a simple framework to perform a cost–benefit analysis of hosting a professional sports team in the U.S., or alternatively, fully or partially financing the construction or the renovation of a stadium for that team. Back-of-the-envelope calculations of the effects of an “average” professional team or stadium on the local economy inform about the order of magnitude of the key variables at play.
The results obtained are in line with the available literature and can be summarized in the following four conclusions. First, attendance is associated with a substitution effect that has, on average, sizable negative economic impacts on local economies in the four major leagues. Second, considering all income sources, as well as different “leakages” described in the literature and “reasonable” assumptions about players and owners’ spending in the local economy, teams in the four major leagues have, on average, negative (although not sizable) net effects on the local economy. Third, the effects on employment can be expected to be negative, and the loss of low-wage jobs can be substantial. Fourth, provided that low-wage workers lose a significant number of jobs and that most of the income of the team is distributed among very few high-income earners, the presence of a professional sports team can be expected to have a negative effect on the distribution of income.
Naturally, these conclusions cannot be assumed to apply to all hosting cities, as actual conditions vary widely. A precise estimation of the net impacts of professional teams on economic activity, employment, and income distribution, must be performed in a case-by-case fashion. Nevertheless, the results contrast with the large positive effects commonly shown in Economic Impact Analyses prepared to support the construction of new stadiums, and call for caution while evaluating the decision to host a professional sports team. Every city should carefully estimate the gains in economic activity during the construction (or renovation) phase of the stadium and the intangible benefits received by the local community, and then compare those gains with the expected costs of displacing local businesses, net job losses, and the worsening of income inequality, before determining the amount of public subsidies to be provided.
The academic literature has been warning for decades about the small and possibly negative economic effects of hosting professional sports teams. In retrospect, it appears that these warnings have been ineffective, as cities continue to provide generous subsidies and seem not to be properly assessing the benefits and costs of hosting professional sports teams. Maybe an area in which future research can help improve these public policy decisions is the measurement of indicators that have been shown to be relevant in determining the size of the substitution effects and net leakages affecting host cities. For instance, it would be helpful to generate better data about the number of visitors attracted to professional games and their spending patterns; the number of players and owners that live around the stadium and how much they spend in the local economy; the share of teams’ revenue that comes from the local economy and an identification of the businesses and workers that are more affected by the revenue losses. More reliable data about these variables could hopefully be used to prepare customized projections of net economic impact of professional teams and inform decision-makers and the public in advance about possible net effects on local businesses, employment, and the distribution of income.
Acknowledgments
I am grateful to Joel Potter, Brandli Stitzel, Michael Toma, and two anonymous referees for very useful comments and suggestions.
Competing interest
The author declares no competing interests.