




No CrossRef data available.
Article contents
Bad data equals bad policy: how to trust estimates of ecosystem loss when there is so much uncertainty?
Published online by Cambridge University Press: 14 March 2011
Summary
Scientific evidence will be better incorporated into conservation action and environmental policy if it is deemed credible by decision-makers. However, huge uncertainties are inherent in large-scale ecosystem statistics. Two wetland case studies relating to mangrove areal extent in Peninsular Malaysia and saltmarsh loss in the UK indicate the major causes of information uncertainty, relating to poor methodological description, traceability and assumptions associated with the use of grey literature. Furthermore, potentially inaccurate information can be propagated throughout the research community and gain ‘proof by assertion’, especially if the information originates from an authoritative source. Researchers must better consider implicit and explicit uncertainty and be critical of secondary information. Future information production requires the use of rigorous peer-reviewed methodologies in order to decrease and quantify error. Such steps will increase the credibility of scientific evidence, so researchers can better contribute to a two-way science and policy deliberation approach.
Information
- Type
- Comment
- Information
- Copyright
- Copyright © Foundation for Environmental Conservation 2011
References
Airoldi, L. & Beck, M.W. (2007) Loss, status and trends for coastal marine habitats of Europe. Oceanography and Marine Biology: an Annual Review 45: 345–405.Google Scholar
Alongi, D. (2002) Present state and future of the World's mangrove forests. Environmental Conservation 29: 331–349.CrossRefGoogle Scholar
Atkinson, P.W., Crooks, S., Drewitt, A., Grant, A., Rehfisch, M.M., Sharpe, J. & Tyas, C.J. (2004) Managed realignment in the UK: the first 5 years of colonisation by birds. Ibis 146: 101–110.CrossRefGoogle Scholar
Badley, J. & Allcorn, R.I. (2006) Changes in bird use following the managed realignment at Freiston Shore RSPB reserve, Lincolnshire, England. Conservation Evidence 3: 102–105.Google Scholar
Carwardine, J., Klein, C.J., Wilson, K.A., Pressey, R.L. & Possingham, H.P. (2009) Hitting the target and missing the point: target-based conservation planning in context. Conservation Letters 2: 3–10.CrossRefGoogle Scholar
Cash, D.W., Clark, W.C., Alcock, F., Dickson, N.M., Eckley, N., Guston, D.H., Jäger, J. & Mitchell, R.B. (2003) Knowledge systems for sustainable development. Proceedings of the National Academy of Sciences USA 100: 8086–8091.CrossRefGoogle ScholarPubMed
Chong, V.C. (2006) Sustainable utilisation and management of mangrove ecosystems of Malaysia. Aquatic Ecosystem Health and Management 9: 249–260.CrossRefGoogle Scholar
Ellison, A.M., Farnsworth, E. & Merkt, R.E. (1999) Origins of mangrove ecosystems and the mangrove biodiversity anomaly. Global Ecology and Biogeography 8: 95–115.CrossRefGoogle Scholar
FAO (2007) Mangroves of Asia 1980–2005. Forest Resources Assessment Programme, Working Paper 137. Food and Agriculture Organisation.Google Scholar
Giri, C., Zhu, Z., Tieszen, L.L., Singh, A., Gillette, S. & Kelmelis, J.A. (2008) Mangrove forest distribution (1975–2005) of the tsunami-affected region of Asia. Journal of Biogeography 35: 519–528.CrossRefGoogle Scholar
Giri, C., Ochieng, E., Tieszen, L.L., Zhu, Z., Singh, A., Loveland, T., Masek, J. & Duke, N. (2011) Status and distribution of mangrove forests of the World using earth observation satellite data. Global Ecology and Biogeography 20: 154–159.CrossRefGoogle Scholar
Grainger, A. (1996) An evaluation of the FAO Tropical Forest Resource Assessment, 1990. The Geographical Journal 162: 73–79.CrossRefGoogle Scholar
Grainger, A. (2008) Difficulties in tracking the long-term global trend in tropical forest area. Proceedings of the National Academy of Sciences USA 105: 818–823.CrossRefGoogle ScholarPubMed
Hannaford, J., Pinn, E.H. & Diaz, A. (2006) The impact of Sika Deer grazing on the vegetation and fauna of Arne saltmarsh. Marine Pollution Bulletin 53: 56–62.CrossRefGoogle Scholar
JNCC (2007) Second report by the UK under Article 17 on the Implementation of the Habitats Directive from January 2001 to December 2006. Joint Nature Conservation Committee, Peterborough, UK [www document]. URL http://www.jncc.gov.uk/article16Google Scholar
Jusoff, K. & Taha, D.H. (2008) Managing sustainable mangrove forests in Peninsular Malaysia. Journal of Sustainable Development 1: 88–96.Google Scholar
IPCC (2001) Working Group II Report: Impacts, Adaptation and Vulnerability. Contribution to the Third Assessment Report of the Intergovernmental Panel on Climate Change. Cambridge, UK: Cambridge University Press.Google Scholar
Loneragan, N.R., Ahmed Adnam, N., Connolly, R.M. & Manson, F.J. (2005) Prawn landings and their relationship with the extent of mangroves and shallow waters in western Peninsular Malaysia. Estuarine, Coastal and Shelf Science 63: 187–200.CrossRefGoogle Scholar
Mather, A. (2005) Assessing the world's forests. Global Environmental Change 15: 267–280.CrossRefGoogle Scholar
Meiszkowska, N. (2010) Intertidal habitats and ecology. In: MCCIP Annual Report Card 2010–11. Marine Climate Change Impacts Partnership [www document]. URL http://www.mccip.org.uk/media/7562/mccip-report-2010–2011.pdfGoogle Scholar
Möller, I. (2006) Quantifying saltmarsh vegetation and its effect on wave height dissipation: results from a UK east coast saltmarsh. Estuarine, Coastal and Shelf Science 69: 337–351.CrossRefGoogle Scholar
Northern Ireland Environment Agency (2005) Northern Ireland Habitat Plan: Coastal Saltmarsh. Northern Ireland Environment Agency, Department of Environment [www document]. URL http://www.doeni.gov.uk/niea/coastalsaltmarsh_pdf.pdfGoogle Scholar
Page, S.E., Rieley, J.O. & Banks, C.J. (2010) Global and regional importance of the tropical peatland carbon pool. Global Change Biology doi: 10.1111/j.1365-2486.2010.02279.xCrossRefGoogle Scholar
Pilcher, R., Burston, P., Kindleysides, D. & Davis, R. (2002) Seas of Change: the Potential Area for Inter-tidal Habitat Creation around the Coast of Mainland Britain. Sandy, UK: Royal Society for the Protection of Birds.Google Scholar
Pontee, N.I., Drummond, J.R. & Morrisey, D.J. (2004) Coastline change and implications for habitat loss. Proceedings of the Institution of Civil Engineers. Maritime Engineering 157: 133–142.CrossRefGoogle Scholar
Rands, M.R., Adams, W.M., Bennun, L., Butchart, S.H., Clements, A., Coomes, D., Entwhistle, A., Hodge, I., Kapos, V., Scharlemann, J.P., Sutherland, W.J. & Vira, B. (2010) Biodiversity conservation: challenges beyond 2010. Science 329: 1298–1303.CrossRefGoogle ScholarPubMed
Riisgård, H.U. (2003) Misuse of the peer-review system: time for countermeasures? Marine Ecology Progress Series 258: 297–309.CrossRefGoogle Scholar
Ruiz-Luna, A., Acosta-Velázquez, J. & Berlanga-Robles, C.A. (2008) On the reliability of the data of the extent of mangroves: a case study in Mexico. Ocean and Coastal Management 51: 342–351.CrossRefGoogle Scholar
Spalding, M., Kainuma, M. & Collins, L. (2010) World Atlas of Mangroves. London, UK: Earthscan.CrossRefGoogle Scholar
Sutherland, W.J., Pullin, A.S., Dolman, P.M. & Knight, T.M. (2004) The need for evidence-based conservation. Trends in Ecology and Evolution 19: 305–308.CrossRefGoogle ScholarPubMed
UK Biodiversity Group (1999) UKBAP Tranche 2 Action Plans. Volume V: Maritime Species and Habitats. Peterborough, UK: UK Biodiversity Group.Google Scholar
Walters, B.B, Rönnbäck, P., Kovacs, J.M., Crona, B., Hussain, S.A., Badola, R., Primavera, J.H., Barbier, E. & Dahdouh-Guebas, F. (2008) Ethnobiology, socio-economics and management of mangrove forests: a review. Aquatic Botany 89: 220–236.CrossRefGoogle Scholar
Watson, R.T. (2005) Turning science into policy: challenges and experiences from the science-policy interface. Philosophical Transactions of the Royal Society B 360: 471–477.CrossRefGoogle ScholarPubMed
Zedler, J.B. & Kercher, S. (2005) Wetland resources: status, trends, ecosystem services and restorability. Annual Review of Environmental Resources 30: 39–74.CrossRefGoogle Scholar
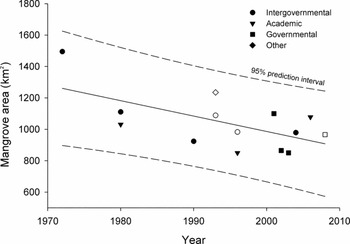
Figure 1 Estimates of mangrove area in Peninsular Malaysia. ‘Date’ refers to the known or assumed date of the data. Filled symbol = year known, source not given. Open symbol = year assumed. Note that not one data point has a verifiable method associated with its collection (see text).
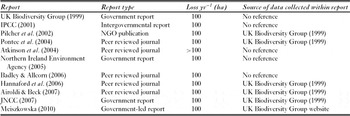
Table 1 Estimates of saltmarsh loss in the UK, ranked by year. Note that the UK Biodiversity Group (1999) is the basis for the saltmarsh habitat action plan. This table does not include the large number of local government reports using the figure of 100 ha yr−1. IPCC = Intergovernmental Panel on Climate Change, JNCC = Joint Nature Conservation Committee, NGO = non-governmental organization.

Friess Supplementary Material
Friess Supplementary Summary

File
27.1 KB
 You have
Access
- 39
- Cited by
Information uncertainty arising from poor data analysis (model selection, poor source checking and propagation) is inherent in many scientific estimates. The accuracy of estimates is important to gauge because it is this information that forms the scientific contribution to ‘evidence-based policy’. It has been argued that conservation policy is most successful when informed by a robust knowledge base to create targeted instruments (Rands et al. Reference Rands, Adams, Bennun, Butchart, Clements, Coomes, Entwhistle, Hodge, Kapos, Scharlemann, Sutherland and Vira2010). However, many conservation decisions are not based on scientific input, due in part to poor evidence availability or lack of trust in evidence and its providers. Instead, policy makers may base decisions on ‘anecdotal sources or myth-based beliefs’ (Sutherland et al. Reference Sutherland, Pullin, Dolman and Knight2004). If researchers are to increase the utility of scientific assessments for evidence-based policy, the information provided must be transparent, legitimate and technically accurate in order to provide plausible and evidence-based scenarios for decision-makers (Watson Reference Watson2005). Legislation and activities not based on robust and verifiable information run a significant risk of failure by setting inappropriate goals. Target-based conservation is common and should be ‘transparent, simple to convey and allow conservation progress to be measured’ (Carwardine et al. Reference Carwardine, Klein, Wilson, Pressey and Possingham2009). But how can targets be transparent or measurable if the information upon which they are based is not? Credible information is crucial to the policy-making process.
Lack of robust data is a hindrance to the accurate analysis of many ecosystems, such as terrestrial forest, where national and global-level forest cover trends can be notoriously unreliable (Mather Reference Mather2005). Indeed, it is argued that the accepted paradigm of global tropical forest decline is difficult to demonstrate convincingly because of such uncertainty (Grainger Reference Grainger2008). Similarly, accurate estimates and trend analyses are critical for viable conservation strategies of wetland ecosystems, which exist in harsh, constantly fluctuating environments and experience complex drivers of change (such as hydrodynamic forcing, sediment starvation and sea level rise) that are not experienced by other ecosystems. We identified huge uncertainty within published baselines of coastal wetland coverage and change in both tropical and temperate regions, and recognize four major barriers to reducing uncertainty in wetland area information:
(1) Lack of robust methodology to calculate estimates,
(2) Poor traceability of secondary estimates,
(3) Significant assumptions of data and information quality, and
(4) Propagation of potentially flawed estimates from perceived authorities.
This article has three aims: first to discuss the causes of information uncertainty outlined above, second to indicate how such uncertainty can be propagated through a research community, and third to identify two main actions that could achieve rapid improvements in historical and future data analyses to more effectively contribute to evidence-based conservation policy.
Although uncertainty in area estimates exists for all ecosystems, we used examples from coastal wetlands to highlight the four sources of error described above. We chose coastal wetlands because of the critical ecosystem services they provide, and their expected ease of identification. Coastal wetlands contribute a wide range of essential socioeconomic and ecosystem services, such as timber and non-timber forest products for local communities and the support of fisheries (Walters et al. Reference Walters, Rönnbäck, Kovacs, Crona, Hussain, Badola, Primavera, Barbier and Dahdouh-Guebas2008). Wetlands also perform an important coastal defence function through the attenuation of hydrodynamic energy (see for example Möller Reference Möller2006) and will play an important role in coastal management with future sea level rise. Despite their importance, coastal wetlands are experiencing long-term and severe decline (Alongi Reference Alongi2002; Zedler & Kercher Reference Zedler and Kercher2005), which is expected to increase with combined anthropogenic pressures and accelerated sea level rise. Information must be accurate if (inter)national agreements and conservation strategies to countermand their loss are to be effective. Furthermore, coastal wetlands are relatively easy to identify by remote survey (Spalding et al. Reference Spalding, Kainuma and Collins2010) compared to other ecosystem types. Coastal wetlands are often linear, spatially constrained to the intertidal zone (i.e. are easy to locate), may be separated from other ecosystems by topographic or artificial barriers, and have a recognizable spectral reflectance owing to relatively homogeneous structure and low species diversity. Therefore, our discussion revolves around an ecosystem that should provide highly tractable estimates, and thus a conservative estimate of errors compared to analyses of upland systems. Nevertheless, the uncertainty we document in wetland statistics highlights general issues applicable to a range of ecosystems.
Robustness and traceability in mangrove statistics
South-east Asia is the global centre of mangrove diversity (Ellison et al. Reference Ellison, Farnsworth and Merkt1999), and mangroves are receiving increased attention as a highly threatened ecosystem. Quantifying mangrove loss requires accurate historical statistics; however recent analysis revealed that trends can show varying degrees of loss, or even positive trends depending upon which particular data points are chosen (Ruiz-Luna et al. Reference Ruiz-Luna, Acosta-Velázquez and Berlanga-Robles2008). We conducted a literature search for mangrove cover estimates for Peninsular Malaysia, through Web of Science and Google Scholar. By plotting all published estimates, we found that overall the land cover analyses (and therefore change estimates) exhibited a substantial lack of agreement (Fig. 1).
Estimates of mangrove area in Peninsular Malaysia. ‘Date’ refers to the known or assumed date of the data. Filled symbol = year known, source not given. Open symbol = year assumed. Note that not one data point has a verifiable method associated with its collection (see text).
While the results suggest a negative temporal trend in Peninsular Malaysia's mangrove cover (Fig. 1), the high variation in the point distribution within and among years creates a wide prediction interval. The wide variability in estimates leads to high levels of uncertainty. A review of the literature and analysis of the documents providing the data revealed three principle causes of uncertainty:
(1) Lack of robust methodology: much of the data was published in the grey literature and government documents, and no single data point (Fig. 1) had an explicitly described methodology for its calculation. The volume of grey literature for tropical ecosystems may equal that of peer-reviewed material (Corlett Reference Corlett2011), but frequently lacks sufficient (or any) description of robust methodology.
(2) Lack of traceability: all data points are based on secondary data with highly limited traceability or accessibility, which is a generally acknowledged problem for grey literature (Corlett Reference Corlett2011). Indeed, two data points were taken from a newspaper article quoting a government report, which we were unable to locate. Interestingly, two studies were peer-reviewed, but used secondary data where the source was not mentioned (Jusoff & Taha Reference Jusoff and Taha2008) or the data were acquired via personal communication (Loneragan et al. Reference Loneragan, Ahmed Adnam, Connolly and Manson2005).
(3) Data assumptions: the studies we examined relied on implicit and explicit assumptions. For example, only 82.6% of Peninsular Malaysia's mangroves are controlled by the Forestry Department (data from Chong Reference Chong2006), and many land cover estimates were based on this area only. None of the data points identified this fact, indicating that significant error remains undisclosed. An explicit assumption in several of the data points taken from the Food and Agriculture Organization of the United Nations (FAO 2007) was that the publication date of the ‘original’ cover estimate was assumed to be equivalent to the year of analysis. Even when this error is articulated, researchers may still use statistics of land cover change based on an unverifiable temporal axis.
These three points raise serious concerns about estimates of mangrove cover, and hence derived change calculations. It is impossible to check original source validity, or calculate meaningful error estimates to help policy makers ascertain the level of confidence in the analyses. This inability to eliminate flawed or erroneous data points results in high levels of uncertainty. Even if forestry authorities wanted to craft ‘no net loss’ policies, they would be hard pressed to find robust data upon which to base verification. The greatest concern is, if accepted, unverifiable or false estimates can be propagated through the literature.
Propagation of untraceable results: the case of saltmarsh loss
The fourth barrier to improving information quality is the propagation of unverifiable information. Such a barrier can be seen in the saltmarsh literature of the UK, a country that has lost more than half of its saltmarsh cover since the Roman era (Airoldi & Beck Reference Airoldi and Beck2007). European Union (EU) member countries must specify habitat loss rates under the EU Habitats Directive (92/43/EEC), which dictates that there must be no net loss of habitat within designated areas, and which provides legislative enforcement measures to ensure adequate habitat compensation. Data underpinning the statutory habitat targets must therefore be accurate and verifiable.
The UK has implemented its legislative obligations in part through priority Habitat Action Plans. The most recent Action Plan reports a decline in coastal saltmarsh up to 2008, though is unable to give a quantitative loss estimate as ‘no comprehensive UK-wide assessment of trends is available’. Despite the lack of national assessment, successive saltmarsh Habitat Action Plans have used a national loss figure of 100 ha yr−1 (see http://www.ukbap-reporting.org.uk). The current figure was first written in a report by UK Biodiversity Group (1999) in which no method of calculation or reference was given.
This example is noteworthy because the unverifiable figure has been propagated through the academic literature, various local government reports and even the Intergovernmental Panel on Climate Change (IPCC) Third Assessment (Table 1). The figure of 100 ha yr−1 has been repeatedly quoted by multiple trustworthy sources, and has thus gained currency through ‘proof by assertion’. Propagation of unverifiable official government estimates has also been observed in the tropical peat swamp literature (Page et al. Reference Page, Rieley and Banks2010). Both the saltmarsh and the peat swamp examples concur with previous observations that potentially erroneous information from authoritative sources (such as the UK government) can quickly become established within the literature (Grainger Reference Grainger1996). Potentially erroneous figures become propagated and entrenched because it is easier for researchers to trust ‘best estimates’ from sources of perceived authority, rather than to follow the information trail and hunt for obscure government reports. Thus, even in a highly developed bureaucracy such as the UK, unverifiable figures of wetland loss increase uncertainty in an otherwise strong legislative conservation mechanism.
Estimates of saltmarsh loss in the UK, ranked by year. Note that the UK Biodiversity Group (1999) is the basis for the saltmarsh habitat action plan. This table does not include the large number of local government reports using the figure of 100 ha yr−1. IPCC = Intergovernmental Panel on Climate Change, JNCC = Joint Nature Conservation Committee, NGO = non-governmental organization.
While it is entirely possible that the published figures are accurate, their reliability can be questionable owing to the lack of confidence and transparency in their derivation. The consequent unenviable decision is to accept potentially flawed estimates as ‘the best available’ regardless of their accuracy, or to discard all previous effort to the detriment of conservation.
Improving the ‘evidence’ in evidence-based policy
Accurate techniques and information are required to develop and implement effective habitat policy (Walters et al. Reference Walters, Rönnbäck, Kovacs, Crona, Hussain, Badola, Primavera, Barbier and Dahdouh-Guebas2008). Unreliable figures of area and change incorporated into scientific assessments without proper verification may form the basis for policy measures that could prove inadequate at conserving, managing or restoring valuable ecological systems. The example of wetlands has shown that information uncertainty can be inherent in research from both developed and less-developed nations, and occurs at scales from hectares to hundreds of square kilometres. Two immediate needs are (1) improved transparency and confidence in historical analyses, and (2) greater rigour in methodology and publication going forward.
Transparency in data quality is crucial for the appropriate integration of historical scientific evidence in the policy-making process; the credibility of scientific advice (along with salience and legitimacy) is a key influence on the choices of decision-makers (Cash et al. Reference Cash, Clark, Alcock, Dickson, Eckley, Guston, Jäger and Mitchell2003). The uncertainties we describe must be better recognized by researchers and communicated to policy-makers, either as methodological or statistical caveats. Researchers collating secondary information from multiple sources (whatever the ecosystem) should critically appraise such data (Grainger Reference Grainger2008). Researchers must verify sources, question discrepancies in secondary data reporting, check references and clearly articulate the level of confidence in data quality. In the case of wetland assessments, most estimates have been devoid of such caveats (one exception is FAO 2007). By giving statements of confidence in the data quality, researchers can increase the credibility of proffered advice and contribute to a two-way science and policy deliberation approach; policy-makers can gauge the scientific certainty of change and scientists can contribute to a well-grounded policy debate. By promoting a two-way dialogue based on credible scientific evidence, the effectiveness of policy-making over threatened habitat conservation can be significantly improved (Cash et al. Reference Cash, Clark, Alcock, Dickson, Eckley, Guston, Jäger and Mitchell2003).
Future data analysis should be conducted with standardized and widely accepted techniques, and methods and interpretation should be independently assessed to ensure the accuracy of such a large task as quantifying land cover. Recent studies demonstrate improved methodological accountability for wetland monitoring at the regional and global scale by using remote sensing (Giri et al. Reference Giri, Zhu, Tieszen, Singh, Gillette and Kelmelis2008, Reference Giri, Ochieng, Tieszen, Zhu, Singh, Loveland, Masek and Duke2011; Spalding et al. Reference Spalding, Kainuma and Collins2010). Improved methodological rigour provides concurrently increased confidence in ecosystem trajectory analyses; this can be achieved by increasing investment in technology (particularly remote sensing infrastructure/access) and human resources. Increased collaboration between the scientific community and government/non-government agencies may increase the rate of peer-reviewed publication, thus enhancing the rigour and transparency of data collection and analysis. If decision-makers want credible evidence (Cash et al. Reference Cash, Clark, Alcock, Dickson, Eckley, Guston, Jäger and Mitchell2003) assimilated from multiple sources, then the evidence produced by their own researchers must be of sufficient quality to be accepted internationally. Professional advancement that considers peer-reviewed publications as an indicator of achievement could increase the quality and reputation of government-produced science, and increase data accessibility by bringing publications out of the grey literature (Corlett Reference Corlett2011). Although peer review is not without its own problems (Rissgård Reference Riisgård2003), it is a well-used mechanism that could increase the quality of science produced outside of academia. Reviewers and editors during the peer review process should recognize and confront instances where authors propagate potentially erroneous or untraceable estimates, in order to further increase credibility to decision-makers.
With these actions, accurate land cover change information can better provide policy with a strong quantitative foundation, and strong scientific inference for habitat loss and conservation programmes. Researchers may try to support policy with the best science currently available, though this may be further improved in order to contribute to management decisions that are better able to conserve valuable ecosystems. There can be no evidence-based policy without robust evidence.
Acknowledgements
Thanks to S. Rees (Natural England) for discussion, and J. Phelps (National University of Singapore) and K. Krauss (US Geological Survey) for commenting on an earlier draft. The comments of two anonymous reviewers are also appreciated. Funding was provided by the Singapore-Delft Water Alliance, National University of Singapore.