The ability to detect deception has been of interest to the fields of criminology and politics for many decades. Nonverbal cues to deception were prominently studied by Paul Ekman and colleagues in the seventies with a focus on visual perceptual cues such as fidgeting and facial expressions (Ekman, Reference Ekman2009). Developments in computerized acoustics have led researchers to begin examining cues that may mark deception in speech, bypassing any visual perceptual biases. Cues like faster speech rate, increased reaction time, and higher fundamental frequency have been suggested to mark deception (see DePaulo et al., Reference DePaulo, Lindsay, Malone, Muhlenbruck, Charlton and Cooper2003, for a meta-analysis). However, the majority of behavioral research testing speech cues to deception has focused on monolinguals, and only a small number of studies has examined deception performance in bilinguals, with the focus on nonnative speakers (e.g., Caldwell-Harris & Ayçiçeği-Dinn, Reference Caldwell-Harris and Ayçiçeği-Dinn2009; Cheng & Broadhurst, Reference Cheng and Broadhurst2005; Da Silva & Leach, Reference Da Silva and Leach2013; Duñabeitia & Costa, Reference Duñabeitia and Costa2015; Evans & Michael, Reference Evans and Michael2014).
These studies have contrasted bilinguals’ deception performance in a native versus second language with mixed findings: some observed that deception was more successfully detected in a first than a second language (Akehurst, Arnhold, Figueiredo, Turtle, & Leach, Reference Akehurst, Arnhold, Figueiredo, Turtle and Leach2018; Da Silva & Leach, Reference Da Silva and Leach2013; Leach & Da Silva, Reference Leach and Da Silva2013; Leach, Snellings, & Gazaille, Reference Leach, Snellings and Gazaille2017), some found the opposite (Evans, Michael, Meissner, & Brandom, Reference Evans, Michael, Meissner and Brandon2013), and some found no difference between the two languages (Caldwell-Harris & Ayçiçeği-Dinn, Reference Caldwell-Harris and Ayçiçeği-Dinn2009; Cheng & Broadhurst, Reference Cheng and Broadhurst2005; Duñabeitia & Costa, Reference Duñabeitia and Costa2015; Evans & Michael, Reference Evans and Michael2014). However, language background may influence bilinguals’ deception performance across both languages (Elliott & Leach, Reference Elliott and Leach2016; Evans, Pimentel, Pena, & Michael, Reference Evans, Pimentel, Pena and Michael2017), and yet comparisons between monolingual and bilingual speakers on deception tasks are lacking. In the current study, we examined acoustic cues to deception in monolinguals and bilinguals with different language backgrounds. We situated our study in dominant theories of deception in order to provide a mechanistic account for the role of language background in deception.
Deception in speech
Speech cues to deception in adults can be analyzed by using acoustic measures, or by using perceptual ratings of the acoustic measures. Perceptual ratings and acoustic cues overlap in their ability to discriminate truths and lies in some domains, such as frequency of disfluencies, but neither has been established to be more successful at correctly differentiating truths and lies (DePaulo, Rosenthal, Rosenkrantz, & Green, Reference DePaulo, Rosenthal, Rosenkrantz and Green1982). However, perceptual ratings become less reliable when judging the speech produced by individuals that the perceivers may hold preconceived stereotypes about, such as nonnative speakers. Nonnative speech is often perceived to be less truthful than native speech (Da Silva & Leach, Reference Da Silva and Leach2013; Evans & Michael, Reference Evans and Michael2014; Levi-Ari & Keysar, Reference Lev-Ari and Keysar2010), and therefore acoustic analysis of deception in nonnative speech is necessary to alleviate such bias.
Acoustic cues to deception have generally fallen into three categories: temporal cues, frequency cues, and intensity cues. Temporal cues, such as reaction time and speech rate have been the most successful at differentiating deceptive and truthful speech. Deception is generally associated with a longer reaction time than truthful speech (Harrison, Hwalek, Raney, & Fritz, Reference Harrison, Hwalek, Raney and Fritz1978; Rockwell, Buller, & Burgoon, Reference Rockwell, Buller and Burgoon1997a, Reference Rockwell, Buller and Burgoon1997b; Vrij, Edward, & Bull, Reference Vrij, Edward and Bull2001; Walczyk, Roper, Seemann, & Humphrey, Reference Walczyk, Roper, Seemann and Humphrey2003), unless the lie has been prepared in advance (Greene, O’Hair, Cody, & Yen, Reference Greene, O’Hair, Cody and Yen1985). Findings for speech rate have not been as consistent as those for reaction time. When examining acoustic measures of speech rate, faster speech often is associated with deceptive speech (Kirchübel, Stedmon, & Howard, Reference Kirchhübel, Stedmon and Howard2013; Motley, Reference Motley1974; Vrij et al., Reference Vrij, Edward and Bull2001), despite the fact that perceptually, listeners often rate slow speech to be more likely to be a lie (DePaulo et al., Reference DePaulo, Rosenthal, Rosenkrantz and Green1982; Rockwell et al., Reference Rockwell, Buller and Burgoon1997a). Further, Anolli and Ciceri (Reference Anolli and Ciceri1997) did not find any difference in speech rate between truths and lies when participants were describing pictures presented on a screen. Temporal cues are often taken to indicate that the deceiver is under a heightened cognitive load, with the time necessary to create a lie manifesting in a lengthened reaction time (Walczyk et al., Reference Walczyk, Roper, Seemann and Humphrey2003). However, in a meta-analysis of multiple studies that tested temporal cues to deception, neither response latency nor rate of speaking had an average effect size across all examined studies that significantly differed from zero (DePaulo et al., Reference DePaulo, Lindsay, Malone, Muhlenbruck, Charlton and Cooper2003).
Acoustic pitch cues include the change in average fundamental frequency and the variance in fundamental frequency within statements. Higher fundamental frequency has been associated with deceitful speech (Anolli & Ciceri, Reference Anolli and Ciceri1997; Ekman, O’Sullivan, Friesen, & Scherer, Reference Ekman, O’Sullivan, Friesen and Scherer1991; Streeter, Krauss, Geller, Olson, & Apple, Reference Streeter, Krauss, Geller, Olson and Apple1977), but not consistently (Kirchübel & Howard, Reference Kirchhübel and Howard2013; Rockwell et al., Reference Rockwell, Buller and Burgoon1997a, Reference Rockwell, Buller and Burgoon1997b). Furthermore, a greater variance in fundamental frequency has been associated with deceitful speech (Anolli & Ciceri, Reference Anolli and Ciceri1997; Rockwell et al., Reference Rockwell, Buller and Burgoon1997a). The final domain, intensity, relates to how much power is behind the speech and is usually perceived as speech volume. Intensity has been less frequently studied, but the few studies that have been conducted observed that average intensity has not been associated with differences between deceitful and truthful speech (Anolli & Ciceri, Reference Anolli and Ciceri1997; Kirchübel & Howard, Reference Kirchhübel and Howard2013; Rockwell et al., Reference Rockwell, Buller and Burgoon1997a, Reference Rockwell, Buller and Burgoon1997b). Similarly, higher variance in intensity throughout a speech phrase is not a marker of deceitful speech (Rockwell et al., Reference Rockwell, Buller and Burgoon1997a), but a greater range in intensity has been associated with deceit (Rockwell et al., Reference Rockwell, Buller and Burgoon1997a). In the meta-analysis of deception cues, fundamental frequency or pitch was the only cue with an average effect size that was significant such that overall higher pitch or frequency was associated with lies (DePaulo et al., Reference DePaulo, Lindsay, Malone, Muhlenbruck, Charlton and Cooper2003). However, it was also found specifically only in conditions where the participant was highly motivated to lie, and for those with no motivation, the effect of fundamental frequency/pitch cues was not significant.
What leads speakers to produce truthful and deceitful speech in acoustically distinct ways? Truthful speech requires recall of memories or facts while deceptive speech requires inhibition of the truth, in addition to creation of a believable lie. Difference in the processes that underlie speech production must therefore be at the core of the acoustic differences between truths and lies. Although there are many theoretical approaches to deception, two in particular (which we broadly term the “cognitive load” approach and the “emotional state” approach) can be especially helpful in pinpointing the mechanisms associated with changes in speech cues during deception.
Deception theories
Performance on a deception task can be related broadly to both the cognitive load and the emotional state during the task. Cognitive load theories for deception are based on the multifactor theory for deception by Zuckerman, DePaulo, and Rosenthal, (Reference Zuckerman, DePaulo and Rosenthal1981) and posit that the heightened cognitive load associated with suppressing the truth, fabricating the lie, and monitoring the success of the lie leads speakers to exhibit cues to deception (Greene et al., Reference Greene, O’Hair, Cody and Yen1985; Kirchübel & Howard, Reference Kirchhübel and Howard2013; Vrij, Fischer, Mann, & Leal, Reference Vrij, Fisher, Mann and Leal2008). For example, increased speech rate, reaction time, intensity, and intensity variability have been associated with cognitively taxing tasks in nondeception literature (Brunken, Plass, & Leutner, Reference Brunken, Plass and Leutner2003; Lively, Pisoni, Van Summers, & Bernacki, Reference Lively, Pisoni, Van Summers and Bernacki1993; Müller, Großmann-Hutter, Jameson, Rummer, & Wittig, Reference Müller, Großmann-Hutter, Jameson, Rummer, Wittig, Bauer, Gmytrasiewicz and Vassileva2001). Cognitive load has also been manipulated within the deception literature. During a task where participants were merely asked to answer a series of questions about themselves, they were asked to lie about one specific question prior to starting the interview. By allowing participants to prepare lies in advance, the cognitive load of quickly creating a lie was removed, and lie responses had a shorter reaction time than truth responses (Greene et al., Reference Greene, O’Hair, Cody and Yen1985). Further, lies that are not as cognitively taxing such as responses to yes/no questions have been found to be produced quicker than lies that require more formulation such as responses to open-ended questions (Walczyk et al., Reference Walczyk, Roper, Seemann and Humphrey2003, Reference Walczyk, Schwartz, Clifton, Adams, Wei and Zha2005). Vrij et al. (Reference Vrij, Fisher, Mann and Leal2008) suggested that imposing an extra cognitive load during lie detection may serve to increase the likelihood that the speaker will manifest deception cues. Imposing an extra cognitive load by telling lies in reverse chronological order or maintaining eye contact while telling lies were cited as successful methods for increasing accuracy of lie detection (Vrij et al., Reference Vrij, Fisher, Mann and Leal2008). While cognitive load explains some of the speech cues to deception, it does not account for all of them. For example, increased fundamental frequency is more often associated with emotionally taxing rather than cognitively taxing tasks.
Emotional arousal theory also has its beginnings in the work of Zuckerman et al. (Reference Zuckerman, DePaulo and Rosenthal1981) and suggests that there is an emotional response associated with producing lies, whether it be fear of being caught or satisfaction of getting away with it (Eckman, Reference Ekman2009; Kirchübel & Howard, Reference Kirchhübel and Howard2013). Higher fundamental frequency as the result of tightening of the vocal muscles has been associated with emotional stress such as fear, while a faster tempo has been associated with happiness and surprise (Scherer & Oshinsky, Reference Scherer and Oshinsky1977; Tolkmitt & Scherer, Reference Tolkmitt and Scherer1986). Streeter et al. (Reference Streeter, Krauss, Geller, Olson and Apple1977) instructed adults to try to deceive an interviewer on certain questions during an interview task and found that a difference in average fundamental frequency was a significant indicator of deception. In addition, when participants were emotionally aroused by being told that successful deception was correlated with IQ, the difference in fundamental frequency between truths and lies became significantly greater. Differences in emotional response have also been documented in reaction time measures. Walczyk et al. (Reference Walczyk, Roper, Seemann and Humphrey2003) tested the reaction time to emotionally taxing and potentially taboo questions (i.e., “Have you been arrested?”) as compared to emotionally neutral questions (i.e., “Do you wear glasses?”). Reaction time to emotional questions was significantly longer than to neutral questions indicating that emotion plays a significant part in the formulation of answers. Therefore, heightened emotion, just as heightened cognitive load, may make cues to deception more apparent.
Cognitive and emotional factors are not mutually exclusive during deception, and depending on task demands, both may affect results. For instance, a change in speech rate may indicate both heightened cognitive demand and emotional arousal. It also cannot be assumed that all participants in a deception task experience the same degree of cognitive load or emotional arousal. Individual differences in cognitive skills may lead some individuals to be better at producing undetectable lies. For instance, prior work has found that working memory capacity (Maldonaldo, Reference Maldonado2016) contributes to deception performance such that individuals with higher working memory capacity produce fewer detected lies than those with lower working memory capacity. However, prior research has rarely considered the role of linguistic experience in deception performance. In this study, we examined cues to deception in monolingual and bilingual English speakers because these speakers differ in their experience with cognitive load and emotion in language.
Deception in bilinguals
Both cognition-based and emotion-based mechanisms involved in deception can be considered from a new angle in the context of bilingual speakers. Multiple hypotheses can be formed regarding the effect of bilingualism on deception within the frameworks of both cognitive load and emotional state. Traditionally, it has been conjectured that the cognitive load associated with forming a lie and performing a task in a second language would lead to a higher cognitive load than engaging in only one of the two. Evans et al. (Reference Evans, Michael, Meissner and Brandon2013) showed that the lies of both speakers performing a cognitively difficult task and of speakers performing a task in a second language were more likely to be detected than the lies of speakers performing a cognitively simple task or performing in their native language. These findings were replicated by Duñabeitia and Costa (Reference Duñabeitia and Costa2015), who showed that bilinguals’ pupil size (associated with both cognitive load and emotional arousal) was larger when lying in a second language (L2) than a first language (L1). They also found that overall pupil size was larger when lying than when telling the truth, but that there was no significant interaction between language and deception (Duñabeitia & Costa, Reference Duñabeitia and Costa2015). This suggests that lying and speaking in an L2 are both cognitively taxing tasks and may lead to speakers producing more salient deception cues. Therefore, one logical hypothesis is that monolinguals should be better at performing a deception task than bilinguals performing a task in their L2. However, one complication in this largely straightforward line of reasoning arises from the broader literature on bilingual cognition, wherein bilingual executive function advantages in domains such as inhibition and task switching have been observed (e.g., Bialystok, Craik, Klein, & Viswanathan, Reference Bialystok, Craik, Klein and Viswanathan2004; Bialystok & Shapero, Reference Bialystok and Shapero2005; Bialystok & Viswanathan, Reference Bialystok and Viswanathan2009; Costa, Hernández, Costa-Faidella, & Sebastián-Gallés, Reference Costa, Hernández, Costa-Faidella and Sebastián-Gallés2009; Michael & Gollan, Reference Michael, Gollan, Kroll and de Groot2005; Prior & MacWhinney, Reference Prior and MacWhinney2010).
When applied to deception, which requires speakers to deal with the heightened cognitive load associated with suppressing lies and producing truths, a possible effect of bilingualism on deception performance might be a positive one. Bilinguals have lifelong experience with handling the increased cognitive load associated with choosing the correct language and suppressing the other language during speech. Some bilingualism literature suggests that bilinguals have an advantage at domain-general inhibition tasks as compared to monolingual peers (Bialystok et al., Reference Bialystok, Craik, Klein and Viswanathan2004; Costa et al., Reference Costa, Hernández, Costa-Faidella and Sebastián-Gallés2009; Michael & Gollan, Reference Michael, Gollan, Kroll and de Groot2005). If inhibition of the truth during deception uses similar mechanisms as domain-general inhibition, then bilinguals may have more cognitive resources available to create and produce a convincing lie.
Emotion-based theories of deception lead to an overlapping as well as a contrasting hypothesis with respect to bilingualism, and L2-speech in particular. Just as lying and speaking an L2 both increase cognitive load, lying and speaking an L2 are both known to be emotionally taxing. Speaking an L2 induces anxiety, especially at lower levels of language proficiency (Horwitz, Horwitz, & Cope, Reference Horwitz, Horwitz and Cope1986). In line with this observation, bilinguals may be hypothesized to exhibit more cues to deception when speaking their L2 than when speaking their L1. The combination of lying and speaking an L2 may exaggerate the production of deception cues, acting as an emotional “double stressor.” However, there is evidence indicating an absence of such a compounding effect in L2 deception. Caldwell-Harris and Ayçiçeği-Dinn (Reference Caldwell-Harris and Ayçiçeği-Dinn2009) measured skin conductance response (SCR; associated with emotional arousal or greater anxiety) during a deception task in bilingual speakers and found that the SCR was higher when using an L2 than an L1. In addition, SCRs were higher for lies than truths; however, there was no interaction between the language used (L1/L2) and deception task performed (truth/lies) indicating that there was no effect of a double stressor.
However, there exists a contrasting argument related to the intersection of bilingualism and emotion. The blunted emotional response theory (Caldwell-Harris, Reference Caldwell-Harris2015, Dewaele, Reference Dewaele2008; Harris, Ayçíçeğí, & Gleason, Reference Harris, Ayçíçeğí and Gleason2003) posits that speakers tend to be more emotionally distant from topics when speaking their L2 than when speaking their L1. In support of this theory, bilinguals reading lies aloud were found to have lower SRCs in their L2 than their L1 (Kreyßig & Krautz, Reference Kreyßig and Krautz2019). Further, SCRs for both positive and negative emotionally charged words were lower for bilinguals in their L2 than their L1 (Cladwell-Harris & Ayçiçeği-Dinn, Reference Caldwell-Harris and Ayçiçeği-Dinn2009; Harris et al., Reference Harris, Ayçíçeğí and Gleason2003), and this blunting effect associated with the L2 appears to be specific to bilinguals with limited/low L2 proficiency. That is, for bilinguals with high proficiency in both their languages and bilinguals who acquired their L2 early in life, a blunted emotional response is not always present (Caldwell-Harris, Reference Caldwell-Harris2015; Eiloa, Havelka, Sharma, Reference Eilola, Havelka and Sharma2007). The blunted emotional response theory would predict that deception, an emotionally laden task, may be blunted by the use of the late acquired/relatively low proficiency L2, and that therefore L2 speakers may manifest fewer cues to deception than monolinguals and bilinguals tested in their L1. With the goal of contributing to the cognition-based and emotion-based theories of deception, in the current study, we examined a range of speech cues to deception, and tested whether these cues manifested differently in monolingual speakers versus bilingual speakers speaking their L1 versus their L2.
Current study
Prior research has focused on cognitive load (Greene et al., Reference Greene, O’Hair, Cody and Yen1985; Kirchübel & Howard, Reference Kirchhübel and Howard2013; Vrij et al., Reference Vrij, Fisher, Mann and Leal2008) and emotional responsivity (Caldwell-Harris & Ayçiçeği-Dinn, Reference Caldwell-Harris and Ayçiçeği-Dinn2009; Kirchübel & Howard, Reference Kirchhübel and Howard2013) as the mechanisms that underlie the manifestation of cues to deception in speech. Bilingualism literature has suggested that bilinguals may experience more cognitive load in an L2, but have more experience with handling increased cognitive loads than monolinguals (Bialystok et al., Reference Bialystok, Craik, Klein and Viswanathan2004; Michael & Gollan, Reference Michael, Gollan, Kroll and de Groot2005). At the same time, emotional arousal operates differently in an L2 versus an L1 (Caldwell-Harris & Ayçiçeği-Dinn, Reference Caldwell-Harris and Ayçiçeği-Dinn2009; Duñabeitia & Costa, Reference Duñabeitia and Costa2015; Harris et al., Reference Harris, Ayçíçeğí and Gleason2003). In the current study, we examined which of the cognitive-based or the emotion-based theories would provide a better explanation of deception performance in three groups of speakers: English monolinguals, bilinguals who speak English as an L1, and bilinguals who speak English as an L2. All groups performed a picture-naming task in English, which induced spoken truths and lies at a single-word level. We chose a between-group rather than a within-group design (where bilinguals’ performance in their L1 vs. their L2 is contrasted) because we aimed to tightly control the linguistic content and processing parameters for the task, and therefore all participants had to perform the task in the same language.
Most studies examining deception in L2 speakers have relied on human judgments of deception performance. One disadvantage to such a method is that human judges are biased to judging more fluent and native speakers as telling the truth (Akehurst et al., Reference Akehurst, Arnhold, Figueiredo, Turtle and Leach2018; Da Silva & Leach, Reference Da Silva and Leach2013; Elliott & Leach, Reference Elliott and Leach2016; Evans et al., Reference Evans, Pimentel, Pena and Michael2017; Leach & Da Silva, Reference Leach and Da Silva2013) or to judging nonnative speakers as telling lies (Da Silva & Leach, Reference Da Silva and Leach2013; Evans & Michael, Reference Evans and Michael2014). As a result, it can be difficult to pinpoint whether nonnative speakers are producing more cues to deception or whether they are being judged more critically due to social factors. Acoustic variables can be used as objective markers of deception in speech that are not conditioned by social bias. Therefore, in the present study, acoustic cues from three domains (temporal, frequency, and intensity) were compared across groups in order to examine speech cues to deception.
We expected that all groups would exhibit acoustic cues to deception. In line with the available literature, we tested specific hypotheses within the cognitive-load and the emotion-based theories of deception. In line with the cognitive-load theory, we tested the hypothesis that bilinguals tested in an L2 will provide more cues to deception than monolinguals and bilinguals tested in an L1 due to the combined cognitive load of L2-speech and deception. In contrast, in line with the bilingual executive function advantage literature, we tested the hypothesis that bilinguals speaking in their L1 and L2 will provide fewer cues to deception than monolinguals due to experience with inhibition. Consistent with the emotional arousal theory, we tested the hypothesis that bilinguals speaking in their L2 will provide more cues to deception than monolinguals or bilinguals speaking in their L1 due to the extra emotional stress of speaking an L2. In contrast, the blunted emotional response theory led to the hypothesis that bilinguals speaking their L2 will provide fewer cues to deception than monolinguals and bilinguals using their L1. Although the cognitive-load theory and the emotional-arousal theory generate similar predictions, we expected different dependent variables to be stronger indicators of each process, with reaction time effects lending more support to the cognitive-load theory (e.g., Walczyk et al., Reference Walczyk, Roper, Seemann and Humphrey2003) and fundamental frequency effects lending more support to the emotional-arousal theory (e.g., Streeter et al., Reference Streeter, Krauss, Geller, Olson and Apple1977).
Method
Participants
The data of 81 adults from a larger pool (N = 129) of participants who completed the deception task were analyzed because they fell into one of the three groups that were the focus of this study. Participants were recruited from a university campus and the greater community in the Midwest United States and were between 18 and 40 years old. Participants were classified as monolinguals (n = 40) if they acquired English from birth and rated their abilities in Spanish as below a 3 on a scale of 0 (no speaking ability) to 10 (perfect speaking ability) where 3 corresponded to “fair,” and 1 and 2 corresponded to “very low” and “low” abilities, respectively. The ratings were from the Language Experience and Proficiency Questionnaire (Marian, Blumenfeld, & Kaushanskaya Reference Marian, Blumenfeld and Kaushanskaya2007, see below for more detail). Monolinguals with Spanish experience were usually the results of mandatory language classes in middle or high school, but none continued studies in college.
Participants were classified as English-L1 bilinguals (n = 23) if they acquired English before Spanish and rated their Spanish abilities at a 6 (slightly more than adequate ability) or above. English-L1 bilinguals were generally Spanish majors and some had spent time studying abroad in Spain, but most acquired their language skills in a classroom environment. Participants were classified as English-L2 bilinguals (n = 18) if they acquired Spanish before English and rated their English abilities at a 6 or above. The majority of English-L2 bilinguals were born in Spanish-speaking countries and immigrated to the United States in early adulthood. They acquired English both in school and, following immigration, in an immersive environment. Eleven participants were not included in any of the groups because they rated their knowledge of a language other than English or Spanish at a 6 or higher. Software error led to the experiment crashing for 7 participants, and those who completed fewer than 50% of trials before the crash were excluded (3 participants).
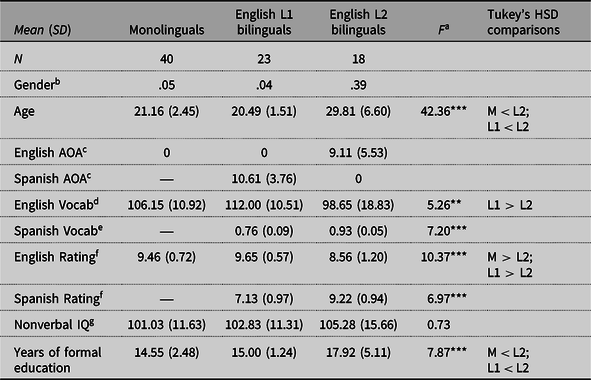
Participant characteristics were collected through standardized tests and questionnaires. All participants completed the Language Experience and Proficiency Questionnaire (Marian et al., Reference Marian, Blumenfeld and Kaushanskaya2007), which provided data on age, order of language acquisition, and language proficiency. Nonverbal IQ was measured using the matrices subtest of the Kaufman Brief Intelligence Test-2 (Kaufman & Kaufman, Reference Kaufman and Kaufman2004). English vocabulary skills were measured using the Peabody Picture Vocabulary Test (Dunn & Dunn, Reference Dunn and Dunn2007). Spanish vocabulary skills of the two bilingual groups were measured by the Test de Vocabulario en Imagenes Peabody (Dunn, Padilla, Lugo, & Dunn, Reference Dunn, Padilla, Lugo and Dunn1986). See Table 1 for a comparison of age, IQ, education, English, and Spanish abilities between groups. Participants did not significantly differ on IQ but did differ on age, language abilities, and education. A series of Tukey tests showed that the English-L2 bilinguals were older than the other two groups (mono: p < .001; English-L1: p < .001), but the monolingual and English-L1 bilinguals did not differ in age (p = .76). English-L2 bilinguals also had significantly lower English vocabulary scores than English-L1 bilinguals (p < .01), but the monolinguals did not differ significantly from either of the other groups (English-L1: p = .20, English-L2: p = .16). The self-rated English speaking abilities of the English-L2 bilinguals were significantly lower than the other two groups (mono: p < .001; English-L1: p < .001), but the monolinguals and English-L1 bilinguals did not significantly differ (p = .65) As expected, English-L2 bilinguals had significantly higher Spanish vocabulary scores than English-L1 bilinguals (p < .001) and had higher self-rated Spanish speaking abilities as well (p < .001). English-L2 bilinguals also had significant more years of formal education than the monolingual (p < .001) and English-L1 bilinguals (p < .01), but the monolingual and English-L1 bilinguals did not significantly differ in years of education (p = .84).
Participant characteristics

a F value where F (2, 78), except for Spanish Vocab and Spanish Speaking, which are Welch t test values: Vocab: t (36.34), Speaking: t (37.10). bProportion male. cAge of acquisition, measured in years. dStandard score on Peabody Picture Vocabulary Test. eProportion correct on Test de Vocabulario en Imagenes Peabody. fSelf-rating of speaking ability on a scale of 0 to 10, where 0 = none, 1 = very low, 2 = low, 3 = fair, 4 = slightly less than adequate, 5 = adequate, 6 = slightly more than adequate, 7 = good, 8 = very good, 9 = excellent, 10 = perfect. gStandard score on Kaufman Brief Intelligence Test. **p < .01. ***p < .001.
Experimental task
Materials
Forty-eight black and white line drawings from the International Picture Naming Project Database (Bates et al., Reference Bates, D’Amico, Jacobsen, Székely, Andonova, Devescovi and Tzeng2003) and Snodgrass and Vanderwart (Reference Snodgrass and Vanderwart1980) were selected as the naming stimuli. Drawings from the two sources were visually of the same style (12 from the International Picture Naming Project Database, 36 from Snodgrass & Vanderwart). The stimuli were simple images intended to elicit single-word noun responses. The nouns were selected to have high lexical frequency, few alternate names, and not be cognates or have phonemic overlap between the English and Spanish labels. Each image was presented twice to participants: once in the truth condition and once in the lie condition. Images were framed with a green square for the truth trials and with a red square for the lie trials for a total of 96 test trials. Truth and lie trials were intermixed and presented to the participants in a randomized order. The stimulus list is available in Appendix A.
Procedure
Participants were told they would participate in a task which involved telling lies about pictures on a computer screen. Each image was presented for 500 ms followed by a tone that indicated to the participant that they could begin producing the word. Participants were instructed to use the color of the frame to determine if they should name the picture truthfully or make up a convincing lie. They spoke their responses into a microphone sitting on the desk in front of the screen. The distance between a participant and a microphone varied between 4 and 7 inches. Sitting behind the participant was a confederate. The participants were told that the confederate would judge each of their productions as a truth or a lie. In order to motivate the participants to tell convincing lies, they were told that for every lie they told that was not detected by the confederate, they would receive $2. Participants were told that to produce the most convincing lies, they should not repeat the same word for all lie trials but try to come up with a different word for each trial. Prior to starting test trials, participants performed four practice trials, two truths and two lies, during which they were given corrective feedback (e.g., if they incorrectly told the truth for lie trials or told lies for truth trials). Following completion of the experiment, participants were debriefed and were told that the confederate was not judging their productions and that all participants were compensated the same amount for participating in the task.
Analysis
All productions were transcribed and coded as correct or incorrect depending on the condition they were presented in. All transcriptions were cross-checked by two different coders, and any discrepancies were resolved by a third coder. The start and stop time of each production was further coded by trained research assistants using Praat (Boersma & Weenick, Reference Boersma and Weenink2017). All word onset and offset data for 16 participants (20% of the data) were independently double-coded. Reliability was captured by calculating intraclass correlations using the psych package (Revelle, Reference Revelle2018) in R (R Core Team, 2015). Intraclass correlations range from 0 to 1 with higher numbers indicating more similar coding across coders. Intraclass correlation of the word onset and word offset were both .99 which is likely due to the fact that 93% of discrepancies had less than a 50-ms difference between the coders. The largest differences in coding that was captured between coders was 276 ms, but discrepancies of this magnitude were rare. Reaction time, word duration, fundamental frequency, and intensity were extracted using Praat scripts for each of the coded files.
Reaction time was calculated as the time that elapsed between the end of the prompting beep and the onset of the first word. Filler sounds like “um” or “hmm” were not included as the onset of a response. Word or phrase duration, in the case where multiple words were produced (e.g., “fingernail polish” or “loaf of bread”), was calculated as the time between the onset of the word or phrase until the offset. Corrections and self-speech (i.e., “pen no pencil” or “oh shoot”) were not included in the calculation of response duration. The number of syllables in each response was coded by the first author and this value was divided by the duration of each response to calculate the articulation rate of each response.
Average fundamental frequency for each response was calculated using the autocorrelation method following Boersma (Reference Boersma1993), from response onset to offset, taking the average of frequencies at a 0.01 sampling rate excluding frequencies outside of 75 Hz to 600 Hz. The resultant fundamental frequency in Hertz was normalized to semitones as recommended by Nolan (Reference Nolan2003) in order to account for individual differences in fundamental frequency.1 Intensity for each response was measured as overall root mean squared (rms) amplitude in dB over the duration of the response.
Variation in fundamental frequency and intensity was determined using R scripts, by calculating the variance in these acoustic dimensions across all trials for each condition separately for each participant. Two images had to be excluded because both presentations were framed in the same color due to experimental error. This led to 92 trials for each participant available for analysis. Trials where participants did not provide an answer, or did not answer in English, were excluded (57 trials). Trials where the participant answered before the tone, or where they did not answer in time for the full production to be recorded were excluded (35 trials). Trials where participants responded faster than 150 ms after the tone were considered false starts and were also excluded (64 trials). In total, 8.8% of the data were excluded, and data cleaning led to a total of 7,088 trials available for final analysis. For reaction time (RT) analyses, only correct labels for truth trials and incorrect labels for lie trials were retained, for a total of 6,964 trials (i.e., an additional 1.7% of data constituting incorrect responses were excluded).
Analyses were conducted in R using the lme4 package (Bates, Maechler, Bolker & Walker, Reference Bates, Maechler, Bolker and Walker2015). Mixed-effects models were run on all six outcome variables: reaction time (ms), articulation rate (syllables/s), fundamental frequency (standardized to semitones), variation in standardized fundamental frequency, intensity (dB), and variation in intensity. Models included fixed effects of group, condition, and the interaction between group and condition. In line with Barr, Levy, Scheepers, and Tily’s (Reference Barr, Levy, Scheepers and Tily2013) “keep it maximal” approach, random by-subject effects of condition and random by-item effects of condition and group were initially included in the models. However, due to problems with convergence, the random by-item effect of group, and the covariance between random effects were removed in all models.2 Condition was contrast coded such that the truth condition was coded –0.5 and the lie condition was coded 0.5. Group was dummy coded such that the monolingual group was the reference group. Any significant effects of group were followed up by changing the reference group to the English-L1 bilingual group.
Results
Temporal cues
Reaction time
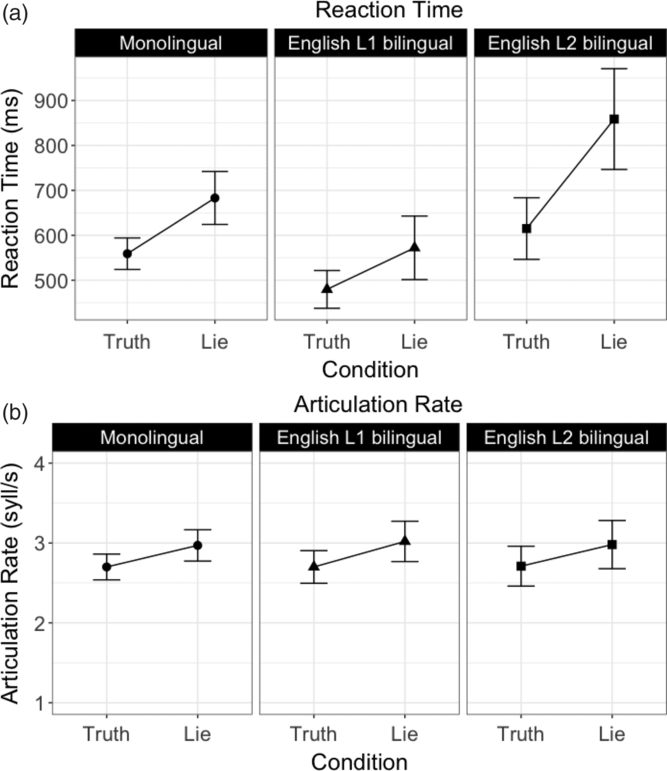
The reaction time was log transformed to correct for positive skew before being entered into the model. A Wald test revealed a significant effect of condition, χ 2(1) = 54.11, p < .05, such that lie trials (M = 689.1, SD = 401.5) elicited longer RTs than truth trials (M = 547.6, SD = 237.9). There was a significant main effect of group, χ2(2) = 14.55, p < .05, such that English-L1 bilinguals responded significantly faster than both the monolingual group (β = 0.17, SE = 0.07, t = 2.54) and the English-L2 bilingual group (β = 0.31, SE = 0.08, t = 3.76). English-L2 bilinguals and monolinguals did not significantly differ from each other (β = 0.14, SE = 0.07, t = 1.82). There was also a significant interaction between condition and group, χ2(2) = 11.18, p < .05. The effect of condition for monolinguals (β = 0.15, SE = 0.03), English-L1 bilinguals (β = 0.12, SE = 0.04), and English-L2 bilinguals (β = 0.30, SE = 0.04) was in the same direction, such that lies had longer RTs than truths. However, the difference in RTs between truths and lies was significantly greater for the English-L2 group than for both the monolingual (β = 0.14, SE = 0.05, t = 2.88) and English-L1 groups (β = 0.17, SE = 0.06, t = 3.12). The difference in RTs between truths and lies did not significantly differ between the monolingual and English-L1 group (β = 0.03, SE = 0.05, t = 0.63). See Figure 1a for a plot of the nontransformed RT data.
Average (a) reaction time in milliseconds and (b) articulation rate in syllables per second during truth and lie trials by group, with standard deviation bars.

Since we did find a significant interaction between condition and group, we were interested in how differences in language ability affected results. To examine the effect of L2 proficiency within groups, we conducted a post hoc analysis with L2 proficiency (realized as vocabulary scores) predicting reaction time. Since L2 proficiency has different meanings for the two bilingual groups, we performed these analyses separately for the English-L2 and English-L1 bilinguals. In a model including condition, L2 vocabulary, and the interaction between the two, condition was a significant predictor of reaction time, but L2 vocabulary and the interaction did not significantly improve the model. This was the case for both the English-L1 bilinguals, condition: χ2(1) = 8.91, p < .01; L2-vocab: χ2(1) = 0.01, p = .92; interaction: χ2(1) = 0.05, p = .83, and the English-L2 bilinguals, condition: χ2(1) = 28.91, p < .001; L2-vocab: χ2(1) = 0.73, p = .39; interaction: χ2(1) = 1.48, p = .22
Articulation rate
Articulation rate was calculated by dividing the number of syllables in the word by the duration of the word in seconds. A Wald test revealed a significant effect of condition such that participants had a higher articulation rate for lie condition than truth condition responses, χ2(1) = 6.12, p < .05. Truth condition responses were produced at an average of 2.7 syllables per second (SD = 1.0) and lie condition responses were produced at an average of 3.0 syllables per second (SD = 1.2). There was no significant effect of group, χ2(2) = 0.15, p = .93, and no significant interaction between condition and group, χ2(2) = 0.53, p = .77. Therefore, the magnitude of the effect of condition was similar for monolinguals (β = 0.28, SE = 0.12), English-L1 bilinguals (β = 0.32, SE = 0.13), and English-L2 bilinguals (β = 0.26, SE = 0.13). See Figure 1b for a plot of the raw data. It should be noted that the average number of syllables of words produced in the lie condition was 1.46 (SD = 0.65) and in the truth condition was 1.28 (SD = 0.51). When syllable number was entered into the mixed-effect model, the random slopes for condition had to be removed for convergence. A Wald test revealed that the effect of condition significantly improved the model such that more syllables were produced in the lie than truth condition, χ2(1) = 213.8, p < .05. Neither the effect of group, χ2(2) = 0.50, p = .79, nor the interaction between group and condition significantly improved the model, χ2(2) = 3.10, p = .21. Therefore the magnitude of the effect of condition did not differ between monolinguals (β = 0.16, SE = 0.02), English-L1 bilinguals (β = 0.21, SE = 0.02), or English-L2 bilinguals (β = 0.17, SE = 0.03).
Pitch cues
Average fundamental frequency
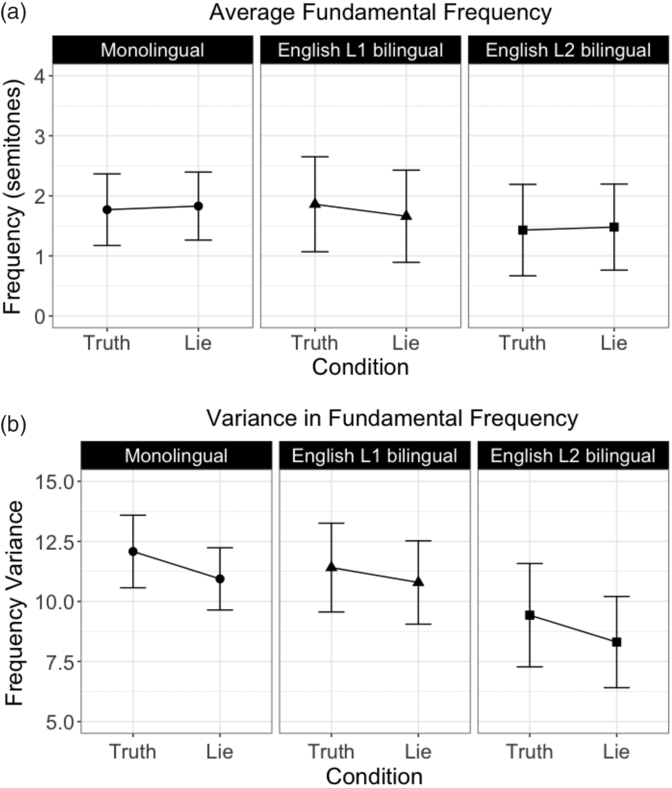
Fundamental frequencies above 300 Hz were excluded as incorrect extraction by the Praat script (15 trials). Fundamental frequency was standardized by converting each instance into the change in semitones from the first quartile fundamental frequency of each participant (Nolan, Reference Nolan2003). This controlled for natural variation in fundamental frequency between participants and the fact that both men and women completed the task, and that men generally have lower fundamental frequencies than women. In addition, for the model to converge, the by-participant random effect of condition was removed. The model revealed no significant effect of condition, χ2(1) = 0.02, p = .89, no significant effect of group, χ2(2) = 0.70, p = .70, and no significant interaction between condition and group, χ2(2) = 2.28, p = .32). See Figure 2a for a plot of the standardized data.
(a) Average fundamental frequency in semitones, standardized by each participant, and (b) variance of the fundamental frequency during truth and lie trials by group, with standard deviation bars.

Variance in fundamental frequency
Variance in fundamental frequency was extracted for each participant as the variance between utterances for each condition. Given the short utterances, it was not possible to examine variance within each utterance. With only one observation per level of condition for each participant and to deal with convergence problems, only a by-participant random intercept was included in the model. There was a weak trend for the effect of condition, χ2(1) = 3.27, p = .07, such that there was more variance for the truth (M = 11.3, SD = 9.21) than the lie condition (M = 10.3, SD = 8.16). There was no significant effect of group, χ2(2) = 1.27, p = .53, and no significant interaction between condition and group, χ2(2) = 0.18, p = .91. The effect of condition was similar for monolingual (β = –1.14, SE = 0.78), English-L1 bilinguals (β = –0.62, SE = 1.03), and English-L2 bilinguals (β = –1.12, SE = 1.16). See Figure 2b for a plot.
Intensity cues
Average intensity
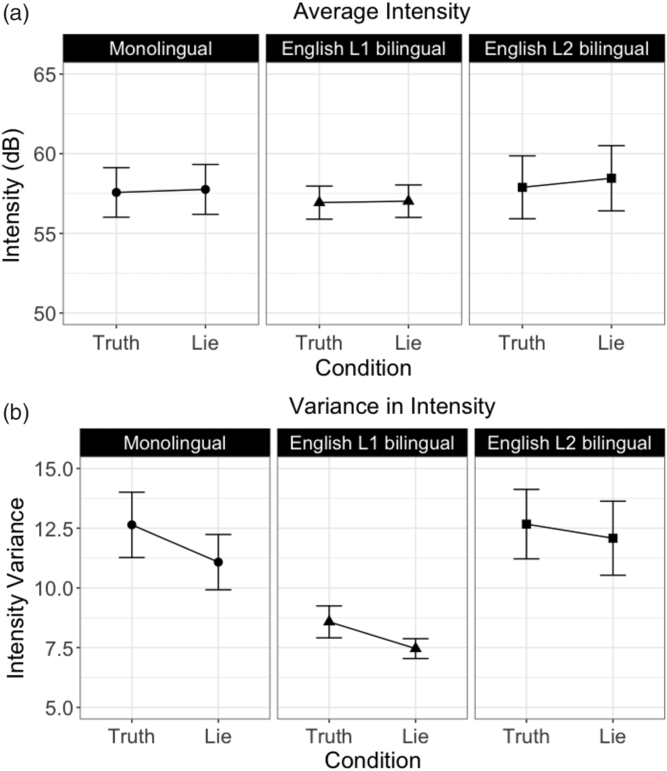
Average intensity was measured in decibels. The model revealed no significant effect of condition, χ2(1) = 1.50, p = .22, no significant effect of group, χ2(2) = 0.46, p = .79, and no significant interaction between condition and group, χ2(2) = 3.97, p = .14). See Figure 3a for a plot of the raw data.
(a) Average intensity in decibels and (b) variance in intensity during truth and lie trials by group, with standard deviation bars.

Variance in intensity
The model for variance in intensity was set up similarly to the model for variance in fundamental frequency. The model revealed a significant effect of condition, χ2(1) = 8.61, p < .05, such that the lies (M = 10.28, SD = 6.30) were produced with less variance in intensity than truths (M = 11.49, SD = 7.13). There was also a significant effect of group, χ2(2) = 6.74, p < .05, such that English-L1 bilinguals had significantly less variance in intensity between trials than monolinguals (β = 3.83, SE = 1.64, t = 2.33) and English-L2 bilinguals (β = 4.35, SE = 1.98, t = 2.20). There was no difference in variance between the monolinguals and English-L2 bilinguals (β = 0.52, SE = 1.78, t = 0.29). There was no significant interaction between condition and group, χ2(2) = 0.85, p = .65. Therefore, the effect of condition was similar for monolinguals (β = –1.55, SE = 0.59), English-L1 bilinguals (β = –1.12, SE = 0.78), and English-L2 bilinguals (β = –0.59, SE = 0.88). See Figure 3b for a plot.
Discussion
We examined acoustic cues to deception in a picture-naming task with three different groups of English speakers: monolinguals, native English speakers with Spanish as an L2, and native Spanish speakers with English as an L2. Consistent with previous research (Rockwell et al., Reference Rockwell, Buller and Burgoon1997a; Reference Rockwell, Buller and Burgoon1997b; Scherer, Feldstein, Bond, & Rosenthal, Reference Scherer, Feldstein, Bond and Rosenthal1985), temporal cues were the most reliable in marking deception. All groups took longer to respond to lie trials than to truth trials and lies had a faster articulation rate in all groups. Average fundamental frequency and average intensity were not significant cues to deception, but the variance of the parameters was lower for lie than for truth trials across groups. Group differences in deception cues were only found for reaction time. The difference in reaction time for truth and lie trials was higher for English-L2 bilinguals than for the other two groups. Since our measures were not based on ratings by individuals who may hold preconceived stereotypes about nonnative speakers, they therefore provide evidence that nonnative speakers exhibit a cue to deception that is more readily detectable than is the case for native speakers.
Embedding the findings within theories of deception
We found that English-L1 bilinguals did not differ from monolinguals on most of the acoustic measures we considered (with the exception of overall reaction time and intensity variation), and English-L2 bilinguals showed heightened cues to deception, but only for naming times. Our findings align with both the cognitive load and emotional arousal theories positing that bilinguals speaking in their L2 are under a heightened cognitive load and/or deal with a double emotional stressor when performing a deception task. Since reaction time differences are most frequently interpreted as reflecting cognitive processes (e.g., Walczyk et al., Reference Walczyk, Roper, Seemann and Humphrey2003) whereas fundamental frequency fluctuations are traditionally associated with heightened emotions and stress (e.g., Streeter et al., Reference Streeter, Krauss, Geller, Olson and Apple1977), we interpret the RT effects in our data as support for the cognitive load theory of deception. However, our results do not allow us to rule out the emotional arousal theory entirely. We generally conclude that the double load of lying and speaking an L2 served to lengthen reaction time more than either lying in an L1 or telling the truth in an L2. These findings are in line with Evans et al. (Reference Evans, Michael, Meissner and Brandon2013) who found that lies were detected more accurately in an L2. However, our findings differ from studies that have not found an interaction between language and deception. Studies from Duñabeitia and Costa (Reference Duñabeitia and Costa2015) and Caldwell-Harris and Ayçiçeği-Dinn (Reference Caldwell-Harris and Ayçiçeği-Dinn2009) both showed that lying and speaking an L2 produce similar effects and do not together result in a “double stressor.” It is possible that these different patterns of results are due to differences in participant characteristics or task parameters between our study and previous work.
While supporting the increased cognitive load and the increased arousal theories of deception, our findings stand in stark contrast to the predictions that stem from the literature on bilingual executive function advantage and from blunted emotional response theories. The bilingual executive function advantage theory would suggest that bilinguals, because of increased experience with inhibiting one of their languages while speaking the other, would be more successful at inhibiting truths and telling lies than monolinguals (Bialystok et al., Reference Bialystok, Craik, Klein and Viswanathan2004; Costa et al., Reference Costa, Hernández, Costa-Faidella and Sebastián-Gallés2009; Michael & Gollan, Reference Michael, Gollan, Kroll and de Groot2005). We might expect for this pattern to be more pronounced in English-L1 bilinguals, who performed the deception task in their L1, and thus were not handicapped by low target-language proficiency (unlike the English-L2 bilinguals). Yet, our findings suggest lack of such an advantage in either of the bilingual groups. One explanation for this lack of effects is simply that bilingual cognitive advantages do not exist (e.g., Paap & Greenberg, Reference Paap and Greenberg2013). Another explanation for the lack of a “deception” advantage in the English-L1 bilingual group is that their language environments might not have allowed for experience with inhibiting one language when using the other. Our English-L1 bilinguals were living in an English-speaking environment, and the majority of the participants acquired Spanish in the classroom. These bilinguals did not have to practice inhibiting either of their languages because the environments in which they spoke their two languages were separated. In the future, it would be important to test bilinguals who do use their two languages in the same context, and to measure their inhibitory control skills directly in order to test the possibility that enhanced inhibitory control in bilinguals is associated with more successful deception performance.
In contrast, the lack of advantages for the English-L2 bilingual group is not the result of a lack of experience with using both languages in everyday life. The English-L2 bilinguals in our study occupied mixed language environments and reported using both languages on a daily basis. However, our English-L2 bilinguals also had lower English proficiency than the monolinguals, and the deception task, administered in their weaker L2, played to this linguistic weakness (Gollan, Montoya, Fennema-Notestine, & Morris, Reference Gollan, Montoya, Fennema-Notestine and Morris2005; Hanulová, Davidson, & Indefry, Reference Hanulová, Davidson and Indefrey2011). Had English-L2 bilinguals experienced any advantage in cognitive control, this advantage was supplanted by detrimental effects of comparatively lower levels of English proficiency. The results or our post hoc analysis indicated that L2 vocabulary scores did not significantly predict reaction time. It may be the case that our L2 proficiency measures did not vary enough within groups to yield an effect, although between groups, proficiency, and experience differed enough to yield significant group differences.
Crucially, although English-L2 bilinguals in the current study were overall slower at naming pictures in English, they were especially slow at generating false names for the pictures. This indicates that a factor other than a lower level of proficiency likely contributed to English-L2 bilinguals’ performance on the deception task. L2 speakers’ have a known disadvantage on production tasks (Gollan et al., Reference Gollan, Montoya, Fennema-Notestine and Morris2005; Hanulová et al., Reference Hanulová, Davidson and Indefrey2011), but our task showed that they have an added disadvantage when producing false names. The explanation that appears to be most likely is that increased anxiety and/or increased cognitive load associated with speaking the L2 was especially detrimental to generating lies.
With respect to the blunted emotional response theory, we might have expected for bilinguals to experience less emotional stress in an L2 than in an L1 through a “distancing” effect (Caldwell-Harris, Reference Caldwell-Harris2015, Dewaele, Reference Dewaele2008; Harris et al., Reference Harris, Ayçíçeğí and Gleason2003). If this blunting were present during deception, bilinguals tested in the L2 should have demonstrated the fewest and least detectable cues to deception. Yet, our findings suggest that the L2 group actually showed the largest magnitude of the condition effect for the RT cue. It is possible that a more emotional task would be more sensitive to such a blunting effect. Our deception task only required participants to name simple nouns and not words that could evoke strong emotions. Had our task involved more emotionally triggering words, it is possible that L2 bilinguals might demonstrate fewer cues to deception than monolinguals.
Possible contributions of design to the pattern of findings
In contrast to previous studies on deception in bilinguals, which observed the same effect of deception in bilinguals’ L1 and L2 (Caldwell-Harris & Ayçiçeği-Dinn, Reference Caldwell-Harris and Ayçiçeği-Dinn2009; Duñabeitia & Costa, Reference Duñabeitia and Costa2015) or more detectable deception in the L1 (Akehurst et al., Reference Akehurst, Arnhold, Figueiredo, Turtle and Leach2018; Da Silva & Leach, Reference Da Silva and Leach2013; Leach & Da Silva, Reference Leach and Da Silva2013; Leach et al., Reference Leach, Snellings and Gazaille2017), we observed an enhanced effect of deception in bilinguals producing lies in their L2 compared to in their L1, at least for naming times. This indicates that the cognitive or the emotional load placed on participants when labeling pictures in an, L2 is heightened especially when creating false labels. One reason our task may have been more difficult for L2 speakers is that our stimuli were intermixed such that participants did not know if they needed to produce a truth or lie before a trial began. When starting a trial, participants had to first determine whether they should produce a truth or a lie, and then come up with a convincing lie or retrieve the label in under a second. The decision of whether to lie or not was not present in previous studies where lie and truth trials were blocked or examined between-subjects (Akehurst et al., Reference Akehurst, Arnhold, Figueiredo, Turtle and Leach2018; Cheng & Broadhurst, Reference Cheng and Broadhurst2005; Feeley & Deturck, Reference Feeley and Deturck1998; Rockwell et al., Reference Rockwell, Buller and Burgoon1997a, Reference Rockwell, Buller and Burgoon1997b; Vrij et al., Reference Vrij, Edward and Bull2001; Walczyk et al., Reference Walczyk, Roper, Seemann and Humphrey2003). The use of picture naming is also a major difference between our experiment and past research. While the picture-naming task is certainly less ecologically valid than a conversation-like task, it is much easier to tightly control the picture-naming task for the psycholinguistic properties of the stimuli, and for the task demands. Both of these are important factors in L2 production performance. Testing deception at the word level enables us to pinpoint the mechanism at the core of deception performance; that is, performance on our task depends on activating the correct answer and then inhibiting it as a false answer is fabricated. It is possible that words are more susceptible to the double stressor effect than longer phrases, at least for reaction time.
It also is possible that the between-groups design of the current study versus the within-group design of previous studies contributed to the discrepant findings. Had we tested English-L2 bilinguals’ deception performance in both English and Spanish, we may have found that the differences between truth and lie trials were similar in size for their two languages. One significant advantage to our approach is that we were able to test all participants in the same language, on exactly the same task, and thus were able to control for item-level effects, such as lexical frequency, phonotactic probability, polysemy, and so on, which can significantly impact processing times. It is challenging to match stimuli on all these parameters across languages, thus complicating the interpretation of findings related to cross-linguistic differences. We therefore conclude that the difference in levels of English proficiency between the groups in the present study was at the root of our findings.
At the same time, it is possible that the English-L2 bilingual group was too proficient in English since their average English vocabulary scores were close to the average score for native speakers. However, they did struggle with the task more than the native speakers, as reflected in their slower reaction times. Nevertheless, it is likely that bilinguals with lower levels of L2 proficiency would show a magnified effect of deception compared to monolinguals. It is an open question whether such a manipulation might also yield an effect of deception on other acoustic parameters that were the focus in the present study.
We found that average intensity was not a reliable cue to deception in our study, although it is important to point out that the distance between the speaker and the microphone varied freely in the present study, and it is possible that with a fixed distance, a different result would be obtained. At the same time, not finding an effect of deception on intensity fits well with previous work indicating that speech intensity is not a common indicator of emotional stress (Anolli & Ciceri, Reference Anolli and Ciceri1997; Kirchübel & Howard, Reference Kirchhübel and Howard2013; Rockwell et al., Reference Rockwell, Buller and Burgoon1997a, Reference Rockwell, Buller and Burgoon1997b). However, unlike prior studies (Anolli & Ciceri, Reference Anolli and Ciceri1997; DePaulo et al., Reference DePaulo, Lindsay, Malone, Muhlenbruck, Charlton and Cooper2003; Ekman et al., Reference Ekman, O’Sullivan, Friesen and Scherer1991; Streeter et al., Reference Streeter, Krauss, Geller, Olson and Apple1977), we also did not find fundamental frequency to be an indicator of deception. This hints at the possibility that our participants may not have been emotionally engaged in the task. While concrete nouns are well suited to the picture-naming task we have used, the addition of words associated with strong emotion may have yielded more robust differences between truth and lie trials across all groups of participants and for a wider range of acoustic cues. In the current study, the stimulus words were not emotional triggers, and the consequences of being caught in a lie were not detrimental. Our participants were given an incentive for producing good lies, but there were no negative consequences for not producing convincing lies. Therefore, anxiety about being caught may not have been as heightened, and did not lead to differences in fundamental frequency. In contrast, in DePaulo et al. (Reference DePaulo, Lindsay, Malone, Muhlenbruck, Charlton and Cooper2003)’s meta-analysis on average pitch/frequency was higher during lies than truths, but this was only the case for studies where there was a strong motivation to lie.
Our finding that variance in frequency and intensity was lower for lie trials also goes against previous findings (Anolli & Ciceri, Reference Anolli and Ciceri1997; Rockwell et al., Reference Rockwell, Buller and Burgoon1997a). This is likely due to the nature of our task, where truth and lie trials were intermixed. A strategy that some participants adopted was to repeat previous truths when given a lie trial. For example, if they saw a picture of “house” on a truth trial, they used “house” as a lie a few trials later. A post hoc analysis revealed that about 25% of all lie answers came from the set of truth stimuli and that the strategy was used to a similar degree in all three groups, χ2(2) = 2.86, p = .24. This led to their lies consistently being different words, but being repetitions of previous answers. The repetition may have been produced with a more stable fundamental frequency and intensity, leading to lower variance for lie trials.
One additional consideration in interpreting our results relates to the effect sizes of deception data. Effect sizes of cues to deception in the literature are known to be overestimated due to publication bias and low power (Luke, Reference Luke2019). In line with this consideration, we have presented the findings for all of the acoustic measures we examined, despite many of them not differentiating truth and lies. We have also calculated effect sizes that could be captured by our models using the online PANGEA calculator (Westfall, Reference Westfall2015). The calculations indicated than a d above 0.31 for the effect of condition, above 0.46 for the effect of group, and above 0.38 for the interaction between group and condition could be detected by our models. The effect sizes for the main finding of our manuscript, the model for reaction time, were all above the predicted d, except for the interaction between group and condition when comparing the monolingual and English L1 group. The effect of condition for the speech rate model was also above the predicted d for all groups, but lower for the other effects. The effect sizes for most other models would be classified as small (d < 0.20). It is important to note that while we may not have had sufficient power to detect subtle effects in our data, the group differences we observed in our main findings of reaction time were quite robust.
Conclusion
In conclusion, the results of our study are consistent with previous findings that deception in an L2 leads to cue disclosure of a larger magnitude than deception in an L1. This is likely a result of lower proficiency in an L2 in combination with increased cognitive and/or emotional load associated with speaking the L2. This load is greater when asked to deceive in an L2 than when asked to tell the truth. We did not, however, find that either bilingual group disclosed a greater number of cues to deception than the other. To differentiate the effects related to deception from the effects related to L2 speech, future research would need to test other types of bilinguals in more cognitively and emotionally stressful environments. For example, many monolingual examinations of deception have attempted to test participants in assimilated criminal environments such as under questioning for an attempted crime. Given that stereotyping often comes into play in criminal environments, it is important to test if acoustic cues could be used as an unbiased cue to deception for speakers of different language backgrounds.
Acknowledgments
This work was funded NIDCD Grants R01 DC011750 and T32 DC005359, and NICHD Grant P30 HD03352. The authors would like to thank all the adults who participated in the study and the members of the Language Acquisition and Bilingualism Lab for assistance in data collection, coding, and manuscript review.
Appendix A. Stimulus list