

In September Reference Kludt2016, a Pew Research Center poll found that 55% of American voters were disgusted by the U.S. presidential election campaign (Kludt, Reference Kludt2016). A year into the Donald Trump presidency, an NBC News/Wall Street Journal poll found that “disgust” was the top answer to the question of how respondents felt about the Trump presidency (Murray, Reference Murray2018). Disgust is a basic, discrete emotion associated with the behavioral immune system. It can be elicited by various stimuli—for example, pornography, feces, or vomit, but also acts of lying and stealing (Haidt et al., Reference Haidt, Rozin, Mccauley and Imada1997; Rozin et al., Reference Rozin, Lowery, Imada and Haidt1999; Tybur et al., Reference Tybur, Lieberman and Griskevicius2009). Disgust evolved to perform three different functions: the avoidance of interaction with disease-causing organisms (pathogen avoidance), the avoidance of mates that jeopardize fitness, and the coordination of condemnation of people who violate moral standards (Tybur et al., Reference Tybur, Lieberman, Kurzban and DeScioli2013). We can understand disgust both as a state and as a trait: particular situations cause disgust responses, while at the same time, some individuals are more sensitive to disgusting environmental cues than others.
In the political domain, disgust has mostly been associated with the first function—the avoidance of pathogens. That is, pathogen avoidance is reported to correlate with negative attitudes toward immigrants (Aarøe et al., Reference Aarøe, Petersen and Arceneaux2017), gay people (Balzer & Jacobs, Reference Balzer and Jacobs2011; Smith et al., Reference Smith, Oxley, Hibbing, Alford and Hibbing2011), premarital sex (Smith et al., Reference Smith, Oxley, Hibbing, Alford and Hibbing2011), and political conservatism in general (Inbar et al., Reference Inbar, Pizarro, Iyer and Haidt2011; Smith et al., Reference Smith, Oxley, Hibbing, Alford and Hibbing2011; but see Bakker, Schumacher, et al., Reference Bakker, Lelkes and Malka2020). In our view, it is hard to see how pathogen avoidance motivates disgust against politicians in general or politicians such as Donald Trump or Hillary Clinton in particular. After all, there is no reason to assume that politicians are infected with some virus (although some people surely believe this). Instead, we propose that the third function of disgust, which signals moral violation, is a more likely explanation of disgust responses to politicians. As such, we suggest an additional, alternative role of disgust in the political domain through the route of moral violation.
We explore in this article whether people experience disgust when confronted with politicians who perpetrate moral violations. In particular, we expect that the moral dimension of disgust sensitivity is relevant here, and not, or to a lesser extent, the pathogen dimension or sexual dimension. Indeed, people are found to have similar disgust responses to moral violations and to content with pathogenic or sexual content (Cannon et al., Reference Cannon, Schnall and White2010; Chapman et al., Reference Chapman, Kim, Susskind and Anderson2009). Disgust responses to moral violations serve the purpose of coordinating actions in a conflict between two people. When observers of the conflict successfully coordinate in identifying the person who is violating moral standards, the conflict can be solved and tension will dissipate (Tybur et al., Reference Tybur, Lieberman, Kurzban and DeScioli2013). However, if observers cannot or do not coordinate, they may choose different sides and in effect produce a conflict between two groups, further aggravating the situation. Clearly, such outcomes are not beneficial for the survival of individuals and groups (Tybur et al., Reference Tybur, Lieberman, Kurzban and DeScioli2013). Using facial displays (i.e., through the activation of the levator labii muscle), individuals can coordinate their disgust and quickly identify the person who violated moral standards (Vrana, Reference Vrana1993; Whitton et al., Reference Whitton, Henry, Rendell and Grisham2014). Acts of indirect aggression, in the form of social exclusion and reputational attacks, are subsequently used to restore order (Molho et al., Reference Molho, Tybur, Güler, Balliet and Hofmann2017).
Modern political campaigns are rife with accusations of lying, cheating, and bribery (Dolezal et al., Reference Dolezal, Ennser-Jedenastik and Müller2016; Elmelund-Præstekær, Reference Elmelund-Præstekær2010; Hopmann et al., Reference Hopmann, Vliegenthart and Maier2018; Nai, Reference Nai2018; Soroka, Reference Soroka2014; Walter, Reference Walter2014). During the 2016 U.S. presidential campaign, Donald Trump rarely referred to Hillary Clinton without calling her a liar or labeling her as “crooked” (see, e.g., Associated Press, 2016; CNN, 2016). The 2016 presidential election was not a case on its own. Especially when negative campaigns become uncivil, accusations of moral violations by the other become common (Brooks & Geer, Reference Brooks and Geer2007; Fridkin et al., Reference Fridkin, Kenney and Woodall2009; Mutz, Reference Mutz, Nivola and Brady2006; Mutz & Reeves, Reference Mutz and Reeves2005). Politicians from the other party are identified as cheaters and liars, as individuals who violate moral standards (Kenski et al., Reference Kenski, Filer and Conway-Silva2018; Sobieraj & Berry, Reference Sobieraj and Berry2011). This frame of moral transgressions should then elicit disgust responses. There is some indirect evidence for this expectation. People self-report that they are disgusted by actions they find morally wrong, such as stealing the purse of a blind person (Hutcherson & Gross, Reference Hutcherson and Gross2011; Nabi, Reference Nabi2002). When people receive an unfair offer in an ultimatum game, they experience more activity of the levator labii (Chapman et al., Reference Chapman, Kim, Susskind and Anderson2009), a muscle associated with physiological disgust. When people listen to messages that describe dishonest behavior, they also experience more labii activity (Cannon et al., Reference Cannon, Schnall and White2010). These examples of moral violations produce moral disgust responses. We expect this to extend to moral violations in the political domain, too.
We believe, however, that individuals do not respond evenhandedly to accusations of moral violations targeted at politicians. In a time of increasing affective polarization (Iyengar et al., Reference Iyengar, Sood and Lelkes2012; Westwood et al., Reference Westwood, Iyengar, Walgrave, Leonisio, Miller and Strijbis2018), a large part of the population strongly identifies with a political in-party (e.g., Democratic) and therefore also has a specific other political out-party (e.g., Republican) (Huddy et al., Reference Huddy, Mason and Aarøe2015). Despite our examples, strong positive feelings for the political in-party and strong negative feelings for the political out-party are not uniquely American but are pervasive in Europe, too (Bakker, Lelkes, & Malka, Reference Bakker, Lelkes and Malka2020; Bankert et al., Reference Bankert, Huddy and Rosema2017; Huddy et al., Reference Huddy, Bankert and Davies2018; Westwood et al., Reference Westwood, Iyengar, Walgrave, Leonisio, Miller and Strijbis2018). Because of these strong identities, disgust responses to out-party politicians are perhaps almost baked in because they—and their party—are so often criticized for moral transgressions by the in-party. In this situation, mere exposure to an out-party politician may already trigger associations with moral transgressions and elicit a disgust response.
This expectation may be too bold. People may have lots of different associations with out-party leaders and in-party leaders. Exposing people simultaneously to a leader and an accusation of moral transgressions should make this link more salient and elicit disgust responses. Still, we expect that partisans do not respond the same to a message critiquing their leader as they would to a message critiquing the “other” leader. How different is, however, open for debate.
On the one hand, we know that people reject information if it does not support their worldview and easily accept information that is in line with their worldview (Taber & Lodge, Reference Taber and Lodge2006). From that perspective, we expect that partisans are easily disgusted by rhetoric placating the “other” leader as a violator of moral standards, because it is in line with their worldview. Conversely, they might ignore any rhetoric against their own leader.
On the other hand, confirming negative information (i.e., a moral violation) about an out-party politician is not likely to elicit a strong emotional response. After all, we are just telling the in-party supporters something they already know. Instead, calling the in-party leader out as a violator of moral standards may elicit a much stronger emotional response. The evolutionary function of disgust in the moral domain is primarily aimed at resolving intragroup differences and maintaining intragroup peace (Tybur et al., Reference Tybur, Lieberman, Kurzban and DeScioli2013). Therefore, moral violations by a group member (i.e., a betrayal) may elicit a much stronger response and motivate stronger punitive actions.
In sum, we identify three hypotheses:
-
• H1: Out-party politicians should elicit stronger disgust responses than in-party politicians.
-
• H2a: Out-party politicians accused of moral violations should elicit stronger disgust responses than in-party politicians accused of moral violations.
-
• H2b: In-party politicians accused of moral violations should elicit stronger disgust responses than out-party politicians accused of moral violations.
In addition, we expect that disgust responses to our treatments are also influenced by the strength of party identification and to disgust sensitivity as an individual difference. Finally, we explore how self-reported and physiological disgust responses may differ in terms of the hypothesized effects. We explore these theoretical issues in the next sections.
Covariate 1: Strength of party identification
It is unlikely that all people will respond to violations of in-party and out-party politicians to the same extent. Partisanship is most likely an important factor shaping the response to moral violations. Recent research shows the expressive notions of partisanship (e.g., Huddy et al., Reference Huddy, Mason and Aarøe2015) whereby party identification should be seen as a social group attachment akin to a tribal affiliation. People who identify with a social group vary in their strength of social identification with this group (Bankert et al., Reference Bankert, Huddy and Rosema2017). The strength of social identification with a party better predicts political activity than substantive issue stances, ideological intensity, and simple partisan self-placement (Bankert et al., Reference Bankert, Huddy and Rosema2017). Bakker, Lelkes, and Malka (Reference Bakker, Lelkes and Malka2020) found that those with a stronger partisan social identification were more likely to follow party cues when they had higher cognitive resources. Arceneaux and Vander Wielen (Reference Arceneaux and Vander Wielen2017) showed that people high in need for affect—that is, individuals who are motivated to feel strong emotions—and low in need for cognition were more likely to follow party cues.
In sum, strong partisans have strong positive affective tags with the in-party leader and negative affective tags with the out-party leader (Lodge & Taber, Reference Lodge and Taber2005). In highly polarized political contexts, such as the Netherlands, we expect strong partisans to already associate the out-party leader with moral violations. Therefore, additionally priming them with moral violations by the out-party leader will not increase the already strong response. We hypothesize that strong partisans should have stronger disgust responses to out-party leaders than to in-party leaders compared with weak partisans (H3).
Covariate 2: Disgust as individual difference
Our hypotheses concern a specific state that elicits disgust. Yet the literature we have discussed places equal, or perhaps more, importance on treating disgust as an individual difference (Rozin et al., Reference Rozin, Lowery, Imada and Haidt1999; Tybur et al., Reference Tybur, Lieberman and Griskevicius2009). In particular, Tybur and coauthors (Reference Tybur, Lieberman and Griskevicius2009) identified three domains of individual differences in disgust sensitivity. These are similar to the three functions of disgust we discussed before (disgust sensitivity to pathogens, sexual acts, and immoral behavior). We expect disgust sensitive people to have stronger responses to moral violations than people who score low on disgust sensitivity. We hypothesize that individuals higher on moral disgust sensitivity, compared with those lower on moral disgust sensitivity, should have a stronger disgust response to our moral violation treatments (H4).
Two different disgust responses
What do we mean by disgust responses? An emotion like disgust most likely originates from a multilevel response system that consists of experiences of the feeling of disgust, physiological changes in the individual, and particular behavioral action tendencies (Lang, Reference Lang2014). We will analyze the physiological and experiential self-reported responses, and initially we have formulated similar expectations for each type of emotional response. However, there are reasons to believe that the physiological and experiential responses do not result in a singular multimodal disgust response. Therefore, we propose ex ante explanations of what differences in physiological and experiential responses mean.
According to the seminal James-Lange theory of emotion, discrete emotions should have discrete patterns of physiological reactivity (James, Reference James1884). Therefore, physiological disgust response should match experiential disgust responses. However, there is not a universally accepted list of discrete emotions that are one-on-one associated with specific physiological patterns (Kreibig, Reference Kreibig2010; Lang, Reference Lang2014; Lang et al., Reference Lang, Greenwald, Bradley and Hamm1993). Generally, physiological arousal and self-reported feelings to stimuli that should be negative (threatening, disgusting) do not correlate very highly with each other (Lang et al., Reference Lang, Greenwald, Bradley and Hamm1993; Stark, Walter, et al., Reference Stark, Schienle, Sarlo, Palomba, Walter and Vaitl2005; Vrana, Reference Vrana1993). Nor do these measures align with behavioral responses (Lang et al., Reference Lang, Greenwald, Bradley and Hamm1993). At best, physiological reactions to emotional stimuli and self-reports (experiential) of affective states are weakly correlated (Chapman et al., Reference Chapman, Kim, Susskind and Anderson2009; Schaefer et al., Reference Schaefer, Larson, Davidson and Coan2014).
Why are physiological and experiential responses weakly correlated? There are two perspectives relevant here. First, some emotion researchers question whether physiological responses are reliable predictors of emotions (LeDoux & Pine, Reference LeDoux and Pine2016). If physiological responses are not valid, then there is no reason to expect concordance with experiential responses. Yet there is evidence that disgusting stimuli evoke physiological responses such as an increase in the activity of the levator labii muscle in the face (Cannon et al., Reference Cannon, Schnall and White2010; Chapman et al., Reference Chapman, Kim, Susskind and Anderson2009; Vrana, Reference Vrana1993) and an increase in arousal (Aarøe et al., Reference Aarøe, Petersen and Arceneaux2017; Smith et al., Reference Smith, Oxley, Hibbing, Alford and Hibbing2011). Our study contains a “manipulation check”: we show people a series of disgusting images and test whether we observe increased labii activity in response to these images.
A second perspective puts forward that people process emotions on conscious and nonconscious levels (Evers et al., Reference Evers, Hopp, Gross, Fischer, Manstead and Mauss2014). This perspective builds on dual process theories, which posit that “automatic responses are relatively unconscious, fast, and efficient, while reflective responses are relatively conscious, deliberate, and effortful” (Evers et al., Reference Evers, Hopp, Gross, Fischer, Manstead and Mauss2014, p. 44). The automatic system is fast and “requires little or no cognitive effort and has a low threshold for processing incoming information,” while the reflective system operates slowly and requires effort (Evers et al., Reference Evers, Hopp, Gross, Fischer, Manstead and Mauss2014, p. 44). Evers and colleagues (Reference Evers, Hopp, Gross, Fischer, Manstead and Mauss2014) showed that convergence between responses within each of the two systems is larger compared with the coherence in responses between the two systems. Therefore, there is not much reason to expect strong associations between physiological and experiential responses.
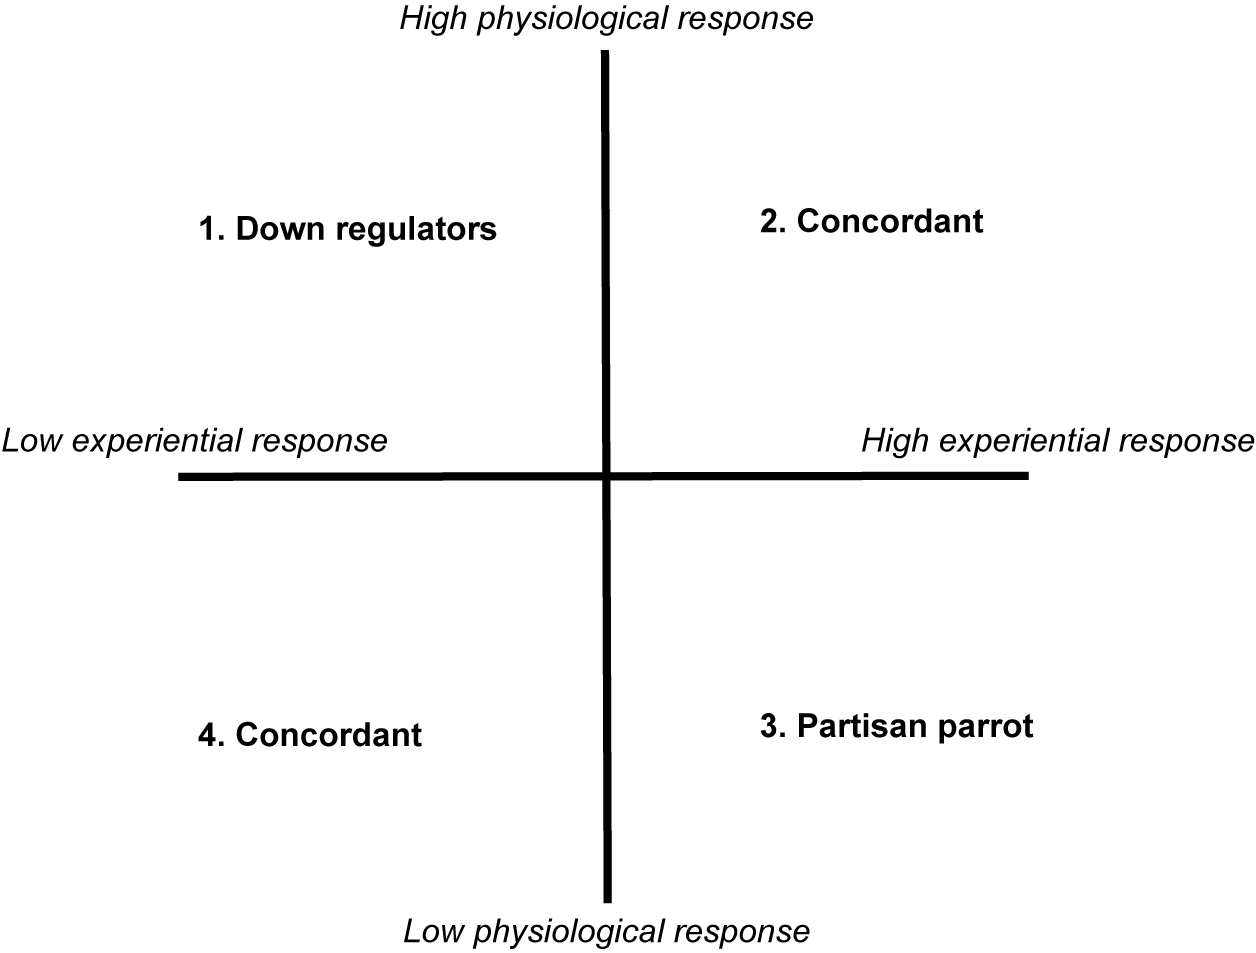
The latter perspective—based on the broader theoretical model outlined by Arceneaux and Bakker (Reference Arceneaux and Bakker2019)—leads us to four possible observations regarding the observed concordance or disconcordance between physiological and experiential responses. We summarize these in the theoretical model in Figure 1.
Theoretical predictions for concordance between experiential and physiological responses. This figure is inspired by a theoretical model outlined by Arceneaux and Bakker (Reference Arceneaux and Bakker2019).

The hypotheses we formulated assume that people are in quadrant 2 or 4. Starting with quadrant 2, these people report a strong experiential response and show a strong physiological response. The responses of these people are concordant (quadrant 2). The concordance between the physiological and experiential responses may happen when the physiological responses pass a critical threshold that motivates alignment among cognitive and behavioral components (Evers et al., Reference Evers, Hopp, Gross, Fischer, Manstead and Mauss2014; Schaefer et al., Reference Schaefer, Larson, Davidson and Coan2014). For instance, there is strong concordance between the physiological responses to stimuli containing spiders or snakes among people who are very fearful (phobic) of spider or snakes (Hofmann & Kim, Reference Hofmann and Kim2006; Stark, Schienle, et al., Reference Stark, Schienle, Sarlo, Palomba, Walter and Vaitl2005; but see Stark, Walter, et al., Reference Stark, Schienle, Sarlo, Palomba, Walter and Vaitl2005). Therefore, one possibility—also reflected in H4—is that we only observe concordance between physiological measures and experiential measures of disgust when people score higher on moral disgust.
Another form of concordance is observed for people who experience a weak experiential response and a weak physiological response (quadrant 4). They are simply not responding to the moral violations of politicians.
Yet, as our discussion of the two systems of emotions (see, Evers et al., Reference Evers, Hopp, Gross, Fischer, Manstead and Mauss2014) suggests, in reaction to moral violations by politicians there might be disconcordance between the experiential and physiological responses. These possibilities are reflected in the two remaining quadrants in Figure 1. In quadrant 3 of Figure 1, there are people who report strong experiential responses but weak physiological responses. These people are “partisan parrots.” That is, people follow cues from the party (leadership) they support (Bakker, Lelkes, & Malka, Reference Bakker, Schumacher, Gothreau and Arceneaux2020; Kam, Reference Kam2005; Petersen et al., Reference Petersen, Skov, Serritzlew and Ramsøy2013). As such, they simply echo the sentiments they hear, but they do not actually have any affective (unconscious) response to the moral transgressions stimuli. This means that people report disgust experience, but this is simply a case of sticking to their group rather than being physiologically disgusted.
Finally, in quadrant 1 of Figure 1, there are people who respond physiologically to moral violations but do not report any experiential emotions. These people have, consciously or unconsciously, down-regulated their physiological experiences (Butler et al., Reference Butler, Gross and Barnard2014).
Research design
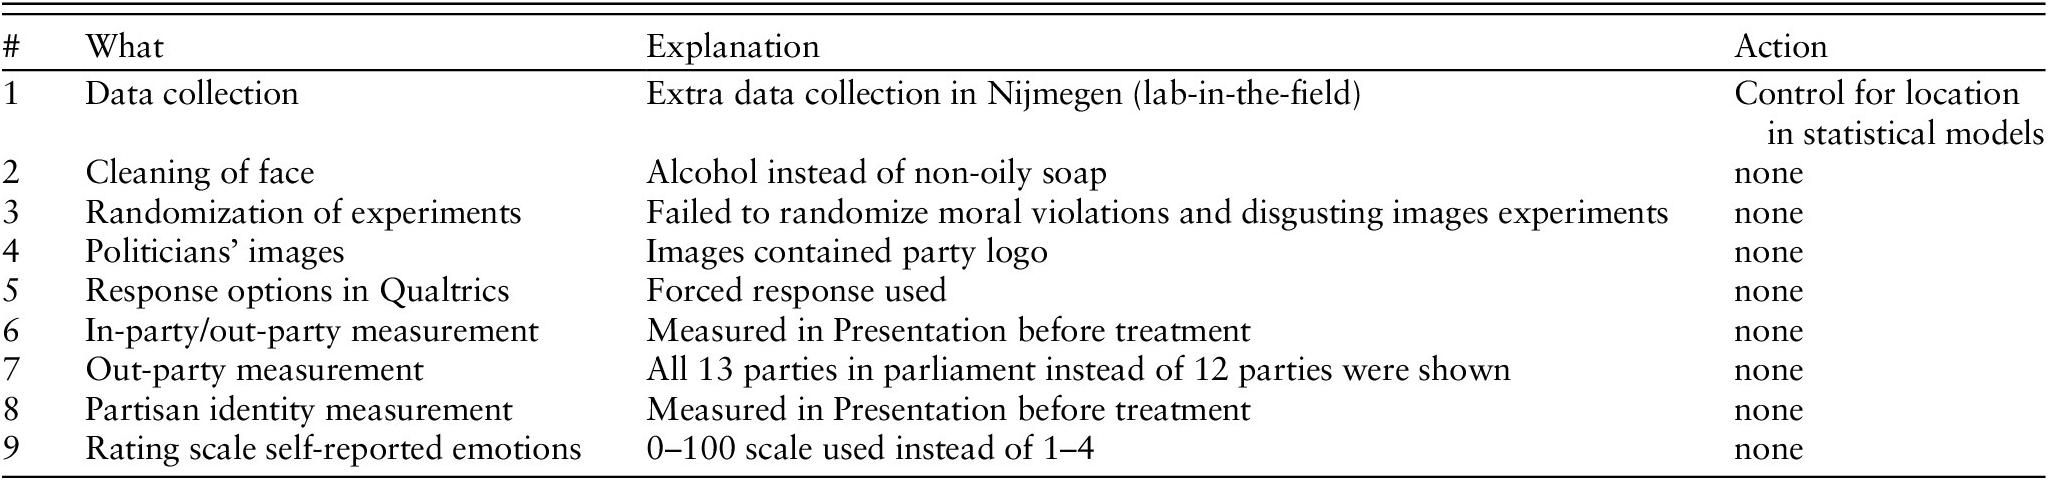
We conducted an experiment in our physiology lab at a large university in the Netherlands and tested our hypotheses using a within-subjects design. This paper was a registered report, and our peer-reviewed In Principle Acceptance Stage 1 submission can be found here: https://osf.io/7h3ju. Deviations from Stage 1 can be found in Table 1 and are discussed in the text.
Deviations from Stage 1 registered report.

Sample
To decide the number of participants, we evaluated our model following the DeclareDesign model (Blair et al., Reference Blair, Cooper, Coppock and Humphreys2019). We estimate the difference between the disgust response in the in-party treatment and out-party treatment in the presence of covariates that potentially influence the levels of the outcome variable. We expect a small effect size, a Cohen’s d of .2. This is based on earlier studies (Arceneaux et al., Reference Arceneaux, Dunaway and Soroka2018; Dodd et al., Reference Dodd, Balzer, Jacobs, Gruszczynski, Smith and Hibbing2012; Oxley et al., Reference Oxley, Smith, Alford, Hibbing, Miller, Scalora and Hibbing2008; Smith et al., Reference Smith, Oxley, Hibbing, Alford and Hibbing2011). We expect a high correlation between individual responses (r = .8). Based on this, we calculated that 80 respondents give acceptable power (0.95), conventional alpha level (.05), and sampling bias (0.00). Based on our earlier experiences using physiological data (Bakker, Schumacher, et al., Reference Bakker, Schumacher, Gothreau and Arceneaux2020), we aimed to collect responses from at least 100 respondents to allow for some drop-out and failed physiological readings (electrodes that fall off, etc.). Code to replicate our power analysis is provided on our OSF page (https://osf.io/tp7yn).
Using an online portal, we recruited participants from a diverse pool of students and locals for a 45-minute experiment. Participants received €7.50 or 1 research credit for their participation. We collected data between November 12, 2019, and December 13, 2019; 65 participants completed the study. Aside from this preregistered mode of data collection, we also collected data during a public festival, the InScience Festival (https://www.insciencefestival.nl/en/festival/) in Nijmegen (the Netherlands), between November 7 and November 10, 2019 (deviation 1 from Stage 1; see Table 1). There, 43 participants completed the study. For details of the two data collection modes and the differences, see Appendix A.1. Our sample thus consists of 108 respondents and is sufficiently powered.
Procedure
Upon signing the informed consent form, a trained lab assistant first cleaned parts of the participant’s face with water and an alcohol swab with 70% isopropyl alcohol (Brand: Romed) to clean the skin—this is contrary to the non-oily soap we preregistered to use (see Table 1, row 2). Next, participants started with a survey battery containing measures of our moderators as well as a set of covariates (see measures). In the lab, this was done on a computer, while in the lab-in-the-field, this was done using an iPad.
Upon completion of the pre-test, a trained lab assistant connected participants to the physiological equipment. This was followed by the moral violations experiment and the visual disgust images. We preregistered to randomize the order of the two experiments to account for any spillover effects, but as a result of a human error in our script, the moral violations experiment was always shown first.
Moral violations experiment
In the moral violations experiment, all participants were exposed to four treatments: the in-party politician image, the in-party politician image plus moral violation text, the out-party politician image, and the out-party politician image plus moral violation text. In all four conditions, we used images of the party leader. For the in-party and out-party politicians, we used the images of the party leaders with a white background and of the same size. Note that Sybrand Buma of the Christian Democratic Appeal (CDA) resigned, but the CDA had not yet appointed a new party leader when we started data collection. Buma is arguably the most prominent politician of this party. Therefore, we included his image in the experiment. Contrary to our preregistration, the images also contained the party logo (see Table 1, row 4).
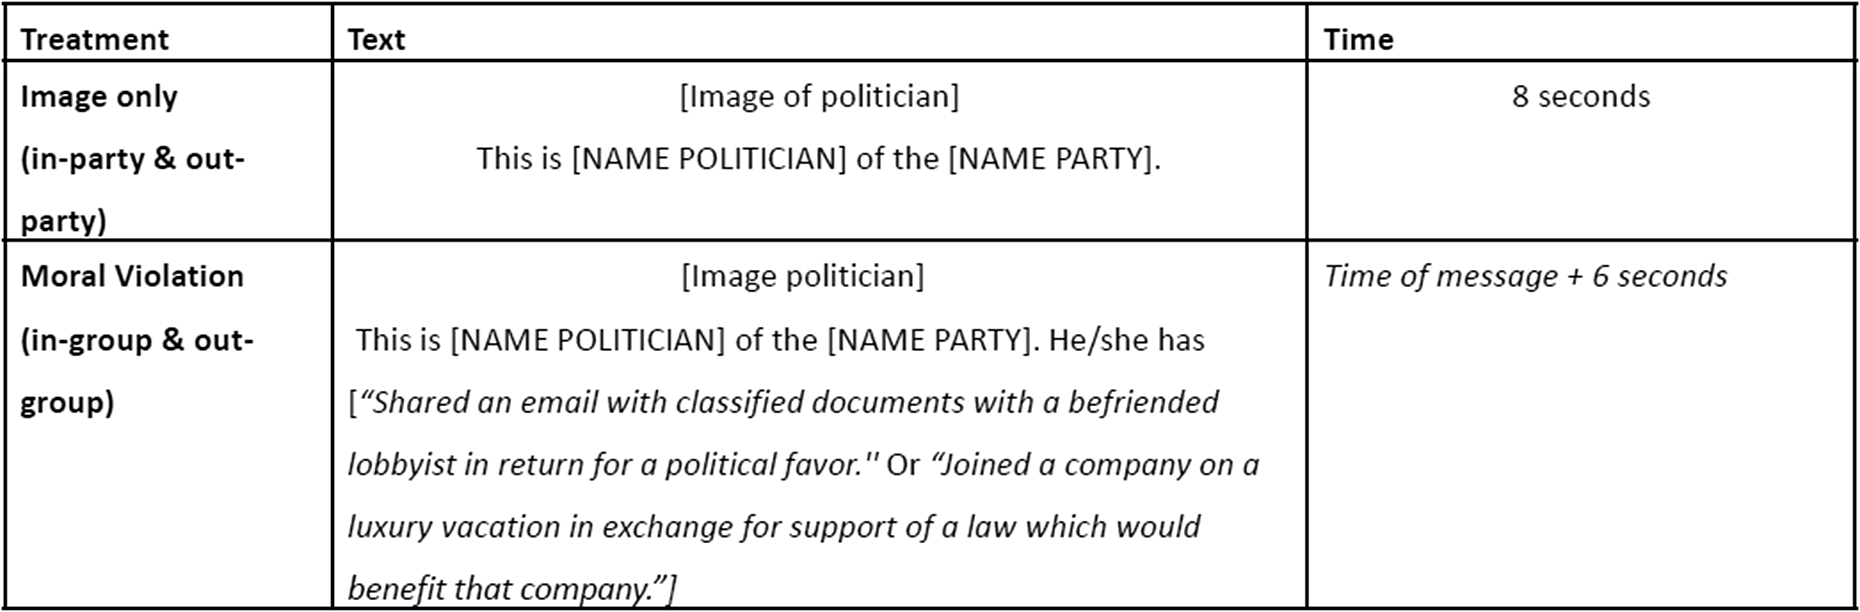
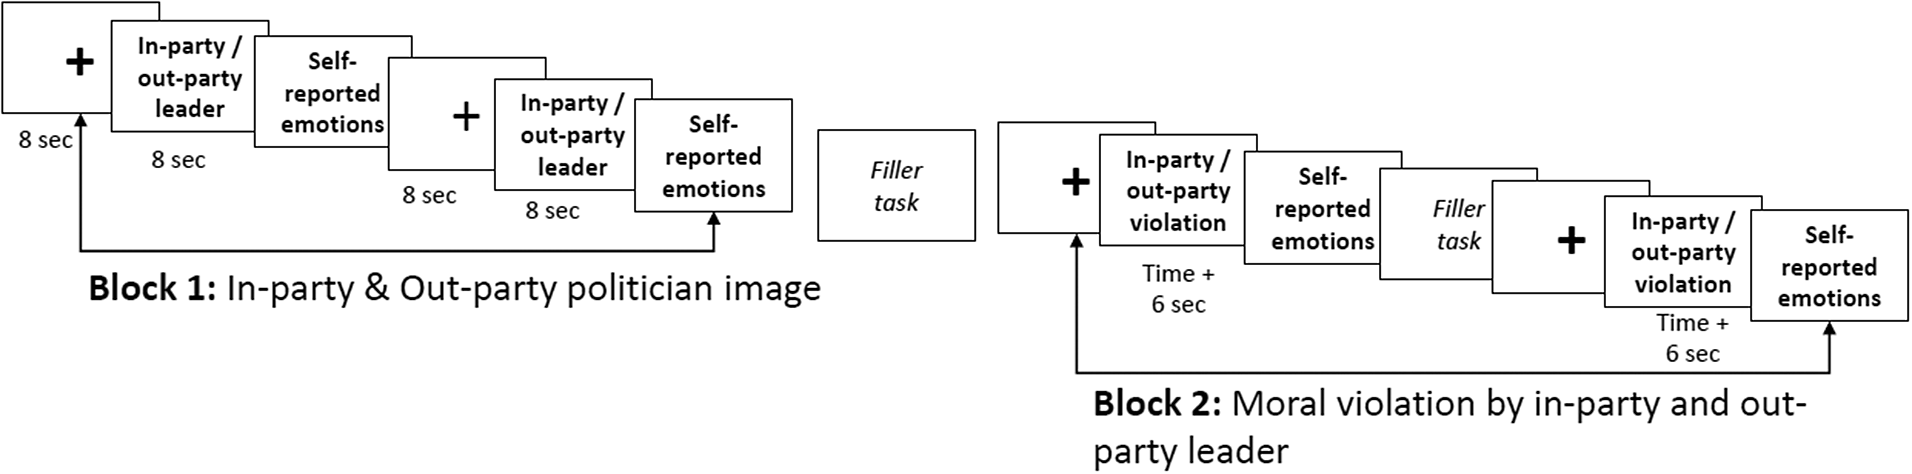
In the moral violations conditions, we used two moral violations: (1) “Shared an email with classified documents with a befriended lobbyist in return for a political favor” and (2) “Joined a company on a luxury vacation in exchange for support of a law which would benefit that company.” These moral violations were selected based on the results of a pre-test conducted in January 2019 (see Appendix A.2). Respondents saw both moral violations, once for the in-party, once for the out-party. The order was randomized. Figure 3 provides a schematic overview of the moral violations experiment.
The experiment started with a blank screen with a black plus sign in the middle—the interstimulus interval (ISI), which always lasted for 8 seconds (see also, Codispoti et al., Reference Codispoti, Bradley and Lang2001). Respondents first saw the images of the in-party and out-party leaders with their name and party affiliation, in randomized order (see block 1 of Figure 3), followed by a filler task—a video of birds (https://www.youtube.com/watch?v=rX40mBb8bkU)—after which they were randomly assigned to the in-party or out-party politician with the moral violations text (see Figure 3). This was followed by another filler task—a video of whales (https://www.youtube.com/watch?v=glxULceEEjA)—after which they were again assigned to a politician with the moral violations text.
Participants were exposed to the message on the screen while they listened to the message via noise-canceling headphones (a speech actor recorded all messages) and saw the message on the screen at the same time (see also Cannon et al., Reference Cannon, Schnall and White2010). Note that the treatments in block 2 (moral violations) are a little longer: the time it takes to pronounce the moral violation (see Figure 2 plus 6 seconds). We took the longest treatment plus 6 seconds as the time of exposure. We added 6 seconds because physiological responses to stimuli are often seen within that time period (Brown, Bradley, & Lang, Reference Brown, Bradley and Lang2006). In all conditions, we measured participants’ physiological responses and asked participants to self-report their emotions (see Measures).
Schematic outline of treatments.

Schematic outline of moral violations experiment.

In-party and out-party assignment
The Netherlands is a multiparty system with 13 parties in parliament. Manipulating the in-party (i.e., the party one supports) and out-party (i.e., a party one does not support) is a daunting task compared with studies conducted in political contexts in which there are only two political parties (Bakker, Lelkes, & Malka, Reference Bakker, Lelkes and Malka2020; Bullock, Reference Bullock2011; Kam, Reference Kam2005). One approach is to use only the major center-left and major center-right party (Bisgaard & Slothuus, Reference Bisgaard and Slothuus2018; Petersen et al., Reference Petersen, Skov, Serritzlew and Ramsøy2013). We opted for a different approach because (a) the Netherlands does not have an indisputable “major” party on the left or on the right, and because (b) in a system in which party positions differ on both the left-right and the progressive-conservatism dimension, it is not automatically clear what the logical “out-party” is. For instance, a supporter of the liberal People’s Party for Freedom and Democracy (VVD, a major party on the right) might see the progressive Greens (GroenLinks) or the left-wing Socialist Party as the out-party. Therefore, we refrained from a rather arbitrary selection of 2 out of the 13 parties. Instead, we asked participants what party they were most likely to vote for if elections were held and designated that as their “in-party.” We also asked them which party they would be most unlikely to vote for if elections were held and designated that party as their “out-party” (see measures).
Visual disgust images
Here we exposed participants to a series of images. First, we always showed participants a neutral image of a basket (7010) taken from the International Affective Picture System (IAPS) (Lang et al., Reference Lang, Bradley and Cuthbert1997). Next, participants were randomly exposed to six images. Three images—used by Smith et al. (Reference Smith, Oxley, Hibbing, Alford and Hibbing2011) and Bakker, Schumacher, et al. (Reference Bakker, Lelkes and Malka2020)—were used to measure disgust sensitivity (“man eating worms,” “human excrement in toilet,” “vomit”), and three neutral IAPS images of a spoon (7004), mug (7035), and lamp (7175) were used. We showed a blank screen with a plus sign for 8 seconds, followed by one of the randomly drawn six images shown for 8 seconds (Codispoti et al., Reference Codispoti, Bradley and Lang2001). After each image, respondents were asked how “disgusted” they were (see Measures).
Measures
In the pre-test survey, we measured socioeconomic background variables (age, gender, level of education, student status, and political knowledge) as well as disgust sensitivity. At the start of the survey, we also measured the temperature in the room in degrees Celsius. The measures of the socioeconomic background variables are discussed in detail in Appendix B.1. This appendix also contains the descriptive statistics.
Disgust sensitivity
Disgust sensitivity was measured using the Dutch version of the “three-domain disgust scale” (Tybur & de Vries, Reference Tybur and de Vries2013), which taps into pathogen (seven items), animal (seven items), and moral disgust (seven items) using items such as “Forging someone’s signature on a legal document,” which participants answer on a scale from 0, “not at all disgusting,” to 6, “extremely disgusting.” The items load highly on the designated latent dimension, each scale is internally consistent, and the three subdimensions are correlated with each other (see Appendix B.2). We created for each dimension a summated scale that we standardized (z-transformation).
In-party and out-party
Contrary to our Stage 1 submission, we measured the in-party and out-party assignment not in the pre-test (using Qualtrics) but at the start of the physiological experiment. We did so because it turned out to be impossible to use Qualtrics responses as input for the randomization in the physiological experiment that runs on Presentation. At the start of the physiological experiment, we measured which party participants supported (i.e., their in-party) by asking, “Which of the following parties has the highest probability of receiving your vote during the next national elections?” Participants could choose from a list of the 13 parties currently in the Dutch parliament. To measure the out-party, we asked participants, “Which party will certainly NOT receive your vote during the next national elections?” Participants could choose from the 13 parties currently in the Dutch parliament. This was different from what we preregistered, where we stated that participants could choose from the 12 other parties that were currently in the Dutch parliament (see Table 1).
Partisan social identity strength
Contrary to our Stage 1 submission, we did not measure this in Qualtrics but in a physiological experiment immediately after in-party and out-party support. We measured partisan social identification strength using the validated Dutch version introduced by Bankert et al. (Reference Bankert, Huddy and Rosema2017). The party that the participant was likely to vote for (see in-party) was used as the party for which we asked the eight items tapping into partisan social identity strength. A sample item is, “When I speak about the [NAME PARTY], I usually say ‘we’ instead of ‘they.’” This item was scored using a Likert-type scale ranging from “strongly disagree” (1) to “strongly agree” (4). We checked the internal consistency of the scale (see Appendix B) and averaged the eight items and standardized the partisan social identity strength scale.
Physiological measures
We measured activity of the levator labii superioris using facial electromyography at 1000 Hz. The levator labii is a facial muscle that is activated when people experience disgust (Whitton et al., Reference Whitton, Henry, Rendell and Grisham2014). We also measured the activity of the corrugator supercilii—the muscle above the eyebrow—which has been shown to be a sensitivity marker of negative affect (Bolls et al., Reference Bolls, Lang and Potter2001; Tassinary et al., Reference Tassinary, Cacioppo, Vanman, Cacioppo, Tassinary and Berntson2007). As a robustness check, we measured skin conductance level (SCL) as a measure of arousal (Arceneaux et al., Reference Arceneaux, Dunaway and Soroka2018; Smith et al., Reference Smith, Oxley, Hibbing, Alford and Hibbing2011; Soroka & McAdams, Reference Soroka and McAdams2015).
We created an index of labii activity in response to the treatments following the procedures outlined by Brown et al. (Reference Brown, Bradley and Lang2006). We subtracted labii activity per 500 milliseconds (j) during the treatment (T) from the labii response in the last second (k) of the interstimulus interval (Labii(ISI)). The index of labii sensitivity per individual in each treatment (LabiiiT) is the mean change in labii activity over the specified time in the treatment following Equation 1. Note that for images in block 1 (see Figure 2, row 1, column 3), we look at the first 6 seconds after stimulus onset. For the images plus moral violation conditions, we calculate the labii activity over the time of the treatment plus 6 seconds (see Figure 2, row 2, column 3).
The index of corrugator activity was created in the same way as the labii.
 $$ {Labii}_{iT}=\frac{\sum j=1,2,3\dots N( Labii{(T)}_{ij}- Labii{(ISI)}_{ik})}{N} $$
The index for skin conductance responses followed a slightly different procedure. In the treatments in which we showed only the image of the politician, we took the average of the natural log of SCL, which were measured in microsiemens, from the second to the sixth second after the onset of the target image (T) and then subtracted the average of the natural log of the last 500 milliseconds of the SCL in the ISI (i.e., a baseline SCL) using Equation 2. In the treatments in which we showed the image of the politician with the moral violation, we calculated the index of threat sensitivity using a modified version of Equation 2, so that we took the average of the natural log of SCL from the 2 seconds after stimulus onset until 6 seconds after the treatment ended.
 $$ EDR{\left[1\right]}_i=\frac{\begin{array}{l}{{\sum_j}_{=2,000}}^{6,000}\mathit{\ln}\left[ SCL(T) ij\right]\\ {}\quad0.6em j=2,000\end{array}}{4,000}\quad8em -\frac{{{\sum_j}_{=7,500}}^{8,000}\mathit{\ln}\left[ SCL(ISIT) ij\right]}{500} $$
Self-reported measures of emotions
In response to all four treatments, we measured self-reported disgust, anger, anxiety, and enthusiasm using three items per emotion (Marcus et al., Reference Marcus, Neuman and MacKuen2015; Nabi, Reference Nabi2002). Disgust was measured using the words “disgusted,” “grossed out,” and “repulsed”; anger using the words “angry,” “hateful,” and “bitter”; anxiety using the words “afraid,” “scared,” and “worried”; and enthusiasm with the words “hopeful,” “proud,” and “enthusiastic” (Marcus et al., Reference Marcus, Neuman and MacKuen2015; Nabi, Reference Nabi2002). For each target emotion, participants answered whether they felt this emotion “not at all” (0) to “extremely” (100). We created for each emotion a summated scale. We preregistered to standardize the scales, but we did not do this because standardized scales cannot be compared with each other (see Table 1). In Appendix B.3, we provide descriptive statistics (mean, standard deviation, Cronbach’s α) and a correlation matrix of the intercorrelations between the four emotions in response to each treatment.
Estimation strategy
Data and code availability
The raw data, codebook, scripts belonging to the experiment, and R-script to produce the results belonging to this article are available on our OSF page (https://osf.io/tp7yn/). The OSF page also contains the documents belonging to the Stage 1 submission, which can also be found here: https://osf.io/7h3ju.
Missing data
Throughout the study, participants were forced to provide an answer. This is contrary to our Stage 1 submission, in which we indicated that people would be encouraged to provide answers (see Table 1); therefore, we have no missing values in the survey data.
Exclusion criteria
Using our physiological measures, we excluded people for whom the electrodes had fallen off their faces. We also instructed our trained lab assistants to pay attention—via a camera that allowed them to unobtrusively observe the participant (we did not record participants)—to whether respondents were sitting still and not touching their faces. This would distort the measures. If this occurred, the lab assistant recorded it in the logbook and the physiological measures of this participant were not included in the analyses. Following our preregistration, we did not find any indication that missing values on the key physiological indicator of interest (the labii) were systematically associated with any of the covariates. Results can be derived from the replication files.
Control variables in our models
We control for respondents’ choice of compensation (financial, research credit, or volunteers), the temperature in the room (in degrees Celsius), gender (male set as the reference category), age (in years), education (completed level with primary school and preparatory secondary vocational jointly set as the reference category), political knowledge, and any events that happened during the study (third person entered lab, loud noises, participant was distracted) or not (dummy variable).
We also control for one characteristic of the experiment: the order within the moral violations experiment, namely, whether respondents were first exposed to the out-party violation (0) or to the in-party violation (1). Importantly, the two moral violations that we used were rated as equally moral unacceptable and negative in the pre-test (see Design section). Therefore, we do not control for the pairing of the specific moral violation to the in-party or out-party. As discussed earlier, we could not control for the order in which the moral violations experiment and the visual disgust images were shown because contrary to Stage 1, we failed to randomize the order (see Table 1). Finally, we added a control variable indicating whether the data were collected in our lab in Amsterdam or during the lab-in-the-field setting—note that the control variable was not preregistered but added because of the unexpected possibility of collecting data at another location.
Results
Preregistered manipulation check
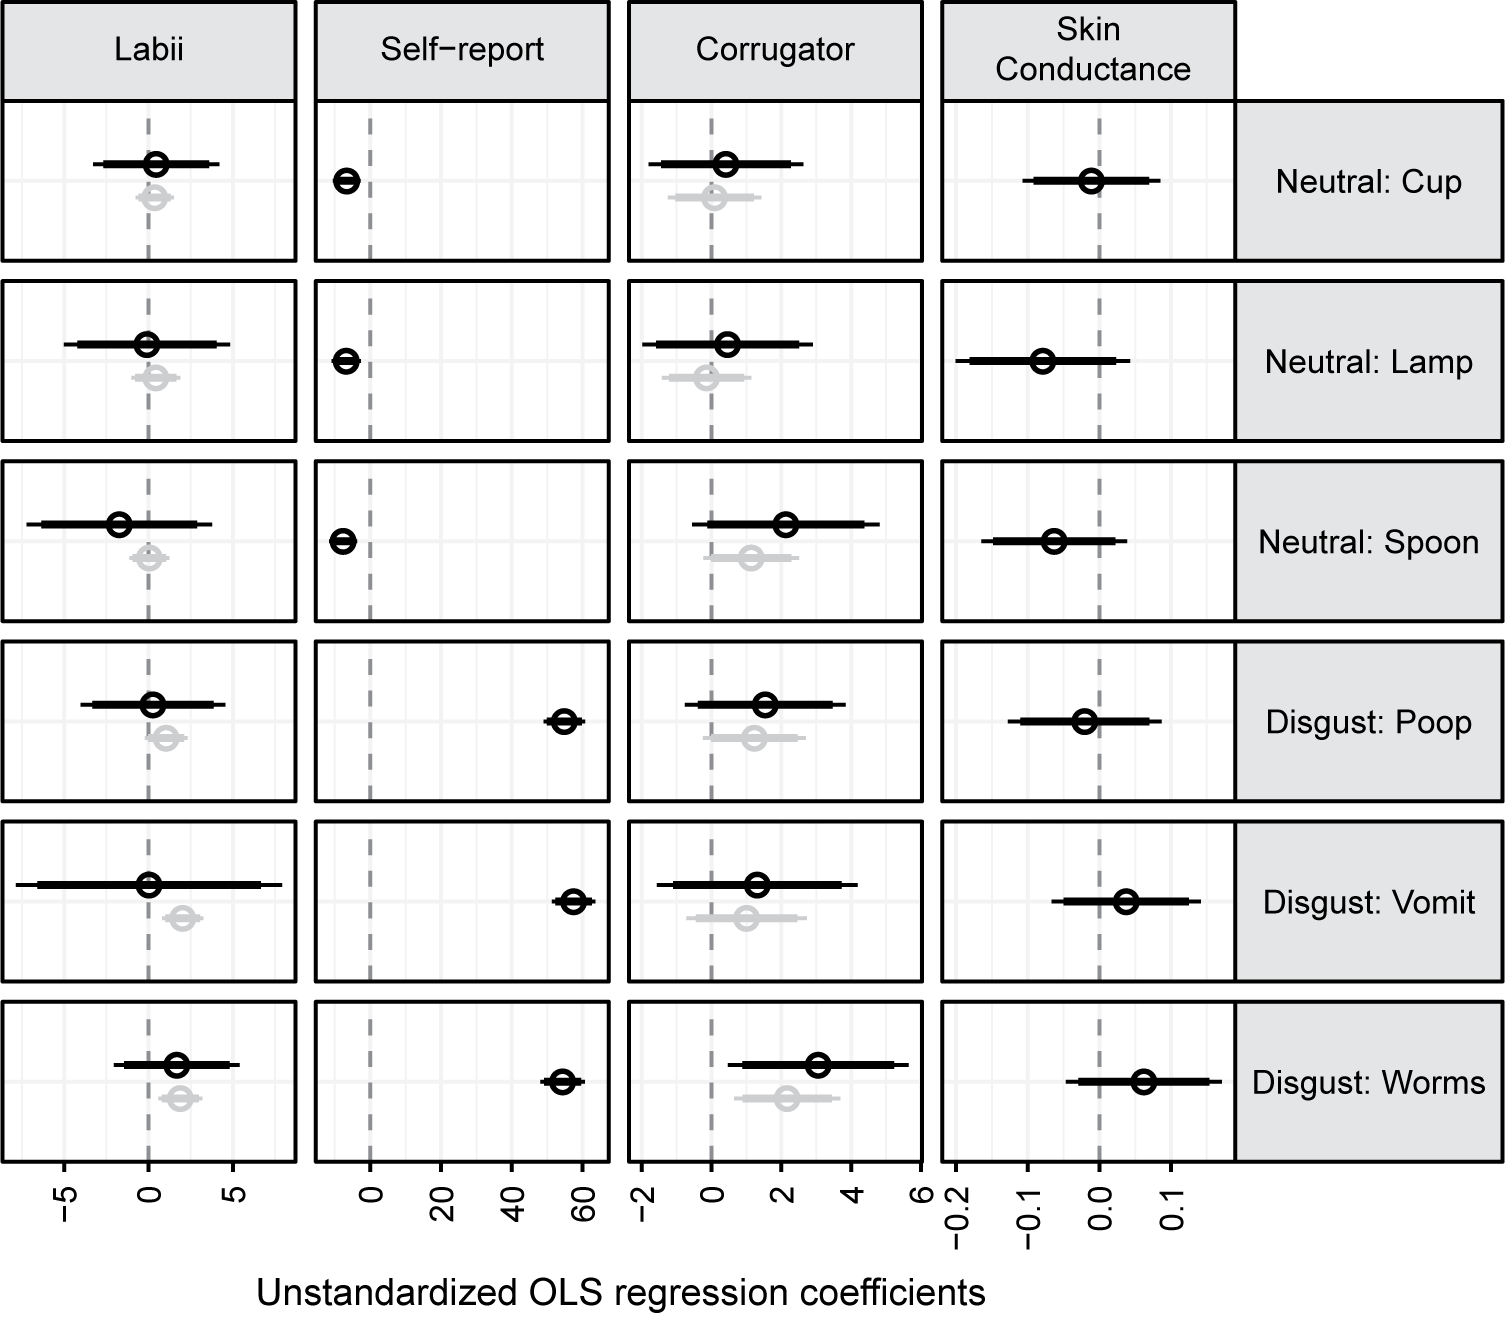
Figure 4 summarizes our manipulation checks. We stacked the responses of the participants to the neutral (4 in total) and disgusting (3 in total) pictures. We performed an ordinary least squares (OLS) regression with robust standard errors to predict differences in labii activity per picture, using the neutral picture of the basket as the reference category. This procedure was preregistered. The black dots and bars in the first column represent the differences in labii activity of the six neutral and disgusting pictures compared with the reference category. None of the reported differences in labii activity is statistically significant at conventional levels.
Results of preregistered and exploratory manipulation checks. We conducted OLS regression analyses: the dependent variables are in the columns of the figure, and the independent variables are the rows. The picture of the basket is the reference category. The dots are point estimates of the difference with the reference category. Black dots represent preregistered manipulation checks, gray ones represent exploratory checks in which we winsorized the dependent variable. The point estimates with 95% (thin-line) and 90% (thick line) confidence intervals are plotted. Full regression output can be found in Appendix B.4.

The very large confidence intervals imply that there is still considerable noise in the data, despite the fact that we omitted cases of mechanical or protocol failure following our preregistered exclusion criteria. To address this, we winsorized the labii response variable. In particular, the bottom and top 5% of the values in the distribution of the labii response variable were reset to 5% and 95% values, respectively. These gray dots and bars represent these results. Here the manipulation check is clearly passed: there is no significant labii response to the neutral pictures, while for the vomit (b = 2.025, CI [0.799, 3.251], p = .001) and worms (b = 1.885, CI [0.575, 3.194], p = .005) pictures, we find a statistically significant difference with the neutral basket picture. For feces (b = 1.043, CI [–0.224, 2.309], p = .107), the sign is in the expected direction. This validates our procedure designed to pick up physiological disgust responses. However, we recognize that this only applies to the exploratory procedure using post hoc winsorizing.
The preregistered procedure was insufficient to obtain normally distributed data. This is problematic for the statistical tests that we preregistered. For reasons of transparency, the remainder of the article will report both winsorized results and non-winsorized results for labii activity.
In the second column of Figure 4, we display the effects of self-reported disgust to these pictures. Here we clearly find increased disgust in response to the disgusting images compared with the reference category (feces: b = 54.85, CI [48.98, 60.71], p < .001; vomit: b = 57.47, CI [51.30, 63.64], p < .001; and worms: b = 54.36, CI [48.10, 60.62], p < .001).
In columns 3 and 4, we analyze corrugator and SCL responses to the disgusting images. Here we find few significant differences between the disgusting images and the reference category: only the picture of the worms (b = 2.168, CI [0.645, 3.691], p =.005) provoked significantly higher corrugator activity compared with the reference condition. These results indicate the divergent validity of our measure: disgusting images, if anything, evoke labii activity.
Preregistered t-tests
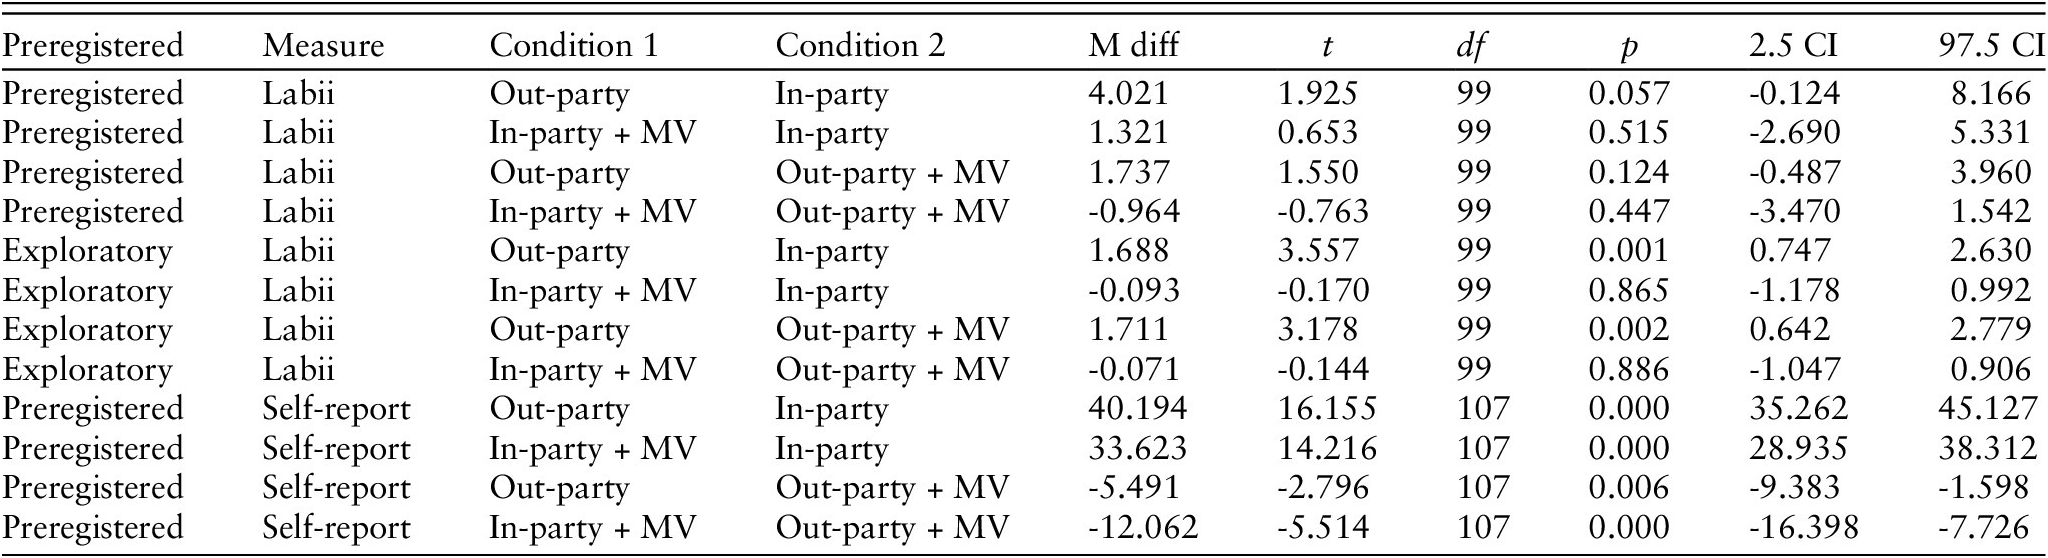
Table 2 presents the results of t-tests comparing two experimental conditions. In line with our manipulation check, we do not find any statistically significant difference between the conditions following the preregistered operationalization of labii activity (p >.06 in all tests) (see test statistics in the first four rows of Table 2). Note that we also preregistered t-tests against zero. These are discussed in Appendix B.5. The labii responses and self-reports differed significantly from zero in all treatments.
T-test of differences in disgust (Labii and self-report) between conditions (preregistered and exploratory).

After winsorizing the labii response—which was not preregistered—we find a statistically significant stronger labii response to the picture of the out-party leader than to the picture of the in-party leader (μdiff = 1.688, p = .001). There is no significant difference between the in-party leader picture treatment and the in-party leader with a moral violation treatment (μdiff = –0.093, p = .865). Surprisingly, we find that the labii response is stronger to the treatment with the picture of the out-party leader than to the treatment with the moral violation of the out-party leader (μdiff = 1.711, p = .002). Finally, the labii response to the in-party leader who committed a moral violation does not differ significantly from the labii response to the out-party leader who committed a moral violation (μdiff = –0.071, p = .886).
Regarding the self-reports, we find that participants were more disgusted by the out-party leader picture than by the in-party leader picture (μdiff = 40.194, p < .001). Adding moral violations to the in-party leader (μdiff = 33.623, p < .001) or out-party leader picture (μdiff = 5.491, p = .006) significantly increases self-reported disgust. Self-reported disgust to the in-party leader who committed a moral violation is lower than self-reported disgust to the out-party leader who committed a moral violation (μdiff = –12.062, p < .001).
Preregistered multivariate test of H1–H4
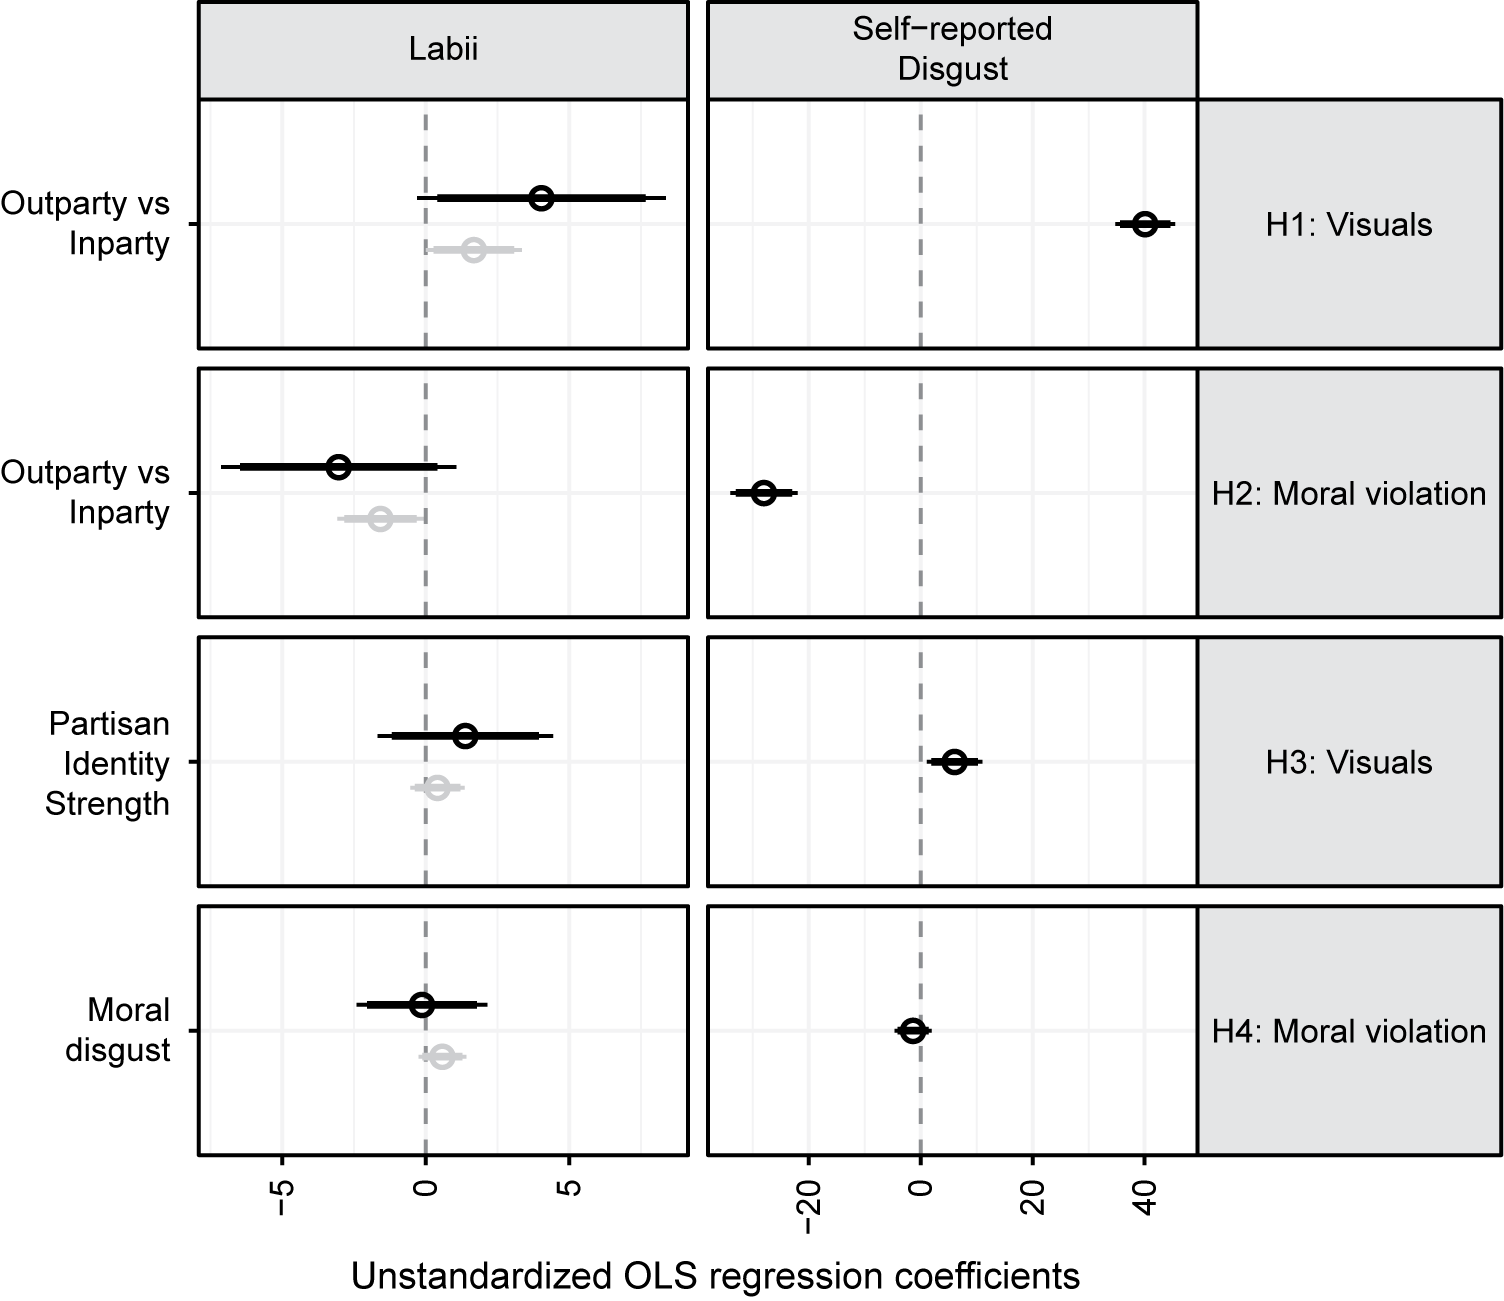
Figure 5 presents the results for the multivariate regression analyses testing H1–H4. An important difference with the t-tests that we presented earlier is that we now control for a number of preregistered covariates. In our analyses, some covariates have statistically significant effects, but there is no overall pattern. That is, none of the covariates is significantly positive or negative across the analyses. For the labii responses, there are some differences associated with the fact that we collected data in two locations: in particular, this is expressed in a dummy variable identifying the location, the temperature, and the reward system. But these effects are not systematic (see Appendix B.6 for full regression output). Political knowledge is associated with a stronger winsorized labii response to the picture of the out-party leaders than to the picture of the in-party leaders, but this could be a fluke.
Results of preregistered hypothesis tests. Plot of the unstandardized OLS regression coefficients of the preregistered hypothesis tests (in black)—and one exploratory model for the labii (in grayscale)—for the labii (left-hand column) and the self-reported disgust (right-hand column). The point estimates with 95% (thin-line) and 90% (thick line) confidence intervals are plotted. Full regression output can be found in Appendix B.6.

Now let us move to H1. The results suggest that people respond with more labii activity in response to an out-party politician compared with the in-party politician, but the result is not statistically significant at the preregistered level, p < .05 (b = 4.033, CI [–0.297, 8.365], p = .068). The exploratory analysis does suggest a significantly stronger labii response (b = 1.678, CI [0.003, 3.351], p = .050). Turning to the self-reports, participants reported significantly more disgust to the out-party leader compared with the in-party leader (b = 40.109, CI [34.758, 45.460], p < .001). In sum, H1 is supported by self-reports and more suggestively by the physiological reports.
Do people who say that they are disgusted also have increased labii activity? The correlation between the labii response and the self-reported responses to the in-party pictures is very low (preregistered labii variable, r = 0.074, CI [–0.124, 0.266], p = .465; winsorized labii variable, r = –0.002, CI [–0.219, 0.174], p = .815). We find similar disconnects in the disgust responses to out-party leaders. This means that the physiological and cognitive-emotions (self-report) are not aligned.
For hypotheses 2a and 2b, we compare the difference in disgust between the picture and the picture with the moral violations. In other words, here we test the effect of moral violations of in-party and out-party leaders. For the preregistered labii activity, we do not find a statistically significant difference in labii responses to in-party leaders compared with out-party leader (b = –3.031, CI [–7.131, 1.07], p = .147). For the exploratory winsorized labii response variable, we find a similarly negative but statistically significant difference in labii responses to in-party leaders compared with out-party leaders (b = –1.576, CI [–3.077, –0.076], p = .040). The effect size is comparable to the effect sizes we found with the disgusting images in the manipulation check (see Figure 4). This means that labii responses to feces, vomit, and worms are as strong as labii responses to the picture of the in-party leader compared with the out-party leader.
The preregistered self-report evidence is in line with preregistered expectations: respondents expressed stronger disgust responses for in-party leaders who commit moral violations compared with out-party leaders who commit moral violations (b = –28.016, CI [–34.021, –22.010], p < .001). In sum, the self-reports and the explorative physiological results point in favor of H2b.
Following H3, we expected strong partisans to have stronger responses to out-party leaders than to in-party leaders. However, our findings indicate that there is no statistically significant association between partisan strength and the difference in labii responses to the out-party leader and in-party leader (preregistered result: b = 1.381, CI [–1.678, 4.439], p = .372; exploratory result: b = –0.411, CI [–0.536, 1.358], p = .391). We do find that stronger partisans report more disgust in response to the picture of the out-party leader than to the picture of the in-party leader than weaker partisans (b = 6.060, CI [1.097, 11.024], p = .017).
Following H4, we expected that people who score high on the moral disgust scale have stronger responses to moral violations. We do not find evidence for this. There is no statistically significant association between the moral disgust scale and the difference between labii responses to the moral violation and the picture treatment (preregistered result: b = –0.13, CI [–2.412, 2.152], p = .911; exploratory result: b = 0.581, CI [–0.249, 1.412], p = .169). Also, there is no statistically significant association between the moral disgust scale and self-reported disgust (b = –1.364, CI [–4.676, 1.949], p = .418).
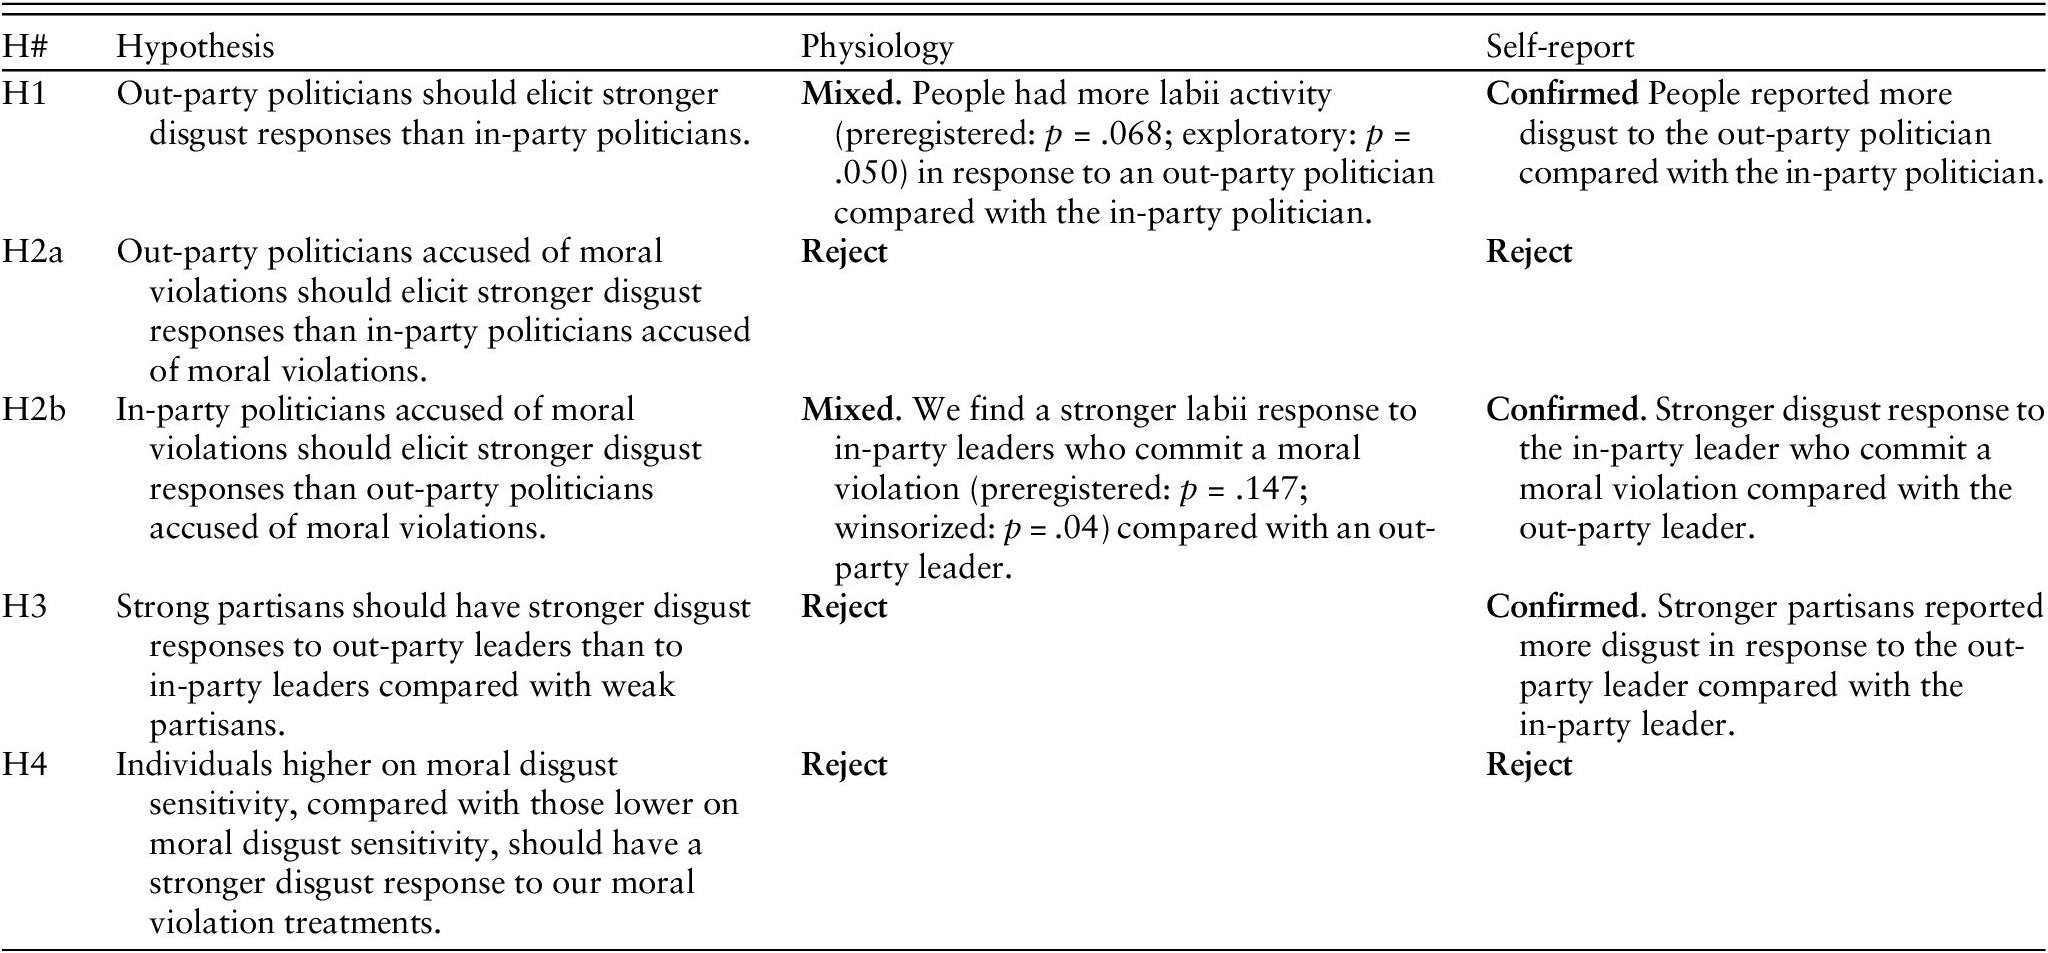
In sum, our analyses justify the following conclusions (for an overview, see Table 3). Our participants self-reported higher disgust against out-party leaders and found moral violations more problematic when committed by in-party leaders. Strong partisans reported more disgust against the out-party leader. Moral disgust is not associated with the expressions of disgust to in-party and out-party leaders that committed moral violations. We also find evidence that people have stronger labii responses to out-party politicians than to in-party politicians. There is more suggestive evidence that in-party leaders evoke more labii activity when they commit moral violations than when out-party leaders do. Individual differences in moral disgust and partisanship strength on average cannot explain these physiological responses.
Overview of the preregistered hypothesis tests.

Preregistered robustness checks
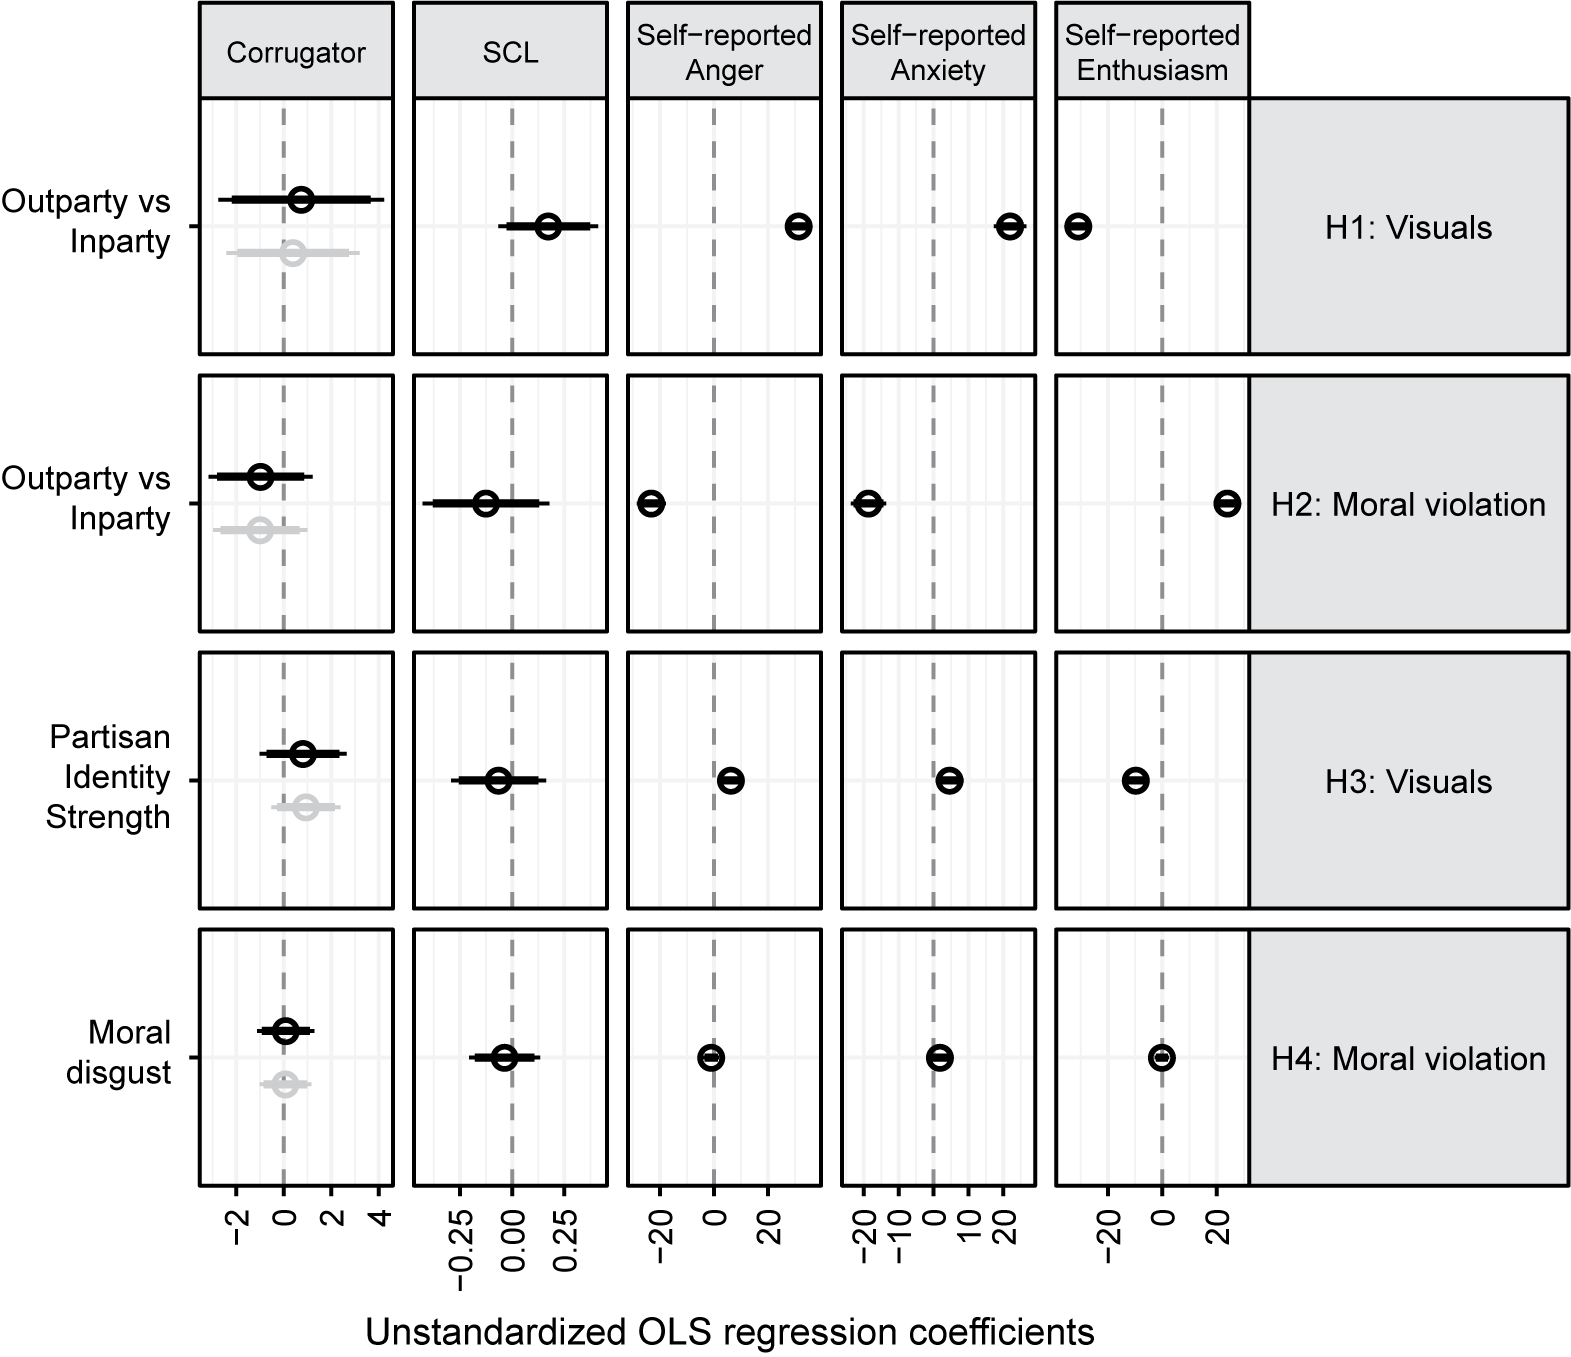
Following preregistered procedures, we reran all our analyses of physiological responses using skin conductance and corrugator activity as dependent variables. In addition, we also created a winsorized version of the corrugator response, as we did with the labii response. Figure 6 plots the results of the robustness checks. We find no evidence for H1–H4 using either corrugator responses (column 1 of Figure 6) or skin conductance as the dependent variable (column 1 of Figure 6). These results support the notion that the labii response to the moral violation of in-party leaders that we reported is indeed a distinctive response and not the product of cross-talk.
Results of preregistered robustness checks. Plot of the unstandardized OLS regression coefficients of the preregistered hypothesis tests (in black)—and one exploratory model for the corrugator (in grayscale)—for the corrugator, skin conductance (SCL), self-reported anger, self-reported anxiety, and self-reported enthusiasm. The point estimates with 95% (thin-line) and 90% (thick line) confidence intervals are plotted. Full regression output can be derived from the replication files.

Turning to the self-reported emotions, the results for self-reported anger, anxiety, and enthusiasm (although reversed signed) are very similar to the results for self-reported disgust. Starting with H1, in response to the out-party leader, people reported more anger, (b = 31.349, CI [26.329, 36.369], p < .001) and anxiety (b = 21.935, CI [7.274, 26.595], p < .001) and less enthusiasm (b = –30.875, CI [–35.781, –25.969], p < .001). The self-reports also show that people reported more anger (b = –23.184, CI [–28.554, –17.814], p < .001) and anxiety (b = –18.638, CI [–23.699, –13.576], p < .001) but less enthusiasm for in-party leaders (b = 23.944, CI [19.171, 28.717], p < .001) who commit moral violations than for out-party leaders (see H2). Finally, we find that stronger partisans reported more anger (b = 6.286, CI [1.527, 11.044], p = .001) and anxiety (b = 4.617, CI [0.612, 8.623], p = .002) but less enthusiasm (b = –9.715, CI [–14.047, –5.384], p < .001) in response to the picture of the out-party leader than to the picture of the in-party leader than weaker partisans (see H3). Also, there is no statistically significant association between moral disgust sensitivity and self-reported anger, anxiety, and enthusiasm (see H4).
What is striking is that the results for self-reported anger and anxiety are very similar to the results for self-reported disgust. This might not be so surprising as the correlation between self-reported disgust and self-reported anger is very high across all four treatment conditions (r >.72, see Appendix B.3). But anxiety and disgust were also highly correlated with each other: r >.57 across conditions (see Appendix B.3). This raises doubts as to whether the self-reported disgust is indeed capturing the emotion disgust rather than a more general negative affect in response to our treatments.
Finally, we find no evidence that the other two traits (sexual and pathogen disgust) of the disgust sensitivity scale have an effect on physiological disgust responses or the self-reported disgust to the moral violations. We do find a positive association between self-reported anxiety and pathogen disgust as well as sexual disgust sensitivity but not any statistically significant association with the self-reported anger or enthusiasm (see Appendix B.7). Therefore, the results for anxiety are most likely a fluke.
Discussion
Many people are deeply concerned about polarization, particularly because recent works hint at the affective nature of this polarization (Iyengar et al., Reference Iyengar, Sood and Lelkes2012). This article supports this view, as our participants reported high levels of disgust only toward the picture of the out-party leader. Our study also goes beyond the status quo of the literature by demonstrating—primarily through exploratory analyses—that people are also physiologically disgusted by the picture of the out-party leader. In addition to this, our study contains three intriguing findings, which we discuss in more detail here.
First, even though the results for self-reported disgust and physiological disgust are in the same direction, the correlation between them is zero. This suggests that some people have physiological disgust responses and others have cognitive disgust responses to out-party leaders. In our view, this is not evidence for the lack of validity of either measure; rather, it betrays the complex nature of emotions (LeDoux & Pine, Reference LeDoux and Pine2016). Emotions have a quick, physiological side but also more evaluative, cognitive aspects. Our work thereby comports with studies in neuroscience showing weak correlations between physiological, cognitive, and behavioral responses (Bradley & Lang, Reference Bradley, Lang, Lane and Nadel2000; Lang, Reference Lang1968).
We will now discuss a number of issues with measuring physiological and self-reported measures of emotions. Physiological measures are costly, time-consuming, and harder to collect and analyze than self-reports. Our manipulation check suggests that we get a “valid” measure of disgust relying on the physiological measures: in response to the disgusting images, labii activity went up, while corrugator and SCL activity did not change. Regarding self-reports, they are cheap, fast, and easy to collect and analyze. Yet our results question the discriminant validity of these self-reports. Our preregistered analyses show clear evidence for H1 and H2. If we switch self-reported disgust for anxiety, anger, or enthusiasm, as preregistered, our results are identical. Multiple explanations are possible. We might have isolated a cognitive-emotional disgust response in which people also report anger, anxiety and enthusiasm to our treatments. Yet the extremely high correlations between these self-reported emotions in responses to our treatments suggests that people respond with a more general negative affect toward our treatments. We would welcome future work that critically assesses to what extent disgust can be distinguished from other emotions in a valid and reliable manner. The lack of discriminant validity of the self-reported discrete emotions might explain why we find no correlation between self-reported disgust and labii activity. If our self-reported measure of disgust cannot be distinguished from other self-reported emotions, then it is not surprising that these self-reports do not correlate with labii activity. So, while some recent work has criticized the use of physiological measures (Osmundsen et al., Reference Osmundsen, Hendry, Laustsen, Smith and Petersen2019), our findings point out that self-reported measures of discrete emotions are not the unbiased “gold standard” that we might think they are. Going forward, scholars who want to study concordance between experiential (self-reported) and physiological responses (see Figure 1) need to make sure that both the physiological and the experiential measures are validly captured.
Second, when we associated in-party and out-party leaders with moral violations, we found increased disgust toward the in-party leader, both in terms of self-reports and through exploratory analyses physiological responses. For the out-party leader, moral violations do not matter, but they do for in-party leaders. Obviously, we will only know whether these results hold once well-powered and preregistered studies take up the challenge to replicate and extend these findings.
Third, against our hypotheses, we found little evidence that partisan social identity strength and moral disgust influence disgust responses. We only find that strong partisans self-reported more disgust against the out-party leader, but even there, the effect is limited. Our study was sufficiently powered to detect these effects. Apparently, these results do not show up in this study with this particular design and this particular sample. While both partisan identity strength and moral disgust have been widely studied and shown to matter for a variety of attitudes and behaviors, they might not matter that much for the disgust responses to politicians and their moral transgressions. To us, these and other null findings reported in this article show the importance of the registered report format. Null findings tend to be much less likely to be written and/or published (Franco et al., Reference Franco, Malhotra and Simonovits2014). But in this format, they get published.
We deviated in a couple of cases from our preregistered Stage 1 submission (see Table 1). Sometimes this was due to human errors (i.e., the failure to randomize the order of the experiments) or mistakes (the idea to standardize our self-reported emotions scales), and other times this was due to opportunities (i.e., the decision to collect data as a lab-in-the-field study). We do not think that any of these deviations are detrimental for the conclusions we reach in this study. Going forward, we realize that programming errors and mistakes in the planned analyses could be circumvented by even more extensive pilot testing of the protocol before submitting a Stage 1 registered report.
To conclude, in our view, this study motivates further investigation into emotions as cognitive products and emotions as physiological responses. Moreover, we find little evidence that cognitive-emotional and physiological responses are aligned. That means that in the theoretical framework about the concordance between physiological and cognitive-emotional responses, people can have their physiological and cognitive-emotional responses aligned but they might also experience only a physiological response or only a cognitive-emotional responses. We welcome well-powered, preregistered studies to test the causes and consequences of concordance between physiological and cognitive-emotional responses.
Acknowledgments
Bert N. Bakker and Gijs Schumacher contributed equally to this study and are listed in alphabetical order. Registered Report Stage 1 (B.N.B. & G.S.), data collection (B.N.B., G.S., & M.D.H.), data preprocessing (G.S. & M.D.H.), data analyses (B.N.B. & G.S.) and writing up Stage 2 (B.N.B., G.S., & M.D.H.). We thank Cybele Atmeh, Charlotte Brands, Neil Fasching, Zilin Lin, Ilse Slabbekoorn, and Mehdi Zamani for their help during the data collection. Our thinking about the associations between physiological and self-reported disgust has been heavily influenced by our conversations and work with Vin Arceneaux. We also thank Alex Nai, Valentina Parma, Patrick Stewart, Michael Bang Petersen, Josh Tybur, members of the Hot Politics Lab, and the Amsterdam Interdisciplinary Center for Emotion seminar at the University of Amsterdam for their comments.
Funding
This research was funded by the Association for Politics and the Life Sciences (B.N.B. & G.S.), the European Union’s Horizon 2020 research and innovation program under grant agreement no. 750443 (B.N.B.), the Amsterdam School of Communication Research (B.N.B.), and the European Research Council under the European Union’s Horizon 2020 research and innovation program under grant agreement no. 759079 (G.S.).
Supplementary Materials
To view supplementary material for this article, please visit http://dx.doi.org/10.1017/pls.2020.16.