Porous materials have an internal network of pores of various sizes, ranging from micropores to macropores. These pores significantly increase the materials’ specific surface area, making them ideal for use in a wide range of applications across various industrial sectors. Their high porosity and adjustable pore size enable interaction with gases and liquids. This greater porosity increases adsorption capacity and reactivity, making these materials ideal for use in catalytic and energy-related applications, such as catalysis, energy storage and environmental technologies. Hierarchical porous materials, for instance, comprise multiple levels of porosity and demonstrate superior performance in this area due to their greater mass transport and increased active site accessibility, both of which are essential for energy storage and catalysis applications (Yang et al., Reference Yang, Chen, Li, Rooke, Sanchez and Su2017; Wu et al., Reference Wu, Li, Fu and Su2020).
Currently, the global energy demand is primarily met through the use of fossil fuels, such as coal, oil and natural gas. However, the depletion of these reserves and environmental constraints due to CO2 emissions have necessitated the development of other sustainable energy sources, such as hydrogen energy. One method of storing hydrogen energy is physical adsorption, in which hydrogen gas is absorbed into the channels and voids of porous materials such as zeolites, metal–organic frameworks (MOFs) and activated carbon. Furthermore, designing materials with specific pore structures enables them to be used in additional applications, including photocatalysis, biomedicine and environmental sensing (Sun et al., Reference Sun, Huang, Chen, Li, Yang, Yuan and Su2016).
Zeolites are aluminosilicate minerals (Gottardi & Galli, Reference Gottardi and Galli1985). The fundamental structural units of zeolites are TO4 tetrahedra, where T denotes either a silicon or an aluminium atom. The combination of these tetrahedral units forms three-dimensional channel systems and pore networks. These channels contain water molecules, as well as extra-framework exchangeable cations such as Na+, K+ and Ca2+ (Armbruster & Gunter, Reference Armbruster and Gunter2001). These exchangeable cations balance the negative charge in the zeolite structure resulting from the substitution of silicon atoms by aluminium atoms (Passaglia & Sheppard, Reference Passaglia and Sheppard2001). There are more than 40 different types of natural zeolite frameworks, which exhibit a variety of channel structures due to their different arrangements of tetrahedral blocks (Armbruster & Gunter, Reference Armbruster and Gunter2001). One of the most common types of zeolite is clinoptilolite (CLN), which belongs to the heulandite (HEU) group. Its chemical formula is (Na,K)6(Al6Si30O72).20H2O. CLN has a monoclinic framework crystal structure with C2/m symmetry and the following unit cell parameters: a = 17.62 Å, b = 17.91 Å, c = 7.39 Å and β = 116°16′ (Armbruster & Gunter, Reference Armbruster and Gunter2001). Despite sharing the same framework structure, CLN is more thermally stable than HEU (Mumpton, Reference Mumpton1960). The two-dimensional channel network of CLN comprises three principal channels: channel A, which has 10 members, and channel B, which has 8 members, run along the c-axis, while channel C, which has 8 members, intersects channels A and B along the a-axis. Consequently, diffusion of molecules along the b-axis is not permitted by the CLN channel system (Gottardi & Galli, Reference Gottardi and Galli1985; Armbruster & Gunter, Reference Armbruster and Gunter2001). The four extra-framework cation sites (designated M(1), M(2), M(3) and M(4)) have been extensively studied within the CLN channel system. The M(1) site in channel A is usually occupied by Na+ and Ca2+. Additionally, the M(4) site, which is also present within channel A, has a lower occupancy rate than the M(1) site. This site is occupied by Mg2+ cations coordinated to water molecules. Ca2+ and Na+ cations have been shown to be located at the M(2) site in channel B. The M(3) site, located in the centre of channel C, is occupied by K+ cations (Ackley et al., Reference Ackley, Giese and Yang1992; Jayaraman et al., Reference Jayaraman, Yang, Chinn and Munson2005; Kennedy & Tezel, Reference Kennedy and Tezel2018). In addition to the aforementioned cations, Ag+ cations can be found in regions M(1) and M(2), as well as in a third region in channel A near the intersection of channels A, B and C (Dimova et al., Reference Dimova, Petrov, Kadiyski, Lihareva, Stoyanova-Ivanova and Mikli2011; Kennedy et al., Reference Kennedy, Khanafer and Tezel2019).
In addition to its catalytic performance (Pérez Vélez et al., Reference Pérez Vélez, Elizalde González and Bentrup2012; Grzeszczak et al., Reference Grzeszczak, Wróblewska, Kiełbasa, Koren and Michalkiewicz2023), CLN can be used as an adsorbent to remove heavy metal ions from wastewater (Inglezakis, Reference Inglezakis, Inglezakis and Zorpas2012; Stepova & Konanets, Reference Stepova and Konanets2024) and to separate gas mixtures (Grzeszczak et al., Reference Grzeszczak, Wróblewska, Kiełbasa, Koren and Michalkiewicz2023; Hedayati et al., Reference Hedayati, Delica, Perez‐Gil and Prieto‐Fernandez2023; Chen et al., Reference Chen, Zhou, Wei, Cui, Wan and Liu2024). The catalytic and adsorption properties of CLN can be improved through acid treatment, which positively impacts the specific surface area and number of acid sites (Christidis et al., Reference Christidis, Moraetis, Keheyan, Akhalbedashvili, Kekelidze and Gevorkyan2003; Ates & Hardacre, Reference Ates and Hardacre2012; Karousos et al., Reference Karousos, Sapalidis, Kouvelos, Romanos and Kanellopoulos2016; Ghahri et al., Reference Ghahri, Golbabaei, Vafajoo, Mireskandari, Yaseri and Shahtaheri2017). However, this process can result in the rapid collapse of the CLN structure, even at low acid molarities (Garcia-Basabe et al., Reference Garcia-Basabe, Rodriguez-Iznaga, de Menorval, Llewellyn, Maurin and Lewis2010). Therefore, ion exchange is commonly employed in the literature as an alternative to acid treatment (Rodríguez-Iznaga et al., Reference Rodríguez-Iznaga, Shelyapina and Petranovskii2022; Yordanova et al., Reference Yordanova, Hristov, Kolev, Todorova and Naydenov2023; Kalvachev et al., Reference Kalvachev, Vitale, Arena, Todorova, Ilkov and Velikova2024; Maia et al., Reference Maia, Azevedo, Pereira, Castro, Nascimento and Rodríguez-Castellón2024). Ag-exchanged CLNs have been investigated for use in ozone degradation and decomposition (Nikolov et al., Reference Nikolov, Genov, Konova, Milenova, Batakliev and Georgiev2010; Barbov et al., Reference Barbov, Zaharieva, Karakashkova and Penchev2023), as antibacterial materials (De la Rosa-Gómez et al., Reference De la Rosa-Gómez, Olguín and Alcántara2008; Copcia et al., Reference Copcia, Luchian, Dunca, Bilba and Hristodor2011; Znak et al., Reference Znak, Коrnii, Маshtaler and Zin2021), as photocatalysts (Hallajiqomi et al., Reference Hallajiqomi, Mehdipourghazi and Varaminian2019), in dielectric applications (Bunyatova et al., Reference Bunyatova, Ozturk Koc, Orbukh, Eyvazova, Agamaliev and Lebedeva2016) and in wound dressings (Hubner et al., Reference Hubner, Donati, Quines, Tessaro and Marcilio2020). However, research on the gas adsorption properties of natural zeolites for hydrogen storage – an alternative energy source that could help meet today’s growing energy demands – is limited (Ramesohl & Merten, Reference Ramesohl and Merten2006; Erdoğan Alver & Sakızcı, Reference Erdoğan Alver and Sakızcı2019; Erdoğan & Dikmen, Reference Erdoğan and Dikmen2020). Furthermore, studies specifically investigating the impact of Ag+ cation exchange on the hydrogen adsorption properties of CLN are scarce (Erdoğan et al., Reference Erdoğan, Ekinci Şans and Esenli2025). The main objective of this study was therefore to determine the textural, structural and hydrogen adsorption properties of Ag-exchanged CLN treated with AgNO3 solutions at various concentrations (0.01–0.30 M).
Experimental
Materials and methods
Natural CLN from Gördes was used in this study, and the particle size selected after grinding and sieving of CLN was less than 63 µm. To remove soluble impurities, 5.0 g aliquots of zeolite samples were kept in 100 mL deionized water at 50°C for 2 h. The samples were filtered and dried overnight at 100°C. A total of 5.0 g of each sample was exchanged with 0.01, 0.03, 0.05, 0.15 and 0.30 M AgNO3 solutions at 90°C for 5 h. All of the Ag+-exchanged forms were separated, washed several times with deionized water at boiling point and dried at room temperature. The samples were then kept in an oven at 120°C for 20 h. Finally, depending on the molarity of the salt solution used in the cation-exchange process, the cation-exchanged samples of the CLN sample were labelled as follows: 0.01-Ag-CLN, 0.03-Ag-CLN, 0.05-Ag-CLN, 0.15-Ag-CLN and 0.30-Ag-CLN. The cation-exchange process was performed using silver nitrate (AgNO3, ≥99.0%; Sigma-Aldrich, Canada).
Instrumentation
X-ray powder diffraction (XRD) traces of CLN were collected on a Bruker D8 Advance X-ray diffractometer (USA) at room temperature using Cu-Kα radiation (λ = 1.542 Å) at 40 kV and 40 mA. The scanning step was 0.02° within the range of 5–40°2θ. Elemental analysis of all CLN samples was performed using a Rigaku ZSX Primus instrument. Loss on ignition (LOI) was determined by measuring the mass change after heating to 1000°C at a rate of 10°C min–1 and then cooling to room temperature at the same rate. Specific surface areas and micropore data were obtained from N2 adsorption measurements at 77 K, and hydrogen adsorption isotherms were measured at 77 K up to a pressure of 113 kPa. N2 and H2 adsorption analyses of CLN samples were performed using a 3Flex volumetric apparatus (Micromeritics, USA) after degassing at 300°C for 8 h with high-purity (99.999%) nitrogen and hydrogen gases.
Results and discussion
Chemical analysis
The chemical compositions of the main oxides of all of the CLN samples are given in Table 1. Although CLN is rich in calcium and potassium, the chemical composition of the samples changed significantly as the AgNO3 molarity increased. In particular, the MgO, CaO and Na2O components, rather than the K2O component, significantly decreased after cation-exchange treatments. This can be attributed to the relatively large size of the K+ cation compared to the other cations (Na+, Ca2+ and Mg2+) and to its location in the CLN channels. As expected, the Ag2O composition (wt.%) of the Ag+-exchanged forms increased with the molarity of the AgNO3 solution.
The chemical composition (wt.%) of raw CLN and its Ag-exchanged forms.

Table 1 Long description
Chemical composition in weight percent is listed for raw CLN and five Ag-exchanged CLN samples, reporting major oxides plus loss on ignition. SiO2 is the dominant component and remains fairly stable, ranging from 69.46 to 71.81 wt.% across all samples. Ag2O increases steadily with higher Ag exchange, from not reported in raw CLN to 1.31, 2.50, 3.68, 6.51, and 7.50 wt.% for 0.01 through 0.30-Ag-CLN. As Ag2O rises, CaO decreases from 2.17 wt.% in raw CLN to 0.50 wt.% at 0.30-Ag-CLN, and K2O drops from 5.00 to 3.45 wt.%. Na2O is reduced overall and is not reported for the 0.05-Ag-CLN and 0.30-Ag-CLN rows. Al2O3 stays near 11.55 to 12.02 wt.% and Fe2O3 and MgO remain below 1 wt.% throughout. Loss on ignition varies modestly, from 5.84 to 6.96 wt.%, with the lowest value at 0.30-Ag-CLN. Dashes indicate values not reported, so comparisons for those oxides should be interpreted cautiously.
XRD analysis
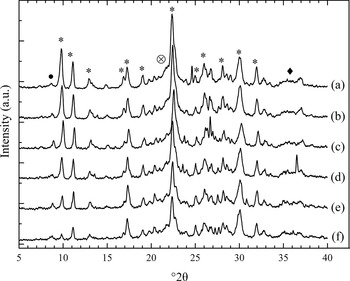
The XRD traces of raw CLN and its Ag-exchanged forms are presented in Fig. 1. The CLN sample exhibited characteristic CLN peaks at d = 8.95, 7.91, 3.96 and 2.79 Å, corresponding to 9.88°2θ, 11.17°2θ, 22.50°2θ and 32.01°2θ, respectively (Moore & Reynolds Jr, Reference Moore and Reynolds1997). Using Esenli and Sirkecioğlu’s method (Esenli & Sirkecioğlu, Reference Esenli and Sirkecioğlu2005), it was determined that the CLN sample consists mainly of CLN minerals (80–85%), with small amounts of feldspar (3%), opal-A (5–10%) and illite (2%). The illite peak is slightly sharper in the Ag-treated samples than in the raw CLN. Additionally, no change in the intensity of the opal-A peak was observed in the samples. Following cation exchange with Ag+, however, the intensity of the CLN peaks decreased with increasing solution concentration. The most significant decrease occurred in the 020 reflection at ∼9.88°2θ. The decrease in the intensity of the first two XRD peaks with increasing AgNO3 concentration can be attributed to differences in chemical composition. Similar decreases in the peak intensity of CLN have been observed in previous studies following Ag+ exchange (Akdeniz & Ülkü, Reference Akdeniz and Ülkü2008; Dimova et al., Reference Dimova, Petrov, Kadiyski, Lihareva, Stoyanova-Ivanova and Mikli2011; Ünaldi et al., Reference Ünaldi, Mizrak and Kadir2013; Kennedy & Tezel, Reference Kennedy and Tezel2018; Erdoğan et al., Reference Erdoğan, Ekinci Şans and Esenli2025).
XRD traces of CLN and its Ag+-exchanged forms: (a) CLN, (b) 0.01-Ag-CLN, (c) 0.03-Ag-CLN, (d) 0.05-Ag-CLN, (e) 0.15-Ag-CLN and (f) 0.30-Ag-CLN. * = CLN; • = illite; ⊕ = opal-A; ♦ = feldspar.

Figure 1 Long description
Six stacked X-ray diffraction line plots labeled (a), (b), (c), (d), (e) and (f), showing intensity versus 2 theta. The x-axis is labeled 2 theta, ranging from 5 to 40, with labeled ticks at 5, 10, 15, 20, 25, 30, 35 and 40. The y-axis is labeled Intensity (a.u.). All six traces show multiple narrow peaks across the full 2 theta range. A tall, narrow peak occurs near 25 on every trace and a vertical line is drawn through this peak position across the stacked traces. Additional peaks are visible in each trace in the ranges about 8 to 15, about 18 to 23 and about 26 to 35. The top trace includes symbol annotations placed at several peak positions: filled circles near about 7 to 9; asterisks at multiple positions including around 9 to 12, around 18 to 22 and around 26 to 33; and circled plus symbols around about 21 to 23 and around about 27 to 29. The traces appear similar in peak positions across (a) through (f), with differences visible mainly as changes in peak heights between traces.
Nitrogen adsorption
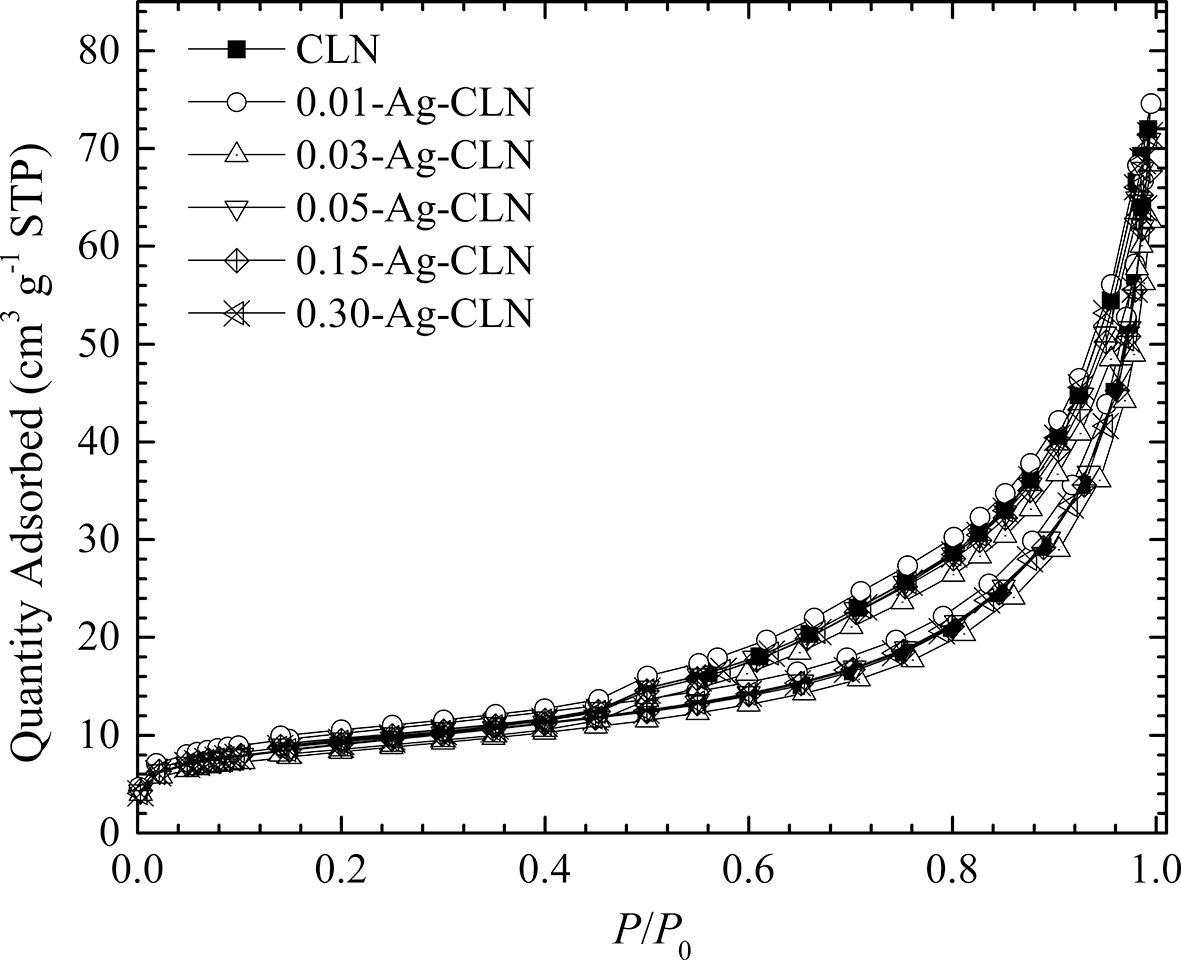
The N2 adsorption isotherms of raw CLN and its cation-exchanged forms at 77 K are shown in Fig. 2. According to the International Union of Pure and Applied Chemistry (IUPAC) classification, all isotherms display a Type IV character (Sing, Reference Sing1985), typical of microporous/mesoporous adsorbents. At the adsorption branch, the initial part of the isotherm resembles the Type-II isotherm, involving monolayer–multilayer adsorption. Type-IV isotherms are characterized by a hysteresis loop linked to pore condensation (Lowell et al., Reference Lowell, Shields, Thomas and Thommes2004). Τhe Brunauer–Emmett–Teller (BET) specific surface area of the raw CLN sample determined by nitrogen adsorption experiments at 77 K was 35.7 m2 g–1. The specific surface areas of the cation-modified samples exhibited a range of 32.1–36.7 m2 g–1 (Table 2). The specific surface areas of the Ag-modified CLN samples decreased after exceeding the 0.01 M threshold concentration due to the blockage of the channel structure of CLN caused by an increase in cation molarity. This results in reduced access of N2 to the micropore space. Similarly, the 0.01-Ag-CLN sample exhibited the highest micropore area, at 11.2 m2 g–1. Finally, as with the BET specific surface area, the micropore surface areas of the cation-modified samples also decreased after the 0.01-Ag-CLN sample. Table 2 presents the BET specific surface area and micropore data for all of the samples. The BET specific surface area of all cation-exchanged samples except the 0.01-Ag-CLN sample is smaller than that of the CLN sample. The decrease in BET and microporous surface areas observed in ion-exchanged CLN containing Ag+ cations is consistent with findings reported in previous studies of CLN (Ünaldi et al., Reference Ünaldi, Mizrak and Kadir2013; Kennedy & Tezel, Reference Kennedy and Tezel2018; Erdoğan et al., Reference Erdoğan, Ekinci Şans and Esenli2025).
N2 adsorption–desorption isotherms of CLN and its Ag-exchanged forms at 77 K. STP = standard temperature and pressure.

N2 and H2 adsorption data for the raw CLN and its Ag-exchanged forms at 77 K.

Hydrogen adsorption
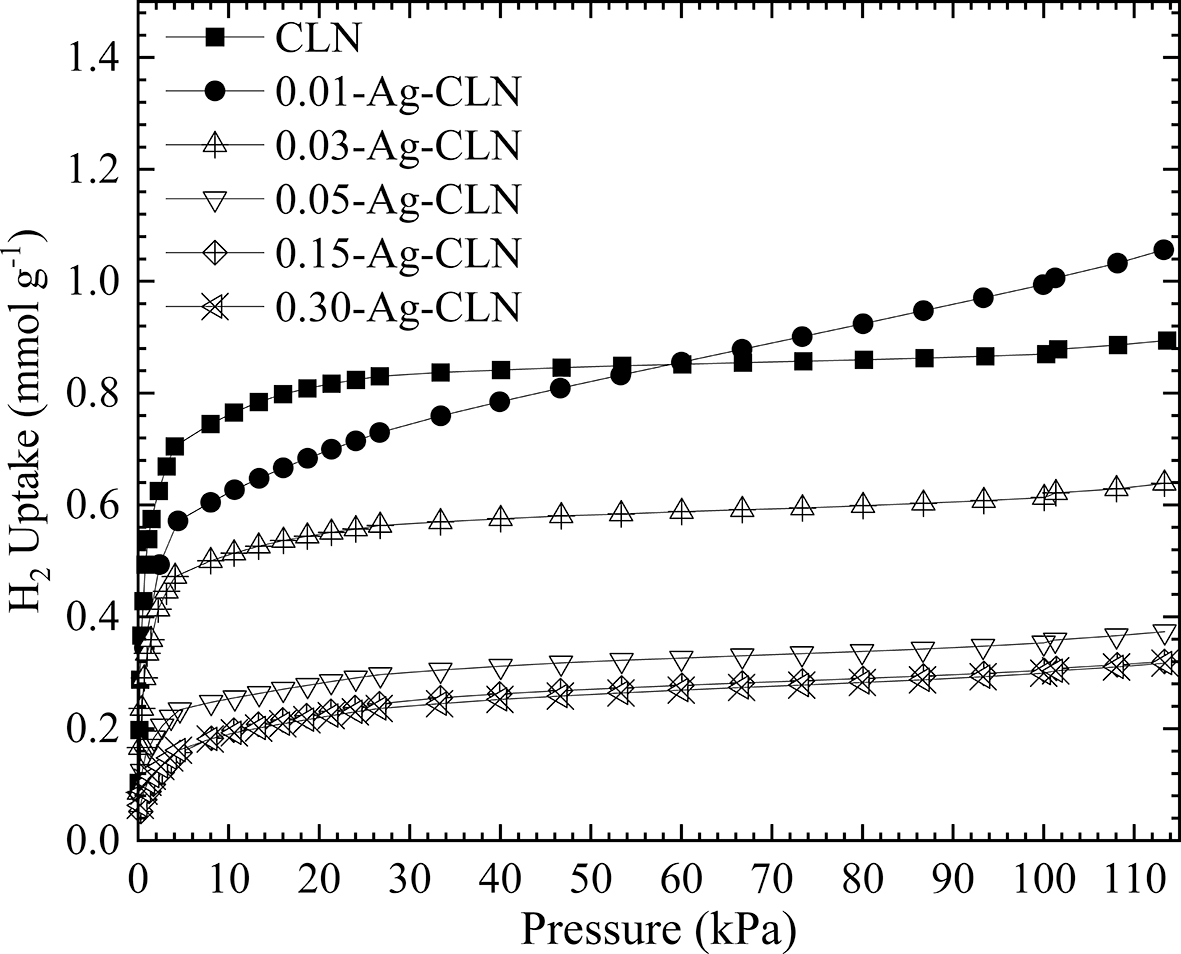
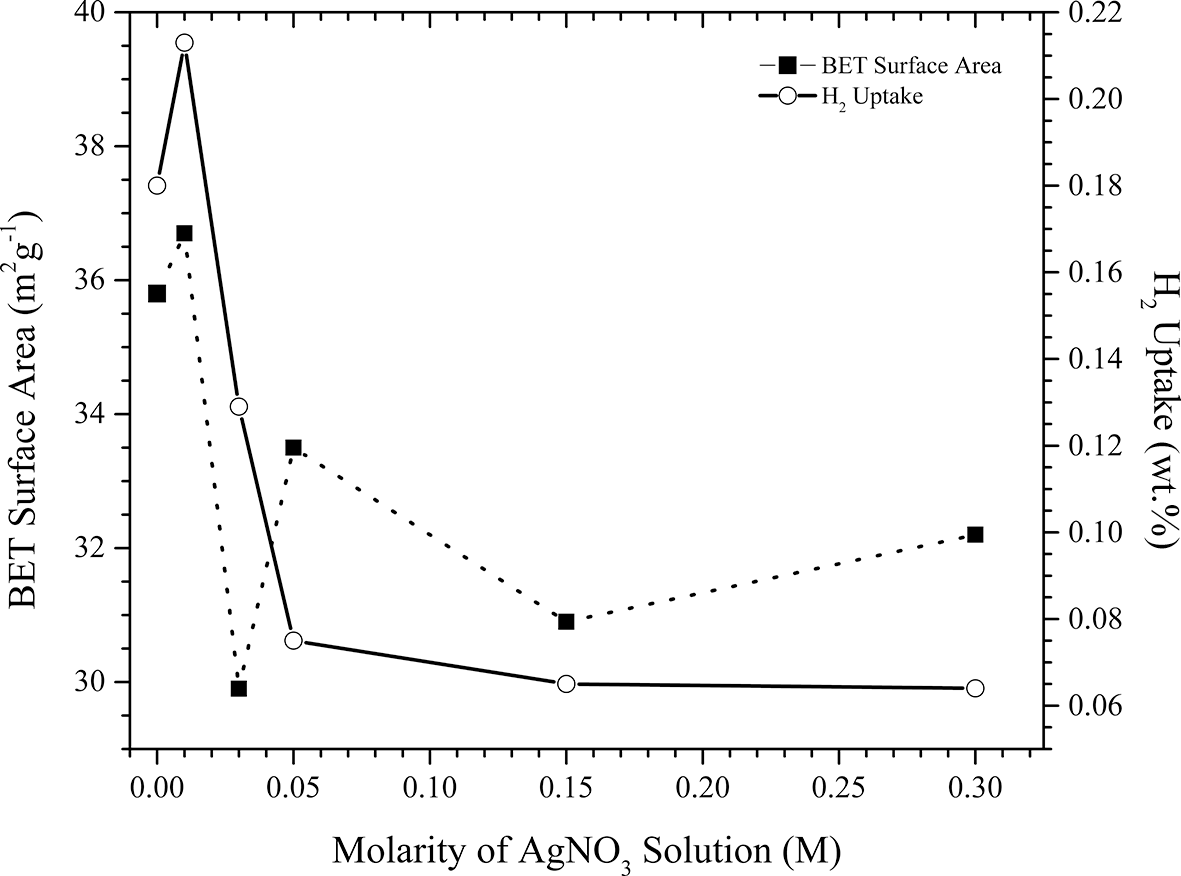
The hydrogen adsorption isotherms of raw CLN and its Ag-exchanged forms at 77 K and pressures up to 113 kPa are shown in Fig. 3. The hydrogen retention of the CLN samples decreased in the following order: 0.01-Ag-CLN > CLN > 0.03-Ag-CLN > 0.05-Ag-CLN > 0.15-Ag-CLN > 0.30-Ag-CLN (Table 2). The 0.01-Ag-CLN sample had the highest uptake (0.212 wt.%; 1.056 mmol g–1), while the lowest hydrogen adsorption capacity was exhibited by 0.30-Ag-CLN (0.064 wt.%; 0.317 mmol g–1). Figure 4 shows the specific surface area and H2 retention of CLN samples against the molarity of AgNO3 solution used in cation-exchange processes. When the 0.01 M threshold was exceeded, both the BET specific surface area and the H2 adsorption value decreased with increasing molarity of the AgNO3 solution used due to the increasing amount of Ag+ cations and their position in the structure. However, at the 0.01 M threshold, hydrogen retention improved by ∼18% compared to the raw CLN (0.894 mmol g–1). This demonstrates the benefit of applying the cation-exchange process with Ag+ at low molarity, as this removes most of the other exchangeable cations from the structure, opening the pores and increasing hydrogen adsorption. The hydrogen adsorption capacity of the 0.01-Ag-CLN sample in this study (0.212 wt.%; 1.056 mmol g–1) is higher than that of Cu(I)-[B]-SSZ-13 (0.05 wt.%; Ipek et al., Reference Ipek, Pollock, Brown, Uner and Lobo2018) and of Gördes CLN from the same region exchanged with 1.0 M NaNO3 (0.065 wt.%; Erdoğan Alver & Sakızcı, Reference Erdoğan Alver and Sakızcı2019) and KNO3 (0.171 wt.%; Erdoğan Alver & Sakızcı, Reference Erdoğan Alver and Sakızcı2019). However, the result obtained for 0.01-Ag-CLN is lower than that of Gördes CLN activated with 2.0 M HNO3 (0.482 wt.%; Erdoğan & Dikmen, Reference Erdoğan and Dikmen2020), Gördes CLN treated with 0.5AgNO3 after calcining these samples at 450°C for 6 h (1.181 mmol g–1; Ergürhan & Erdoğan, Reference Ergürhan and Erdoğan2025), Demirci CLN treated with 0.02 M AgNO3 (3.239 mmol g–1; Erdoğan et al., Reference Erdoğan, Ekinci Şans and Esenli2025) and NaY (1.19 wt.%; Raj et al., Reference Raj, Prasanth, Dangi and Bajaj2012), zeolite-X (1.60 wt.%; Kurniawan et al., Reference Kurniawan, Romadiansyah, Tsamarah and Widiastuti2018) and ZSM-5-O (0.604 wt.%; Fujiwara et al., Reference Fujiwara, Fujio, Sakurai, Senoh and Kiyobayashi2014) due to the textural and structural differences. The lower H2 uptake obtained in this study for 0.01-Ag-CLN compared to H2 uptake obtained for Demirci CLN treated with 0.02 M AgNO3 can be attributed to differences in particle size between the Gördes and Demirci samples, differences in the Si/Al ratio, differences in pre-degassing temperature prior to hydrogen adsorption experiments and differences in process temperature and duration for ion exchange with AgNO3 (Table 3). Although natural CLN has a lower hydrogen adsorption capacity than more expensive synthetic zeolites, it is abundant in nature. Its gas adsorption properties can be significantly enhanced through modification, providing advantages for hydrogen storage applications. Consequently, the 0.01-Ag-CLN sample, which showed the highest level of hydrogen retention of all of the samples in this study, can be recommended for use in hydrogen storage applications.
H2 adsorption isotherms of the CLN and its Ag-exchanged forms at 77 K.

Figure 3 Long description
Hydrogen adsorption isotherms of CLN and silver-exchanged forms at 77 K. X-axis: Pressure in kPa, ranging from 0 to 113. Y-axis: H subscript 2 uptake in mmol g superscript -1, ranging from 0 to 1.4. Six curves represent different samples: CLN, 0.01-Ag-CLN, 0.03-Ag-CLN, 0.05-Ag-CLN, 0.15-Ag-CLN and 0.30-Ag-CLN. CLN shows the highest uptake, peaking around 1.2 mmol g superscript -1. 0.01-Ag-CLN follows closely. 0.30-Ag-CLN has the lowest uptake, plateauing near 0.3 mmol g superscript -1. Uptake generally increases with pressure across all samples, with distinct separation between curves.
BET specific surface area and H2 retention of CLN samples vs molarity of AgNO3 solution used in the cation-exchange processes.

A comparison of the structural, textural and gas adsorption properties of raw and Ag+-exchanged Gördes and Demirci CLN.

Table 3 Long description
Four clinoptilolite samples are compared by particle size, silicon to aluminum ratio, silver plus exchange and degas conditions, BET and micropore surface area, and hydrogen adsorption capacity. Gördes raw and 0.01 Ag samples use 63 micrometer particles, silicon to aluminum ratios near 5.1, degassing at 300 degrees C for 8 hours, and show similar surface areas around 36 square meters per gram with hydrogen adsorption rising from 0.894 to 1.056 mmol per g after exchange. Demirci raw and 0.02 Ag samples use 5 to 10 micrometer particles, silicon to aluminum ratio 4.79, degassing at 350 degrees C for 8 hours, and have higher hydrogen adsorption than Gördes, increasing from 2.714 to 3.239 mmol per g with exchange. For Demirci, BET and micropore surface areas decrease after silver plus exchange, from 29.5 and 15.4 to 27.5 and 12.1 square meters per gram, indicating uptake gains are not simply tied to higher surface area. Overall, silver plus exchange increases hydrogen adsorption for both sources, with the largest absolute and final uptake in the 0.02 Ag Demirci sample. Comparisons should consider that the two sources differ in particle size and degas temperature, which may also influence adsorption.
a Erdoğan et al. (Reference Erdoğan, Ekinci Şans and Esenli2025).
Conclusions
In this study, the effects of cation exchange with AgNO3 solution at various molarities (0.01, 0.03, 0.05, 0.15 and 0.30 M) on the physicochemical and hydrogen adsorption properties of CLN were investigated. Increasing the molarity of the exchange solution to obtain various Ag+-modified forms caused significant changes, particularly in the 020 peak of the CLN sample, due to changes in its chemical composition. The BET specific surface area values of the Ag-exchanged CLN samples (29.9–36.7 m2 g–1) were similar to that of the original CLN (35.80 m2 g–1). Significant changes in hydrogen adsorption and BET specific surface areas were observed in the modified CLNs due to the increased molarity of the AgNO3 solution. The 0.01-Ag-CLN sample in this study is a promising candidate for hydrogen storage applications due to its optimal BET specific surface area and hydrogen adsorption capacity. In future studies, it may be advisable to include isothermal adsorption heat measurements at multiple temperatures to provide a mechanical perspective on H2–surface interactions and to validate the proposed pore-opening mechanism.
Acknowledgements
The authors would like to thank the Ceramic Research Centre (SAM, Eskişehir, Türkiye) for carrying out the XRF analysis of all of the samples.
Financial support
Financial support is gratefully acknowledged from the Scientific Research Committee of Eskisehir Technical University, under grant number 23ADP046.
Competing interests
The authors declare none.