Introduction
Oocytes grow rapidly in their development from early antral follicles (EAFs) to antral follicles (AFs), and during this development, the granulosa cells secrete E2 in the follicular fluids (Evans et al., Reference Evans, Ireland, Winn, Lonergan, Smith, Coussens and Ireland2004). When bovine oocytes and granulosa cell complexes (OGCs) collected from EAFs are cultured in vitro, the oocytes grow and acquire full developmental competence (Hirao et al., Reference Hirao, Itoh, Shimizu, Iga, Aoyagi, Kobayashi, Kacchi, Hoshi and Takenouchi2004), and the granulosa cells also proliferate and secrete E2 into the culture medium (Xu et al., Reference Xu, West, Shea and Woodruff2006; West-Farrell et al., Reference West-Farrell, Xu, Gomberg, Chow, Woodruff and Shea2008). Studies with aromatase or E2 receptor knockout mice show that the role of E2 in oocyte development is in follicle maturation, including the differentiation of the granulosa cells and the enhancement of the responsiveness of the granulosa cells to gonadotropin stimulation and ovulation (Huynh et al., Reference Huynh, Jones, Thouas, Britt, Simpson and Jones2004; Couse et al., Reference Couse, Yates, Deroo and Korach2005; Emmen et al., Reference Emmen, Couse, Elmore, Yates, Kissling and Korach2005), although the role of E2 in the in vitro growth of oocytes derived from EAFs has not been fully elucidated.
As an oocyte develops in vivo, its mitochondrial DNA copy number (Mt DNA number) increases (Chiaratti et al., Reference Chiaratti, Bressan, Ferreira, Caetano, Smith, Vercesi and Meirelles2010), and oocytes with high Mt DNA numbers are believed to be of high quality (Santos et al., Reference Santos, Shourbagy and John2006). The Mt DNA number of oocytes decreased and the developmental potency of oocytes was low in transcription factor A, mitochondrial (TFAM) knockout mice (Wai et al., Reference Wai, Ao, Zhang, Cyr, Dufort and Shoubridge2010). However, the mechanism underlying mitochondrial proliferation during oocyte growth is unclear. It has been reported that estrogen stimulates the expression of the transcription of nuclear respiratory factor-1 (NRF-1) and induces mitochondrial biogenesis in several types of cells (Mattingly et al., Reference Mattingly, Ivanova, Riggs, Wickramasinghe, Barch and Klinge2008; Chen et al., Reference Chen, Cammarata, Baines and Yager2009), but the effect of E2 on mitochondrial biogenesis in oocytes has not been studied.
As mentioned above, the proliferation of granulosa cells is a prerequisite for follicular growth, and the occurrence of high proliferation depends on their telomerase activity (Lavranos et al., Reference Lavranos, Mathis, Latham, Kalionis, Shay and Rodgers1999; Russo et al., Reference Russo, Berardinelli, Martelli, Di Giacinto, Nardinocchi, Fantasia and Barboni2006). In addition, follicle atresia is related to the loss of telomerase activity in the granulosa cells (Liu & Li, Reference Liu and Li2010). E2 enhances the expression of the telomerase reverse transcriptase (TERT) subunit in human cancer cells (Kondoh et al., Reference Kondoh, Tsuji, Asanuma, Kobayashi and Watanabe2007) and ovarian cells (Misiti et al., Reference Misiti, Nanni, Fontemaggi, Cong, Wen, Hirte, Piaggio, Sacchi, Pontecorvi, Bacchetti and Farsetti2000). Additionally, it induces telomere elongation in human vascular endothelial cells (Ling et al., Reference Ling, Zhou, Li, Dai, Liu, Komesaroff and Sudhir2006). Furthermore, aromatase knockout mice have low telomerase activity in the granulosa cells (Bayne et al., Reference Bayne, Li, Jones, Pinto, van Sinderen, Drummond, Simpson and Liu2011). However, the effect of E2 on the telomere length of post-culture granulosa cells during culture of OGCs has not been reported. This study examined whether the beneficial effect of the supplementation of E2 to the culture medium on oocyte growth is related to mitochondrial biogenesis in the oocytes and telomere elongation in the granulosa cells. In addition, we examined the increases of the Mt DNA number of oocytes during culture of OGCs.
Materials and methods
Reagents and media
Unless otherwise stated, all drugs were purchased from Sigma-Aldrich, (St. Louis, MO, USA). The TCM199 medium (Gibco BRL, Paisley, UK) used for the in vitro culture of OGCs was supplemented with 5.56 mM glucose (final concentration, 11.2 mM), 0.1 mM pyruvic acid, various concentrations of estradiol-17β (E2), 0.02 milliarbitrary units (mAU)/ml follicle-stimulating hormone (FSH) (Kawasaki Mitaka Pharmaceutical Co., Kawasaki, Japan), 4% polyvinylpyrrolidone (PVP) (360K), 4 mM hypoxanthine and 10% fetal calf serum (FCS; 5703H, ICN, Costa Mesa, CA, USA). The TCM199 medium used for the in vitro maturation of oocytes contained 5% FCS.
Collection of ovaries and oocytes from early antral follicles
Bovine ovaries were collected from a slaughterhouse and transported to the laboratory in phosphate-buffered saline (PBS) that contained antibiotics, 10 mM sucrose, 10 mM glucose, and 1 mM pyruvic acid at 30°C within 4 h (Iwata et al., Reference Iwata, Hayashi, Sato, Kimura, Kuwayama and Monji2006; Sakamoto et al., Reference Sakamoto, Iwata, Sato, Hayashi, Kuwayama and Monji2006). The ovaries were wiped with 70% ethanol. The ovarian surface was then sliced and EAFs that were 400–700 μm in diameter were collected in TCM199 medium that contained 3 mg/ml bovine serum albumin (BSA) under a stereomicroscope and an 18G needle that was connected to a syringe. OGCs were retrieved from the EAFs.
Culture of oocytes and granulosa cell complexes and in vitro oocyte maturation
OGCs were washed in culture medium, individually transferred to wells containing 200 μl of medium (96-well plate, Becton, Dickinson and Company, Franklin Lakes, NJ, USA), and cultured for 16 days. Half of the medium was replaced with fresh medium, and antrum formation was examined at intervals of 4 days (4, 8, 12, and 16 days in culture). After the culture period, OGCs were subjected to in vitro maturation for 23 h. After maturation, the oocytes were denuded from the surrounding cumulus cells, fixed, permeabilized, and mounted with antifade containing 4,6-diamidino-2-phenylindole (DAPI) (ProLong® Gold Antifade Reagent with DAPI; Life Technologies, Carlsbad, CA, USA) on glass slides. The nuclear maturation was observed under a fluorescence digital microscope (BZ-8000, Keyence, Osaka, Japan).
Measurement of mitochondrial DNA copy number (Mt DNA number) of oocytes
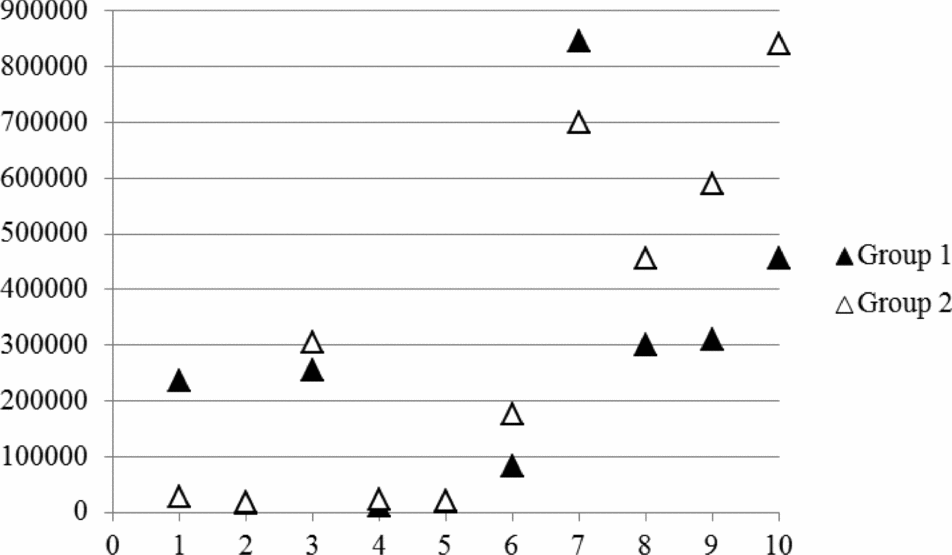
The oocytes from each donor were lysed in 6 μl lysis buffer (20 mM Tris, 0.4 mg/ml proteinase K, 0.9% Nonidet-P40, and 0.9% Tween 20) at 55°C for 30 min followed by 95°C for 5 min. The Mt DNA number was then determined by real-time PCR using a Rotor-Gene 6500 real-time rotary analyzer (Corbett Research, Sydney, Australia) as described previously (Iwata et al., Reference Iwata, Goto, Tanaka, Sakaguchi, Kimura, Kuwayama and Monji2011). The PCR reaction mixture (20 μl) was prepared with 6 μl of extracted DNA, 0.5 μM of each primer (5′-ATTTACAGCAATATGCGCCC-3′ and 5′-AAAAGGCGTGGGTACAGATG-3′), and MESA Blue (qPCR™-Mastermix Plus for SYBR Assay; Eurogentec, Seraing, Belgium). Primers were designed using Primer-BLAST and a bovine mitochondrial ND5 sequence (LOCUS NC006853; 1.82-kb region from base 12,109 to base 13,929). PCR was performed with initial denaturation at 95°C for 5 min followed by 40 cycles at 95°C, 58°C, and 72°C each for 30 s. SYBR green fluorescence was measured at the end of each extension step (72°C). The melting curve was analyzed to check the specificity of the PCR products, and electrophoresis was performed to determine the product size. A standard curve was generated for each run by using 10-fold serial dilutions representing copies of the external standard. The external standard that we used was the PCR product of the corresponding gene cloned into a vector using the Zero Blunt TOPO PCR cloning kit (Invitrogen, Carlsbad, CA, USA); the product was sequenced for confirmation prior to use. Data from the two trials in which the amplification efficiency was less than 1.9 were discarded. It seemed that there were large variations in Mt DNA number among oocytes and donor cows. Moreover, the number of oocytes that were collected from EAFs at each trial was limited. It is difficult to examine the effect of culture conditions on the kinetics of the Mt DNA number during in vitro culture periods by using a small number of randomly selected oocytes. In our previous report, the Mt DNA number obtained from 10 oocytes derived from the AFs (3–6 mm in diameter) of a donor cow highly reflected the characteristics of the donor cow to the extent that there was a highly significant correlation between the Mt DNA number obtained from the 10 oocytes and the Mt DNA number obtained from another 10 oocytes collected from the same donor (Iwata et al., Reference Iwata, Goto, Tanaka, Sakaguchi, Kimura, Kuwayama and Monji2011). In this context, the Mt DNA number of oocytes derived from EAFs was preliminarily measured using a group of five oocytes, and it was compared with the Mt DNA number obtained from another group of five oocytes that were collected from the same donor cow. The Mt DNA number obtained from the group of five oocytes was significantly correlated to that obtained from another group of five oocytes from the same donor cow (Fig. 1). Then, in this study, we used a group of five oocytes collected from one donor cow for each trial on the premise that the Mt DNA number predicted by these five oocytes reflected the characteristics of the donor.
Ten oocytes and granulosa cell complexes (OGCs) were collected from each donor cow and they were divided into two groups. The mitochondrial DNA (Mt DNA) number was measured using five OGCs. The x-axis represents individual cows, and the y-axis represents the Mt DNA numbers per oocyte. There was a significant correlation between the values obtained from each group of five oocytes (r = 0.821, P < 0.01).

DNA extraction from granulosa cells and assessment of telomere length
Granulosa cells were soaked in 50 μl of lysis buffer (20 mM Tris, 0.4 mg/ml proteinase K, 0.9% Nonidet-P40, and 0.9% Tween 20), and the DNA was extracted at 55°C for 30 min followed by 95°C for 5 min. Real-time quantification of relative telomere length was performed based on the protocol described by Mastromonaco et al. (Reference Mastromonaco, Perrault, Betts and King2006). Briefly, reactions were performed in triplicate in 20-μl reaction volumes (6 μl of sample per reaction) for a standard DNA sample and all experimental samples. The PCR reaction mixture (20 μl) contained 6 μl of extracted DNA, 0.5 μM of each primer, and 10 μl of MESA Blue. This assay included amplification of the telomere and a single-copy gene (BTF3) for normalization. The telomere and single-copy gene amplifications were performed in series. The telomere primer sequences were as follows: Tel 1b: 5′-CGGTTTGTTTGGGTTTGGGTTTGGTTTGGGTTTGGGTT-3′; and Tel 2b: 5′-GGCTTGCCTTACCCTTACCCTTACCCTTACCCTTACCCT-3′. The primer sequences for the single-copy gene were as follows: BTF3u: 5′-AGGAACTGCTCGCAGAAAGA-3′; and BTF3d: 5′-GCCCGTAATGGTGAAAGTGT-3′.
The telomere length assay consisted of a 10-min incubation at 95°C for enzyme activation followed by 20 cycles of 95°C for 5 s, 56°C for 10 s, and 72°C for 60 s and fluorescent signal acquisition. The single-copy gene assay consisted of a 10-min incubation at 95°C followed by 35 cycles of 95°C for 5 s, 60°C for 5 s, and 72°C for 20 s and fluorescent signal acquisition. Real-time PCR was performed using the Rotor-Gene 6500 real-time rotary analyzer. Samples containing the highest amounts of DNA were selected as external standards, and three serial dilutions were produced using this DNA. In this experiment, the relative telomere concentration (T) and the relative concentration of a single-copy gene (S) were calculated using an external standard that was amplified in all assays and used for calculating the sample T/S. The sample T/S was compared with the standard sample to give the relative T/S ratio [(sample T/S)/(standard T/S)]. The relative T/S ratio of each sample indicates its telomere length relative to the standard sample.
Experimental design
Experiment 1
In order to find effective E2 concentrations, the effect of various concentrations of E2 on the in vitro growth of EAFs was examined. Thirty OGCs were collected from a cow, and 10 OGCs were allocated to each of three experimental media containing 0.1, 1, and 10 μg/ml E2 and cultured for 16 days. After growth, the oocyte diameter and competency of nuclear maturation of oocytes grown in vitro were examined. The experiment was repeated using 10 cows.
Experiment 2
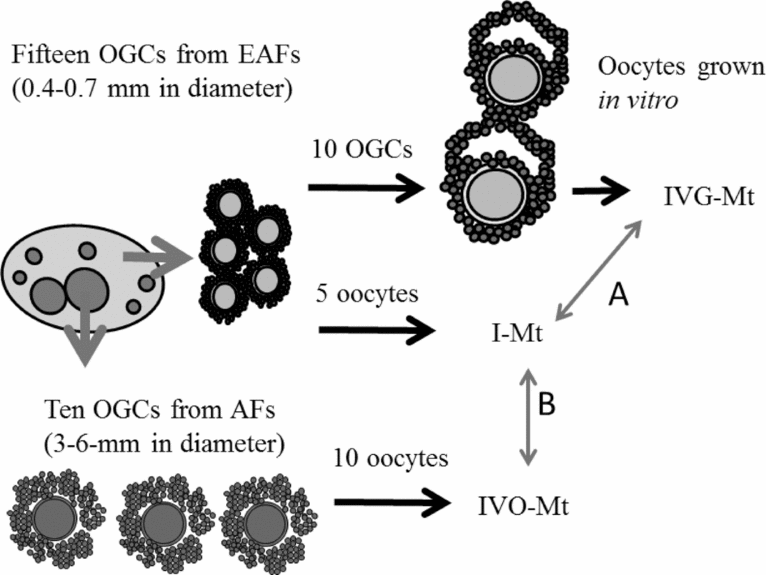
Here, we examined the increases of the Mt DNA number during the in vivo and in vitro growth of oocytes. If the increase of the Mt DNA number differs to a great degree among individual cows, oocytes from the same ovary should be equally allocated to all experimental groups. First, in order to examine the increases of the Mt DNA number during in vivo oocyte growth, five oocytes were collected from EAFs and 10 oocytes were collected from AFs of the same ovary. Then, the Mt DNA numbers of the oocytes were measured and compared among them. In the experiment, 66 cows were used. Second, in order to examine the increases of the Mt DNA number during the in vitro growth of oocytes, we measured the Mt DNA number of the oocytes derived from EAFs before and after the in vitro culture and the Mt DNA number of the oocytes derived from AFs. As shown in Fig. 2, 15 and 10 OGCs were collected from EAFs (0.4–0.7 mm in diameter) and AFs (3–6 mm in diameter), respectively, and the Mt DNA number of the oocytes derived from EAFs was measured using 5 OGCs. This was defined as the Mt number immediately after collection (I-Mt). The Mt DNA number of the oocytes derived from AFs was also measured using the 10 oocytes derived from AFs, and this number was defined as the Mt DNA number of in vivo–grown oocytes (IVO-Mt). The remaining 10 OGCs collected from the EAFs were cultured in the medium containing 10 μg/ml E2 for 16 days. At the end of the culture period, the ratio of antrum formation was determined, and oocytes were collected from the OGCs with antra to be used for the measurement of the Mt DNA number. This Mt DNA number was defined as the Mt DNA number of oocytes grown in vitro (IVG-Mt). The ratio of IVO-Mt to I-Mt represents the expected increasing ratio of the Mt DNA number, and the ratio of IVG-Mt to I-Mt represents the true increasing ratio of the Mt DNA number. A total of 26 cows were used in this experiment.
Fifteen oocytes were collected from early antral follicles (EAFs). Five of them were used for the measurement of the mitochondrial DNA (Mt DNA) number immediately after collection (I-Mt). The remaining 10 oocytes and granulosa cell complexes (OGCs) derived from the EAFs were cultured for 16 days, and the ratio of antrum formation was examined. Oocytes grown in vitro were collected from OGCs having antra and they were used for measuring the Mt DNA number (IVG-Mt). Ten oocytes were collected from antral follicles (AFs) (3–6 mm in diameter), and their Mt DNA numbers were also examined (IVO-Mt). IVG-Mt/I-Mt (A) was defined as the expected increasing ratio of the Mt DNA number, and IVO-Mt/I-Mt was defined as the true increasing ratio of the Mt DNA number (B).
Experiment 3
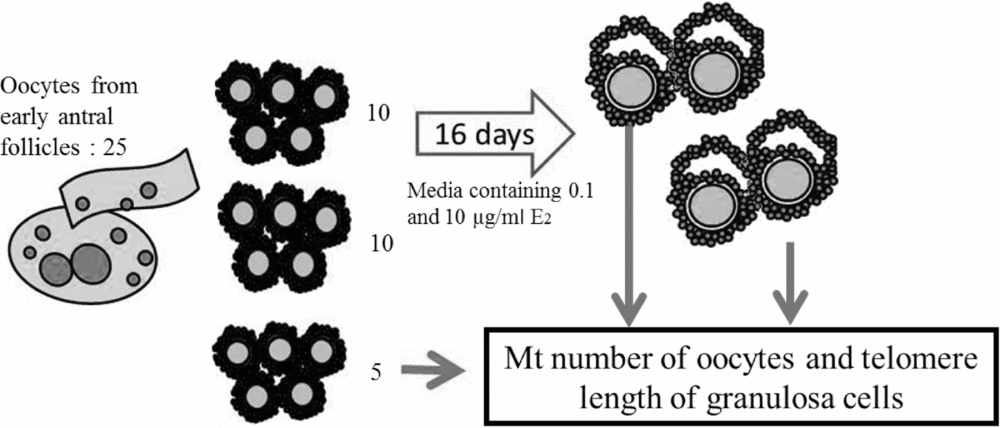
In this experiment, the effect of E2 on the Mt DNA number of oocytes grown in vitro and on the telomere length of the granulosa cells was examined. As shown in Fig. 3, 25 OGCs were collected from each donor cow. The Mt DNA number of the oocytes immediately after collection was obtained using five oocytes, and the remaining 20 OGCs were cultured for 16 days in the medium containing 0.1 or 10 μg/ml E2. At the end of the culture period, the oocytes were collected from OGCs having antra, and the Mt DNA numbers of the oocytes grown in vitro were measured. At the time of oocyte collection, the granulosa cells of the OGCs were collected and washed, and the DNA of the granulosa cells was then extracted for telomere measurement. This experiment used 15 cows.
Twenty-five oocytes were collected from the early antral follicles (EAFs) of donor cows. Five of them were used for the measurement of the mitochondrial DNA (Mt DNA) number immediately after collection, and at that time, DNA was extracted from the granulosa cells to be used for telomere length measurement. The remaining 20 oocytes were cultured for 16 days in a medium containing 0.1 or 10 μg/ml estradiol-17β (E2). Oocytes derived from oocytes and granulosa cell complexes (OGCs) having antra were used for the Mt DNA number measurement, and telomere length was also measured using the granulosa cells of OGCs cultured in vitro.
Statistical analysis
Data were compared using two-tailed Student's t-tests, and Pearson's correlation coefficients were calculated. Antrum formation and nuclear maturation among three E2 concentrations were analyzed by analysis of variance (ANOVA), followed by Tukey's post–hoc tests. The ratios of antrum formation and nuclear maturation were arcsine-transformed prior to analysis. All of the statistical analyses were performed with SPSS (version 17.0) software (SPSS Inc., Chicago, IL, USA). A value of P < 0.05 was considered to be significant.
Results
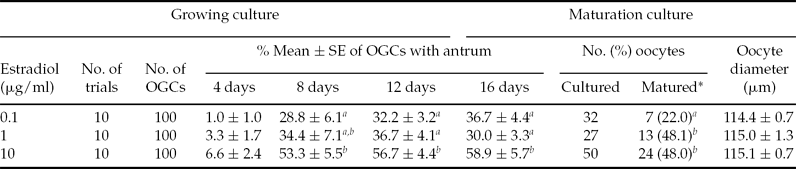
When OGCs were cultured in the medium without E2 supplementation, only 3.3% of OGCs formed antra, and none of the OGCs reached the MII stage (data not shown). The effects of E2 concentration on antral formation and subsequent oocyte maturation during growth of OGCs derived from EAFs are summarized in Table 1. Supplementation of 0.1, 1, and 10 μg/ml E2 improved antral formation and the ratio of oocytes reaching the MII stage compared with other groups. There were significant differences in the ratios of antral formation and nuclear maturation between 10 μg/ml E2 and 0.1 μg/ml E2.
Effect of estradiol concentration on the development of oocyte–granulosa cell complexes (OGCs) and subsequent potency of grown oocytes for maturation
OGCs collected from EAFs were cultured for 16 days. The antrum formation in OGCs was recorded at 4-day intervals. The diameter of oocytes was measured at the end of the growing culture period, and only OGCs with antra were cultured for 23 h to evaluate their potency for maturation. SE, standard error.
*Oocytes with MII chromosomes.
a,bDifferences between numbers marked by different superscript letters are statistically significant (P < 0.05).
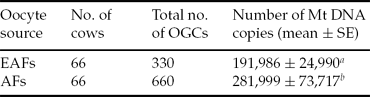
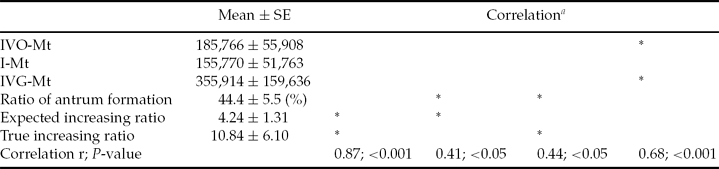
In Experiment 2, we compared the Mt DNA number of oocytes between EAFs and AFs. Their average Mt DNA numbers were 191,986 ± 24,990 and 281,999 ± 73,717, respectively, and there was a significant difference between the two values (P < 0.05, Table 2). The ratio of increase (antral/early antral) ranged from 0.12 to 26.6, and the average ratio of increase was 3.47. Then, the increases of the Mt DNA number during the in vitro culture of OGCs derived from EAFs were examined. At the end of the culture period, 44.4% of the OGCs formed antra, and the average Mt DNA number obtained from the oocytes grown in vitro was 355,914 ± 159,636. The true ratio of increase (IVG-Mt/I-Mt, after/before) ranged from 0.07 to 78.5, and the average ratio of increase was 10.8. The correlations between the selective combinations of the ratio of antrum formation, I-Mt, IVO-Mt, IVG-Mt, expected ratio of increase (IVO-Mt/I-Mt), and true ratio of increase (IVG-Mt/I-Mt) are summarized in Table 3. The true increasing ratio was highly correlated with the expected increasing ratio (r = 0.87, P < 0.001) and was significantly correlated to the ratio of antral formation (r = 0.44, P < 0.05). In addition, the IVO-Mt was related to the IVG-Mt (r = 0.68, P < 0.001). In Experiment 3, the Mt DNA number of the oocytes immediately after collection was 289,454 ± 75,254 (Table 4). When OGCs were cultured in medium containing 0.1 or 10 μg/ml E2 for 16 days, 43.3 and 56.0% of the OGCs formed antra, and the average Mt DNA numbers of oocytes grown in vitro were 312,320 ± 64,997 and 454,650 ± 144,259 respectively, but the difference between the two values was not significant. The relative telomere length of granulosa cells derived from OGCs cultured in vitro to that of the initial level was 1.08 ± 0.16 for 0.1 μg/ml E2 and 4.15 ± 1.36 for 10 μg/ml E2, which was significantly different (P < 0.05).
Number of mitochondrial DNA copies in oocytes just after collection from early antral follicles (EAFs) and antral follicles (AFs)
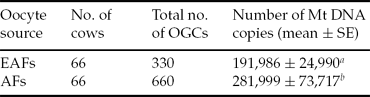
OGCs were collected from early antral follicles (0.4–0.7 mm in diameter) and antral follicles (3–6 mm in diameter) of the same ovaries. a,bDifferences between numbers marked by different superscript letters are statistically significant (P < 0.05). SE, standard error.
Correlation between combinations of two parameters selected from IVO-Mt, IVG-Mt, ratio of antrum formation, expected increasing ratio and tru increasing ratio
aThe correlation was evaluated between the two parameters that are marked by asterisks. IVO-Mt, Mt DNA number of in vivo grown oocytes from AFs; I-Mt, Mt DNA number immediately after collection from EAFs; IVG-Mt, Mt DNA number of in vitro grown oocytes that were cultured for 16 days; expected increasing ratio IVO-Mt/I-Mt; true increasing ratio, IVG-Mt/I-Mt.
Number of mitochondrial DNA copies of oocytes and relative telomere length of granulosa cells collected from OGCs after in vitro growing culture
*Only OGCs that formed an antrum after culture for 16 days were used as samples for the examination of telomere length of granulosa cells.
**The relative telomere length was shown by the ratio of the number of Mt DNA copies after culture to the number of Mt DNA copies immediately after collection (before culture). a,bDifferences between numbers marked by different superscript letters are statistically significant (P < 0.05).
Discussion
The present study shows that the increase in the Mt DNA numbers of oocytes during both in vivo and in vitro growth varies to a great degree among individual cows. The overall Mt DNA number increased as an oocyte grew in vitro, and the increasing ratio could be predicted by the expected increasing ratio, IVO-Mt/I-M. This study showed that 10 μg/ml E2 in the medium improved the in vitro growth of oocytes, but E2 did not significantly affect the Mt DNA numbers of oocytes grown in vitro. However, 10 μg/ml E2 significantly increased the telomere length of granulosa cells compared with 0.1 μg/ml E2.
Mitochondria are crucial cellular organelles and they have multiple functions in cell metabolism. The number of mitochondria in oocytes has been reported to be related to their developmental potency (Reynier et al., Reference Reynier, May-Panloup, Chrétien, Morgan, Jean, Savagner, Barrière and Malthièry2001). A comparison between small follicles and large follicles in cows and pigs (Chiaratti et al., Reference Chiaratti, Bressan, Ferreira, Caetano, Smith, Vercesi and Meirelles2010; El Shourbagy et al., Reference El Shourbagy, Spikings, Freitas and St John2006). showed that the Mt DNA number increases during oocyte growth in vivo. However, only few studies have shown the dynamic changes in mitochondrial quality and quantity in oocytes grown in vitro. The results of this study show a significant increase in the Mt DNA number both in vivo and in vitro, and the increasing ratio varies a great degree among cows. Interestingly, there is a high correlation between the expected ratio of increase and the true ratio of increase (r = 0.87, P < 0.001). This result suggests that oocytes with a high expected ratio of increase are on their way to mitochondrial proliferation, and that when these oocytes are cultured in vitro, the Mt DNA number of the oocyte is likely to show a relatively large increase. The results also suggest that there is a differential metabolic background underlying oocytes with high mitochondrial biogenesis, which makes it difficult to investigate mitochondrial biogenesis in oocytes collected from EAFs. Thus, we used many OGCs collected from the same donor, and these OGCs were equally allocated to examine the effect of culture conditions on the increases of the Mt DNA number. We have reported that oocytes derived from old cows have a low Mt DNA number (Iwata et al., Reference Iwata, Goto, Tanaka, Sakaguchi, Kimura, Kuwayama and Monji2011). In addition, there is accumulating evidence that mitochondrial quality is low in oocytes derived from old females (Wang et al., Reference Wang, Wang, Zou and Xu2009). The control mechanisms of mitochondrial biogenesis in cells are the key focus of a study regarding age-associated diseases (Weber & Reichert, Reference Weber and Reichert2010). However, no study has shown the factors that affect the Mt DNA number in growing oocytes derived from EAFs. E2 influences mitochondrial biogenesis via increasing the expression of nuclear respiratory factor-1 (NRF-1), and E2 also stimulates the expression of Tfam and Tfam-regulated mitochondrial DNA-encoded COI and ND1 genes in MCF-7 breast cancer and H1793 lung adenocarcinoma cells (Mattingly et al., Reference Mattingly, Ivanova, Riggs, Wickramasinghe, Barch and Klinge2008). In this study, the culture of OGCs collected from EAFs with 10 μg/ml E2, but not with 0.1μg/ml E2, resulted in efficient antrum formation, improvement of in vitro oocyte growth, and acquisition of higher potency of nuclear maturation after succeeding maturation culture. The results showed 10 μg/ml to be an effective E2 concentration and 0.1 μg/ml to be a much less effective E2 concentration. The Mt DNA number of oocytes grown in the medium that contained 10μg/ml E2 was higher than that of oocytes cultured with 0.1 μg/ml E2, though there was no significant difference between them. Although E2 did not clearly affect the increase of Mt DNA number, the large variation of Mt DNA number after culture of OGCs with 10 μg/ml E2 may be one of the main reasons that the difference was not significant. The stimulatory effect of E2 on cellular mitochondrial biogenesis is reported to depend on cellular types (Mattingly et al., Reference Mattingly, Ivanova, Riggs, Wickramasinghe, Barch and Klinge2008) and on the estrogen receptor ratio (ERα/ERβ). E2 stimulates mitochondrial proliferation in cells having predominantly ERα and low mitochondrial activity, whereas E2 has the reverse effect on cells having predominantly ERβ and high mitochondrial activities (Sastre-Serra et al., Reference Sastre-Serra, Nadal-Serrano, Pons, Valle, Oliver and Roca2012). Oocytes in cows and pigs predominantly have ERβ (Beker-van Woudenberg et al., Reference Beker-van Woudenberg, van Tol, Roelen, Colenbrander and Bevers2004; Hattori et al., Reference Hattori, Arai, Saruwatari and Kato2004).
During the in vitro culture of OGCs, granulosa cells proliferate and form dome-like structures (Hirao et al., Reference Hirao, Itoh, Shimizu, Iga, Aoyagi, Kobayashi, Kacchi, Hoshi and Takenouchi2004). Additionally, antrum formation is a critical marker of oocyte development because at the end of the culture periods, most of the oocytes that were contained in OGCs without antra were dead under our culture conditions. This finding indicates that cell-to-cell and cell-to-oocyte communications and the junctions and cell proliferation associated with well-formed antra are prerequisites for the in vitro growth of oocytes. There have been many studies showing that high telomerase activity and elongated telomeres have been observed in the granulosa cells of small follicles (Russo et al., Reference Russo, Berardinelli, Martelli, Di Giacinto, Nardinocchi, Fantasia and Barboni2006). E2 injection of immature rats stimulates the telomere activity of granulosa cells and decreases follicle atresia (Yamagata et al., Reference Yamagata, Nakamura, Umayahara, Harada, Takayama, Sugino and Kato2002). In addition, granulosa cells of aromatase knockout mice have low telomerase activity and short telomere length, and the expression levels of Tert and c-Myc are low compared with those of wild type mice (Bayne et al., Reference Bayne, Li, Jones, Pinto, van Sinderen, Drummond, Simpson and Liu2011). As we expected, a high concentration (10 μg/ml) of E2 increased the telomere length of granulosa cells, which may support the maintenance of high viability in the granulosa cells of the OGCs during in vitro culture. Based on our results, the beneficial effect of E2 on in vitro oocyte development is due to increased telomere length, which may support granulosa cell proliferation and its functions.
In conclusion, E2 improved the in vitro growth of oocytes in OGCs derived from EAFs, and one of its effects was the maintenance of the telomere length of the granulosa cells during in vitro culture.