I. INTRODUCTION
Hydrogen embrittlement, whereby hydrogen reduces ductility and fracture stress and thus degrades the mechanical properties of almost all metals and alloys, is believed to be one of most common causes leading to an increasing number of material failures in variety of engineering materials, e.g., oil/gas transmission pipelines carbon steels and nuclear reactor pressure vessel steels.Reference Steigerwald, Schaller and Troiano1–Reference Toplosky and Ritchie9 Extensive experiments have been conducted to relate macroscopic and microscopic properties using different techniques such as permeation measurement,Reference Hirth10 autoradiography,Reference Asaoka, Daggbert, Aucouturier and Galland11, Reference Asaoka, Lapasset, Aucouturier and Lacombe12 thermo analysis method,Reference Lee and Lee13, Reference Addach, Bercot, Rezrazi and Wery14 and nuclear resonance reaction analysis.Reference Castellote, Fullea, de Viedma, Andrade, Alonso, Llorente, Turrillas, Campo, Schweitzer, Spillane, Livingston, Rolfs and Becker15 It is commonly accepted that diffusion and segregation of interstitial hydrogen atoms to material defects (e.g., voids, dislocations, grain boundaries, and cracks) and the consequent interactions between hydrogen atoms and defects play an important role in hydrogen embrittlement. Based upon experimental observations, different mechanisms have been proposed, including hydrogen-induced hydride formation,Reference Westlake16 hydrogen-induced lattice decohesion model,Reference Steigerwald, Schaller and Troiano1, Reference Gest and Troiano17 hydrogen-enhanced localized plasticity model,Reference Birnbaum and Sofronis18, Reference Sofronis and Birnbaum19 and a recent hydrogen-enhanced stress-induced vacancy mechanism.Reference Takai, Shoda, Suzuki and Nagumo20 Unfortunately, a complete understanding of hydrogen effects on materials mechanical behavior is still lacking owing to the complexity of microstructure of metallic materials and the difficulty of direct observation of hydrogen interaction with defects mainly caused by small size, high diffusivity, and low solubility of hydrogen in metals.Reference Hirth10
With recent increases in computer processor speed along with the development of massive parallel computing architectures, computer simulation is becoming an alternative approach to study hydrogen physics in iron. Ab initio calculation based on density functional theory (DFT) is able to accurately predict hydrogen adsorption, dissolution, and diffusion energies in iron. Meanwhile, ab initio calculation also suggests that hydrogen atoms prefer to stay at tetrahedral interstitial sites rather than octahedral interstitial sites in undeformed iron lattice and prefer to segregate to free surface rather than stay in the subsurface or the bulk.Reference Ramasubramaniam, Itakura and Carter21–Reference Yamaguchi, Ebihara, Itakura, Kadoyoshi, Suzudo and Kaburaki24 However, such calculations have some limitations in addressing hydrogen diffusion near grain boundary or other defects due to the complexity of atomic structures of these defects and multiple diffusion paths within defects. Classical molecular statics and molecular dynamics (MD) simulation can overcome these difficulties and provide additional useful information. Wen et al.Reference Wen, Fukuyama and Yokogawa25 performed atomistic simulations using nudged elastic band method to estimate the hydrogen effect on the activation energy for kink-pair nucleation near a screw dislocation and confirmed that hydrogen-induced softening/hardening is related to the transition of hydrogen to its stronger/weaker binding sites. Taketomi et al.Reference Taketomi, Matsumoto and Miyazaki26 examined diffusion paths of hydrogen around a {112}〈111〉 edge dislocation. Hyde et al.Reference Hyde, Farkas and Caturla27 explored grain boundary sliding mechanisms of a Σ5 symmetric tilt grain boundary and indicated the possibility of hydrogen impurity induced nucleation of grain boundary dislocation. In addition, a number of simulationsReference Taketomi, Matsumoto and Miyazaki26, Reference Taketomi, Matsumoto and Miyazaki28, Reference Matsumoto, Taketomi, Matsumoto and Miyazaki29 reported that hydrogen atoms trapped around crack tip will reduce the energy barriers for dislocation emission and therefore enhance the mobility of dislocations.
The previous works largely focused on the dynamics of interaction between hydrogen and crack tip and dislocations.Reference Wen, Fukuyama and Yokogawa25–Reference Matsumoto, Taketomi, Matsumoto and Miyazaki29 Given the fact that most of the engineering important iron-based materials are polycrystalline and the microstructures formed by the network of grain boundaries play an essential role in determining physical, mechanical, and chemical properties of these materials, it is surprising that few works have been performed on the effects of grain boundary on hydrogen diffusion. Therefore, it is necessary to further our knowledge on hydrogen behaviors near grain boundaries to better understand the mechanisms of hydrogen embrittlement.
The main objective of this article is to investigate the effects of grain boundary and boundary inclination on hydrogen diffusion in α-iron using MD simulation. The article is organized as follows: in section 2, we describe the grain boundary bicrystallography, the simulation details, the method used to determine grain boundary self-diffusivity, and Voronoi polyhedral statistical analysis that was used to calculate specific grain boundary excess volume. In the next section, we present the hydrogen diffusivity data in the bulk, free surface and Σ5 symmetric tilt grain boundary (STGB), and further the hydrogen diffusivity data as a function of inclination in a series of Σ5 tilt grain boundaries. To better understand inclination dependence of hydrogen diffusion, we also present grain boundary energy and specific excess volume as a function of inclination to correlate with diffusivity data. Moreover, an effect of hydrostatic pressure on hydrogen diffusion in bulk is presented. In the last section of this article, we draw conclusions based upon our observations.
II. SIMULATION METHODOLOGY
Three different types of models were made for the calculation of hydrogen diffusivity. For the bulk Fe model, a perfect body-centered cubic (bcc) α-iron simulation cell was first constructed with crystallographic directions [100], [010], and [001] in the x-, y-, and z-directions, respectively. The simulation cell comprising 86000 Fe atoms is 10 × 10 × 10 nm along the x-, y-, and z- directions with periodic boundary conditions. Based upon experimentsReference Manchester30 and first-principle calculationReference Ramasubramaniam, Itakura and Carter21 results, the tetrahedral interstitial sites are known to be the most stable location of an interstitial hydrogen atom in an undeformed α-Fe crystal. Here 1000 hydrogen atoms (about 1 at.%,) were first randomly placed in the tetrahedral sites of Fe atoms. For the free surface model, two empty “ghost” spaces of 2 nm thickness were added on the top and the bottom of the bulk model along the z-direction. We just set the free surfaces in the z-direction and keep periodic boundary conditions in x- and y-directions. An initial relaxation of 4 ns was performed to ensure all hydrogen atoms have diffused onto the two free surfaces.
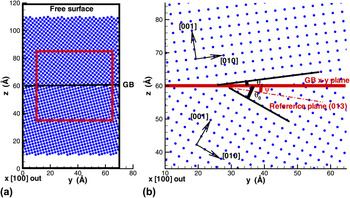
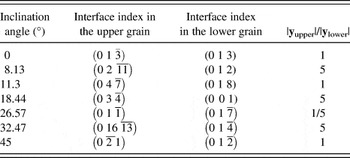
For the grain boundary model, it is well known that the crystallography of grain boundary can be minimally specified by five variables: three parameters to specify the relative orientation of one grain with respect to the other and two to indicate the grain boundary inclination.Reference Gottstein and Shvindlerman31 To obtain a comprehensive understanding of hydrogen diffusion behaviors near grain boundaries, we constructed a series of flat θ = 36.87° Σ5 [100] tilt grain boundaries with different inclinations. A typical grain boundary model as shown in Fig. 1(a) has periodic boundary conditions in x- and y-directions and free surfaces in the z-direction. Equilibrium atomic configuration of a typical Σ5 [100] tilt grain boundary (with inclination angle ψ = 8.13°) is shown in Fig. 1(b) [the same enlarged area in Fig. 1(a)], where only one layer of (100) iron atoms near the grain boundary is displayed for the sake of clarity. The lower crystal is rotated about the x-axis ([100] tilt axis) with an angle of θ 0, while the upper crystal is rotated with an angle of θ 1, in which the sum of θ 0 and θ 1 equals to the misorientation angle θ = 36.87°. In all cases, the grain boundary plane normal is perpendicular to the x–y plane. The angle ψ measures the boundary inclination with respect to a (013) plane in the lower crystal. We limit our choice of θ 0 and θ 1 to cases where the periodicity of the upper and lower grains is commensurate along y-direction.Reference Zhang, Mendelev and Srolovitz32 Take an example of grain boundary with inclination angle ψ = 8.13° as shown in Fig. 1, the boundary plane in the upper crystal is  , while the boundary plane in the lower plane is (012). The length of the y-axis (between two atoms) in the upper crystal |yupper| is
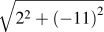 and the length of the y-axis in the lower crystal |ylower| is
 . To achieve commensurate periodicity between the upper and lower grains, the ratio of |yupper| to |ylower| has to be an integer number or an inverse of an integer. In this particular case, the ratio is 5, suggesting no elastic strain will be created when two crystals meet. In this study, we examined seven inclination angles in a range of 0 and 45° (because of 4-fold rotational symmetry of the crystal about the [100] axis), where ψ = 0° and ψ = 45° refer to two STGBs, Σ5 [100]/(013) and Σ5 [100]/(012), respectively. The plane indices of the interface between the upper and lower crystals as well as the ratios of |yupper| to |ylower| in seven different grain boundary inclinations are listed in Table I.
(a) A schematic illustration of an asymmetric Σ5 [100] tilt grain boundary in bcc Fe (with inclination angle ψ = 8.13°), (b) atomic configuration of the same enlarged area in (a). For the sake of clarity, only Fe atoms in one (100) layer are shown.

Boundary plane indices of Σ5 [100] tilt grain boundary with different inclination angles.

MD simulations were performed using the Gibbs ensemble (NPT). This method combined the Parrinello–Rahman methodReference Parrinello and Rahman33 for controlling the pressure and simulation box size and the Nose–Hoover methodReference Nose34 for maintaining constant temperature. The interatomic interaction was described using CarterReference Ramasubramaniam, Itakura and Carter21 form of the Embedded Atom Method (EAM)Reference Daw and Baskes35 potential for Fe–H. This potential is based on the EAM potentials of Mendelev et al.Reference Mendelev, Han, Srolovitz, Ackland, Sun and Asta36 and Ackland et al.,Reference Ackland, Mendelev, Srolovitz, Han and Barashev37 and an extensive database of energies and atomic configurations from DFT calculations have been fit the cross interaction of H and Fe. All simulations were carried out using LAMMPS code.Reference Plimpton38
After initial construction, atoms near the grain boundary region (i.e., a 2-nm slab parallel to and centered upon the mean boundary plane) are relaxed at 1000 K to reach a better equilibrium state, while other atoms in the bulk are kept at 700 K. It is possible that residual stress will be developed between the grain boundary region and the bulk due to the temperature gradient. The grain boundary region will be relaxed at this elevated temperature for 500 ps and then cooled down to 700 K at a cooling rate of 0.5 K/ps followed by energy minimization using the conjugate gradient methodReference Daniel39 until the forces on atoms are below 10−10 eV/Å. It is expected that the residual stress will be eliminated during this process.
After grain boundary structure reaches equilibrium, a certain percentage of hydrogen atoms are added in the tetrahedral interstitial sites in a region between 20 Å < z < 100 Å (a small slab parallel to and centered upon the mean boundary plane is excluded since tetrahedral interstitial sites are difficult to define.) A relaxation is then performed to ensure all hydrogen atoms have moved onto grain boundary or on the free surfaces. For diffusivity calculation, only those hydrogen atoms trapped in the grain boundary are taken into account.
The local atomic environments of grain boundary atoms are characterized using Voronoi analysis.Reference Sachdev and Nelson40, Reference Borodin41 The lines connecting an atom with its neighbors are bisected with planes and the intersections of these planes form the Voronoi polyhedron of each atom. In particular, when performing Voronoi polyhedral statistical analysis, we removed those surfaces with areas less than 1% of the total area of the polyhedron surfaces, as well as those edges with lengths less than 5% of the average length of that polyhedron surface. By doing so, the degeneracy problem, the effects of thermal vibration, numerical imprecision, and rounding errors during calculation are minimized.Reference Sheng, Luo, Alamgir, Bai and Ma42, Reference Brostow, Chybicki, Laskowski and Rybicki43 Average atomic volume change of Fe atoms near the boundary plane region is calculated using Voro++ code.Reference Rycroft, Grest, Landry and Bazant44
III. RESULTS AND DISCUSSION
A. Hydrogen diffusion in bulk, on surface, and in symmetric grain boundary
The diffusion coefficient (D H) of interstitial hydrogen atoms in Fe can be calculated via MD simulation through the well-known Einstein equationReference Shewmon45

where d represents the dimension of the models involved in the calculation, i.e., 1 for diffusivity calculation along certain direction, 2 for surface and grain boundary, 3 for diffusivity in bulk, N is the total number of hydrogen atoms, r(t 0) is the position of hydrogen atom at time t 0, r(t 0+Δt) is the position of hydrogen atom after time interval Δt. The total mean-squared displacement (MSD) over N hydrogen atoms is calculated according to the equation

Hydrogen diffusivity is equivalent to the slope of the MSD curve versus time.
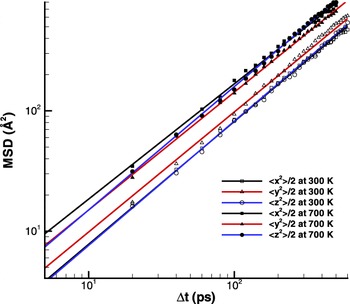
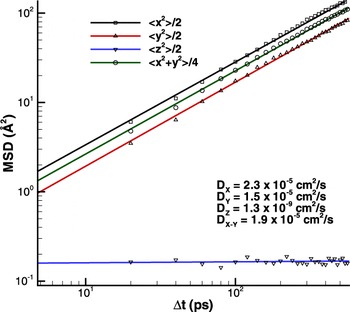
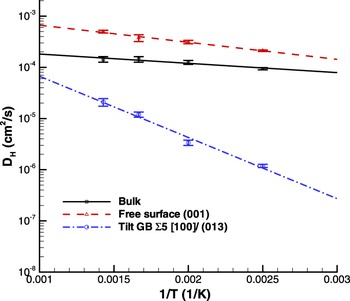
Figure 2 shows a typical hydrogen MSD as a function of time interval Δt in the bulk iron at T = 300 K and T = 700 K. We examine the MSD along x-, y-, and z-directions independently and perform linear least squares regression to each dimension to obtain corresponding diffusivities. The average MSD and the diffusivity in the bulk are also calculated and shown in the Fig. 2. They all exhibit the similar value at 0.9×10⁻⁴cm2/s, suggesting that hydrogen diffusion in bulk is isotropic. The average diffusivity value is in good agreement with experimentally obtained in pure and undeformed α-iron at room temperature of about 1.0×10⁻⁴cm2/s.Reference Riecke, Johnen and Grabke46–Reference Quick and Johnson51 For comparison of diffusivity, the hydrogen MSD as a function of time interval Δt in Σ5 [100]/(013) STGB at 700 K is shown in Fig. 3. Diffusivity along the tilt axis (x-direction) is 2.3×10⁻⁵cm2/s, which is one order of magnitude lower than that in the bulk, 1.6×10⁻⁴cm2/s at 700K. The diffusion coefficient parallel to the grain boundary plane (y-direction) is only two-third of that along the tilt axis, while diffusion coefficient perpendicular to grain boundary plane (z-direction) is almost zero (four orders of magnitude lower than that along tilt axis). This huge difference in diffusion coefficient along each dimension implies that hydrogen diffusion in the grain boundary is anisotropic and hydrogen atoms have a high possibility to be trapped in grain boundary plane once they move close to the region (this is evident by hydrogen grain boundary segregation energy, as described below). Similarly, hydrogen diffusion on a free surface (001) also exhibits the anisotropy where the diffusivity in the free surface (x–y plane) is six orders of magnitude higher than perpendicular to the surface. Figure 4 shows hydrogen diffusivity at T = 400, 500, 600, and 700 K for α-iron bulk, (001) plane of the free surface, and Σ5 [100]/(013) STGB. Note, the diffusivity in bulk is a mean of three directions, while the diffusivities on the free surface and grain boundary are the averages of diffusion in x–y plane. Evidently, at each temperature, hydrogen diffusion shows highest on free surface and lowest in grain boundary. In each case, the diffusivity ln(D H) shows reasonable linearity with the inverse temperature 1/T. This implies that hydrogen diffusivity can be described as an Arrhenius function of temperature, as expressed by D H = D 0 exp(− Q / RT). Linear fitting of the data set to the equation allows us to extract the activation energy for hydrogen diffusion Q (from the slope) and the pre-exponential factor D 0 (from the intercept). The activation energies for hydrogen diffusion in bulk, free surface, and STGB are 0.044, 0.066, and 0.31 eV, respectively. The activation energy for hydrogen diffusion in α-iron bulk is in good agreement with experimental findings, i.e., 0.043 eV.Reference Riecke and Bohnenkamp52 The higher the activation energy set, the higher barrier for hydrogen atoms to cross and continues the diffusion process; hence the grain boundary has the trapping sites for hydrogen.
Mean-squared displacement (MSD) curves of interstitial hydrogen atoms along three dimensions in the bulk Fe at T = 300 K and T = 700 K.

MSD curves of hydrogen atoms along three dimensions in Σ5 [100]/(013) symmetric tilt grain boundary (STGB) at T = 700 K.

Diffusion coefficients of hydrogen atoms in bulk, on free surface and in a Σ5 [100]/(013) STGB. The linear line is a least-square fit to the data points. The activation energies for hydrogen diffusion in bulk, free surface, and STGB are 0.044, 0.066, and 0.31 eV, respectively.

To quantitatively understand hydrogen grain boundary trapping behavior, we calculate the grain boundary segregation energy of hydrogen, as defined as  , where
 is the hydrogen dissolution energy in bulk and
 is the hydrogen dissolution energy in grain boundary. The hydrogen dissolution energy in bulk can be expressed as

where E(FeNH) is the total potential energy of the system including N Fe atoms and 1 hydrogen atom, E(FeN) is the total energy of the system including N Fe, and E[H2(g)] is the total energy of hydrogen molecule (−4.54 eV). Similarly, the hydrogen dissolution energy in GB is defined as

where n is the total number of hydrogen atoms in the grain boundary region, E n,H is the total potential energy of n hydrogen atoms in GB,  is the grain boundary excess energy with n hydrogen atoms, and
 is the grain boundary excess energy without hydrogen atoms. The definition of grain boundary excess energy is described in Eq. (5).
The hydrogen dissolution energy in bulk Fe was estimated to be 0.26 eV at 300 K, and the hydrogen dissolution energy in Σ5 [100]/(013) STGB at 300 K was determined to be −0.28 eV, hence, the segregation energy of hydrogen in Σ5 [100]/(013) STGB at 300 K is equal to −0.54 eV. This value is consistent with recent first principal calculation of segregation energy of hydrogen in BCC Fe ∑3 (111) GB (−0.45 eV).Reference Yamaguchi, Ebihara, Itakura, Kadoyoshi, Suzudo and Kaburaki24, Reference Gesari, Pronsato and Juan53 Both the activation energy for diffusion and segregation energy in the GB suggest that hydrogen atoms in bulk would have a tendency to diffuse towards the grain boundary and are trapped there. The accumulation of hydrogen near the grain boundary plays the essential role in the crack initialization and propagation since it would decrease the cohesive energy of GB and the fracture stress.Reference Kishi and Takano54–Reference Strnadel56
B. Grain boundary inclination dependence of hydrogen diffusivity
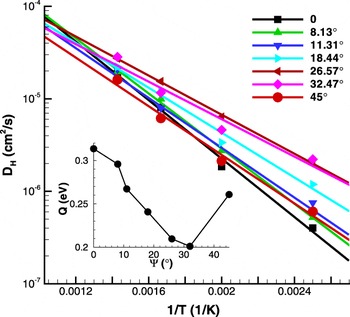
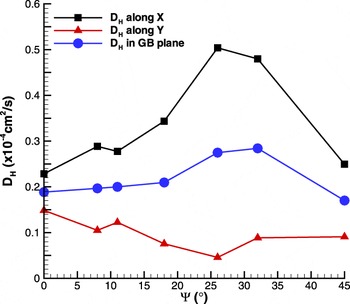
Figure 5 shows diffusion coefficients of interstitial hydrogen in a series of Σ5 [100] tilt grain boundaries with different boundary inclinations at T = 400, 500, 600, and 700 K. The variation in hydrogen diffusivity among different inclinations is large at T = 400K (more than one order of magnitude), while the difference becomes smaller at higher temperature, which suggest that diffusivities are much more anisotropic at low temperature than at high temperature. The linear fitting of diffusivities versus T in Arrhenius coordinates yields activation energies for diffusion for each inclination. The inset of Fig. 5 shows the activation energies for hydrogen diffusion in grain boundaries as a function of inclination. Since there is 4-fold rotational symmetry of the crystal about the [100] axis, this data indeed suggest two local maxima exist at ψ = 0° and 45°, which correspond to Σ5 [100]/(013) and Σ5 [100]/(012) STGBs, respectively, and one local minimum at ψ = 32.47°. This result suggests that hydrogen diffusion in grain boundaries is linked with the specific interface of grain boundary. Furthermore, Fig. 6 shows the hydrogen diffusivities along tilt axis (x-direction), along grain boundary plane (y-direction), and within grain boundary plane (x–y plane) as a function of inclination at 700 K. Evidently, at each inclination, hydrogen diffusivity exhibits anisotropy, i.e., fast along tilt axis and slow perpendicular to tilt axis. More importantly, this anisotropy becomes stronger as inclination angle increases and reaches maximum at ψ = 26.57°.
Diffusion coefficient of hydrogen atoms in Σ5 [100] tilt grain boundaries with seven different inclinations. The dashed line is a least-square fit to the data points. The inset shows the activation energies as a function of inclination.

Diffusivities along tilt axis, perpendicular to tilt axis, and within grain boundary plane as a function of inclination angle.

To better understand the effect of inclination on hydrogen diffusion, we performed additional simulations to examine the variation of grain boundary structure and grain boundary energy as a function of inclination. The grain boundary energy E GB can be calculated from the following expression.

where E pot is the total potential energy of N Fe atoms within a 2-nm slab parallel to and centered upon the mean boundary plane, E coh is cohesive energy of Fe atom at 300 K, and A is the area of the cross section of the simulation cell parallel to the mean grain boundary plane. In close packed metals, there is usually an excess volume associated with the grain boundary. Here, we use grain boundary excess volume as a measure to characterize grain boundary structures. In particular, the specific grain boundary excess volume Δh is defined as

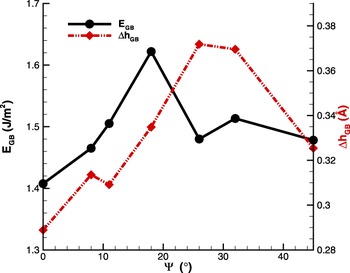
where V is the total Voronoi volume of N Fe atoms within a 2-nm slab parallel to and centered upon the mean boundary plane, V perfect is the Voronoi volume of individual iron atom in a perfect bcc crystal at 300 K, and A is the area of the cross section of the simulation cell parallel to the mean grain boundary plane. Note the grain boundary excess volume defined here is indeed a measure of grain boundary expansion along grain boundary normal direction. Figure 7 plots the variation of both grain boundary energy and specific grain boundary excess volume as a function of inclination. Both grain boundary energy and specific excess volume curves exhibit two local minima at ψ = 0° and 45°, which correspond to Σ5 [100]/(013) and Σ5 [100]/(012) STGBs, respectively. This suggests that both STGBs have relatively stable structure (low energy and close packing). Recall the activation energy for hydrogen diffusion shows two local maxima at these two symmetric boundaries. While hydrogen diffusion in iron is based on interstitial diffusion mechanism, the above correlation between activation energy for diffusion and grain boundary energy and specific excess volume suggests the existence of excess volume within grain boundary will help to promote hydrogen diffusion. Since symmetric grain boundaries are more closely packed and a more stable grain boundary structure, they will more effectively trap hydrogen atoms, and in turn, it requires more energy for hydrogen to overcome the diffusion barrier.
Grain boundary energy and specific grain boundary excess volume as a function of inclination angle.

C. Effect of hydrostatic pressure on diffusivity
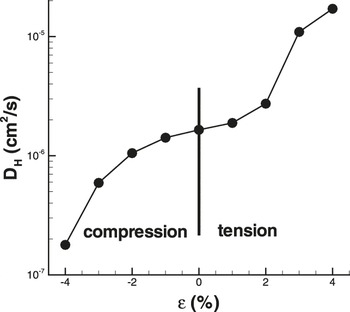
The correlation between activation energy for hydrogen diffusion in grain boundary and specific grain boundary excess volume implies that the free volume around Fe atoms can promote hydrogen diffusion among these trapping sites. Since hydrostatic pressure can either increase or decrease excess volume of individual Fe atoms, it is expected that such an excess volume due to stresses can also affect hydrogen diffusion in the bulk. To confirm this expectation, we performed a series of MD simulations of hydrogen diffusion in bulk under different hydrostatic pressures, where periodical boundary conditions are applied along three directions. Figure 8 shows the hydrogen diffusivity in bulk as a function of hydrostatic pressure at T = 300K. Evidently, hydrogen diffusivity increases as tensile strain increases and decreases as compressive strain increases. The difference in diffusivity due to the pressure change could be as large as two orders of magnitude, i.e., 1.7×10⁻⁷cm2/s with −4% strain versus 1.7×10⁻⁵cm2/s with 4% stain. The effect of hydrostatic pressure on bulk diffusivity confirms that interstitial excess volume is a key factor that can largely influence hydrogen diffusion in lattice. This result also helps us to better understand how the cyclic loading condition causes hydrogen segregation in materials. During tensile loading, the hydrogen diffusion in the bulk is fast, resulting in more hydrogen atoms diffuse and be trapped in material defects, while during compressive loading, the reduced hydrogen diffusion will prevent them escaping from defects sites. Effectively, cyclic loading will cause more hydrogen atoms trapped in materials defects. This is consistent with the results on the effects of hydrogen and loading procedure on crack growth.Reference Kang, Chen, Kania, Van Boven and Worthingham57
Diffusion coefficients of hydrogen atoms as a function of hydrostatic pressure in the bulk Fe.

IV. CONCLUSIONS
In summary, MD simulations were performed to investigate hydrogen diffusion in α-Fe using EAM potential. In particular, hydrogen diffusivities in bulk iron, (001) free surface, Σ5 STGBs, and a series of Σ5 asymmetric grain boundaries have been calculated. The simulation results have shown that hydrogen diffusivity is highest on free surface, while lowest in a symmetric grain boundary. Estimation of the activation energy for hydrogen diffusion as a function of grain boundary inclination shows that Σ5 [100]/(013) STGB has the highest activation energy. Examination of grain boundary energy and specific grain boundary excess volume as a function of inclination confirms that Σ5 [100]/(013) STGB has the lowest grain boundary energy and lowest specific grain boundary excess volume. This indeed suggests hydrogen diffusion within a grain boundary might be governed by grain boundary excess volume. Additional simulation of the effects of hydrostatic pressure on hydrogen diffusion in bulk supports the expectation that free volume in interstitial sites can assist hydrogen diffusion in iron. The result suggests cyclic loading condition can cause hydrogen atom accumulation during the compressive stress field, which would lead to the initialization and propagation of cracks in metals.
ACKNOWLEDGMENTS
Computational resources are provided by Westgrid (Canada). Authors gratefully acknowledge the financial support from TransCanada Pipeline Ltd, Spectra Energy, and the Natural Sciences and Engineering Research Council of Canada. Help from Dr. Chris H Rycroft on modification of Voro++ code is greatly appreciated.