


Introduction
Metamaterials [Reference Caloz and Itoh1] are basically artificially engineered electromagnetic media with some exclusive properties that do not occur in nature [Reference Caloz and Itoh1–Reference Veselago3]. In the last few years, metamaterials have been used in the field of research for several microwave devices such as antenna [Reference Mishra and Chaudhary4, Reference Mishra, Gupta and Chaudhary5], filter [Reference Fouad and Abdalla6], cloaking [Reference Bilotti, Tricarico and Vegni7], super-lens, [Reference Fang8] and absorber [Reference Bilotti, Nucci and Vegni9–Reference Ghosh, Bhattacharyya and Srivastava11]. In 2008, Landy et.al proposed first “Perfect Metamaterial Absorber” [Reference Landy12]. Since then, metamaterials play a crucial role for absorber applications related to microwave [Reference Dimitriadis, Kantartzis and Tsiboukis13], terahertz (THz) [Reference Grant14], infrared, [Reference Avitzour, Urzhumov and Shvets15] and optical frequency regime [Reference Meng16]. The various advantages of metamaterial absorber include compactness, ultra-thin thickness, near unity absorption and ease of fabrication. A metamaterial absorber basically composed of resonators, arranged periodically on the surface of the dielectric substrate. In order to completely restrict the transmission of electromagnetic waves, the back portion of the substrate is full metal laminated. Hence, to achieve near unity absorption, reflections from the surface of the absorber structure must be reduced. For this purpose, the input impedance of the absorber structure must be nearly equal to free space impedance of 377+j0 ohm. In the previous years, several absorber structures have been reported in single band [Reference Thummaluru, Mishra and Chaudhary17], dual band [Reference Zhai18, Reference Bagci and Medina19], triple band, [Reference Bian20–Reference Zhai22] and multiband [Reference Zheng23–Reference Huang and Chen26] applications. In [Reference Zheng23], the unit cell has four scaled version of flower-shaped structure, which is responsible for the origination of four bands. But due to this arrangement, the unit cell size of the absorber structure has been increased. Article [Reference Huang and Chen26] is dealt with a multilayer metamaterial structure to create multi-band polarization-insensitive response. Due to multilayer configuration, the thickness of the proposed absorber structure increases, hence become unsuitable for ultra-thin applications. In order to resolve the issue of large unit cell size and high thickness, the proposed absorber unit cell has been configured with two resonators.
In this paper, a compact metamaterial inspired ultra-thin polarization independent quad-band microwave absorber for electromagnetic interference (EMI)/ electromagnetic compatibility (EMC) applications have been presented. The proposed absorber offers four absorption peaks of 97.02, 94.07, 91.72, and 98.20% at 3.40, 8.23, 9.89, and 11.80 GHz, respectively. Further, the proposed absorber structure has been studied at different polarization angles and oblique incidence angles under both transverse electric (TE) and transverse magnetic (TM) polarization states. The absorption mechanism for the proposed structure has been explained through electric field distribution, current density, and input impedance plots. Since the electrical size of metamaterial (MTM) is very small, hence this can offer an advantage in the construction of several EMC/EMI components.
Design and simulation results
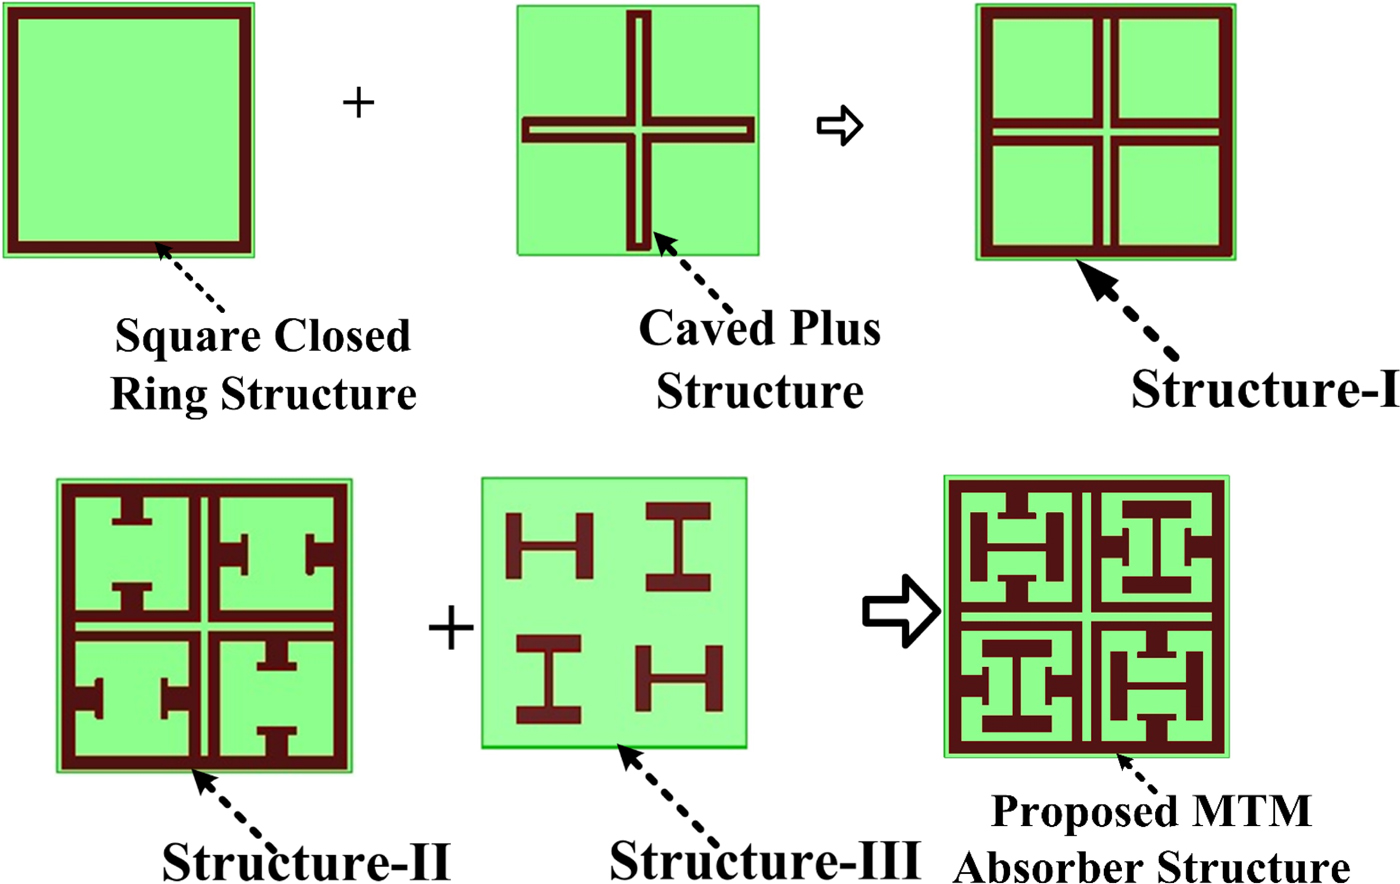
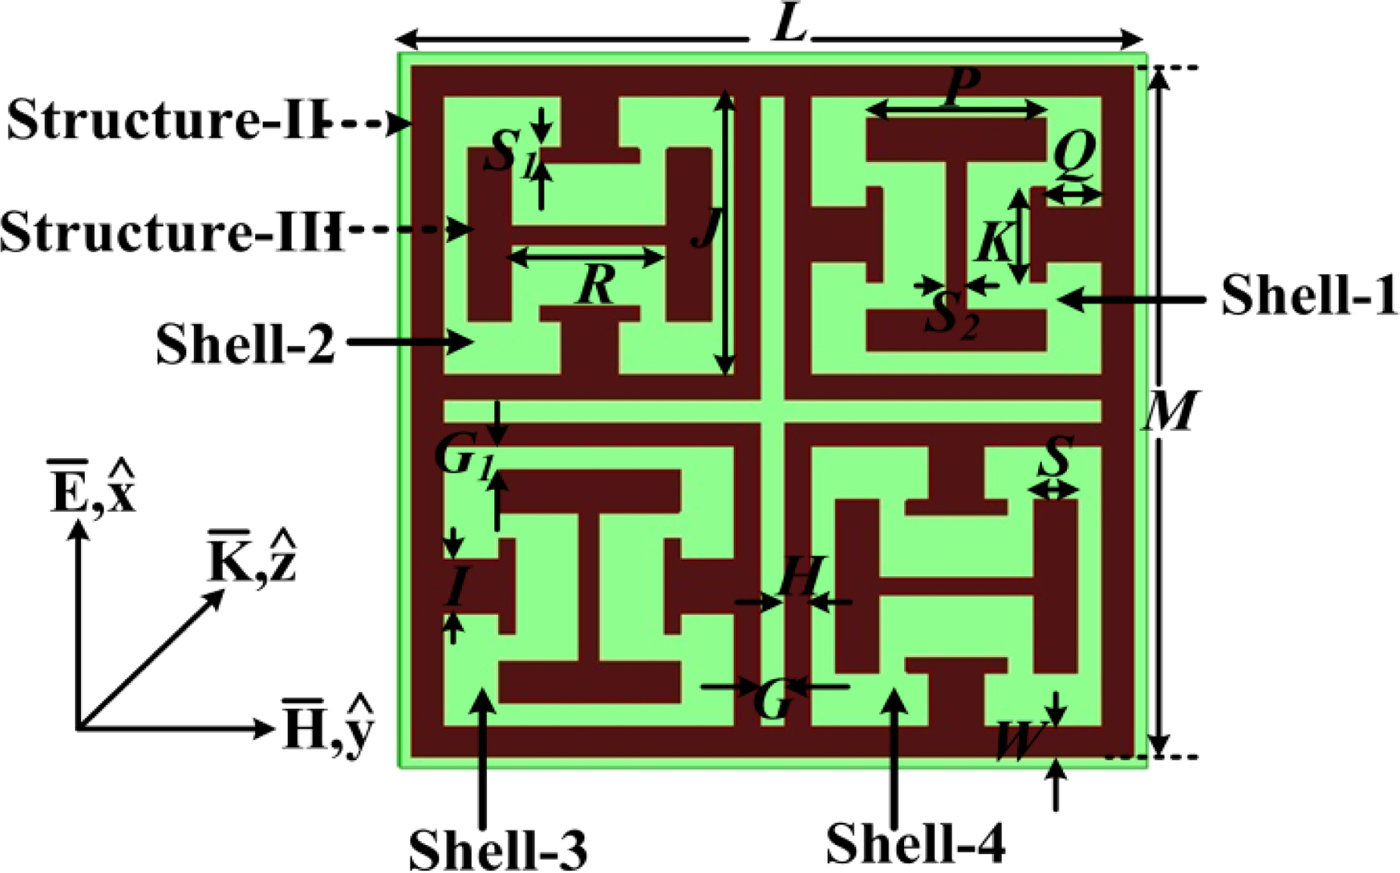
Figure 1 signifies the different developing stage of the designed MTM absorber structure while the geometrical configuration of the top view of the proposed absorber unit cell along with direction of wave propagation, electric and magnetic field vectors has been shown in Fig. 2. The top layer of the designed absorber structure is the combination of structure-II (structure-II is the modified version of structure-I) and structure-III, printed on two-sided copper coated 1 mm FR-4 epoxy dielectric substrate (ε r = 4.4, tanδ = 0.02). The bottom layer of the designed absorber is completely laminated with 0.035 mm thick copper sheet. The optimized geometrical dimension has been shown in Fig. 2.
Different developing stage of the proposed MTM absorber structure.
Top view of the designed metamaterial absorber unit cell with optimized geometrical dimensions (unit: mm): L = 12, M = 11.6, P = 2.9, R = 2.5, Q = 0.9, S = 0.7, S 1 = 0.25, S 2 = 0.3, I = 0.9, J = 4.7, K = 1.6, G = 0.4, G 1 = 0.4, H = 0.4, W = 0.5.
ANSYS HFSS 3-D simulation software with master and slave periodic boundary condition and floquet port excitation has been used to analyze the absorptivity of the designed absorber unit cell. The mathematical expression for calculating the absorption coefficient of the designed absorber structure has been represented by Equation (1) as,
 $$A = 1 - \vert S_{11} \vert ^2 - \vert S_{21} \vert ^2.$$
Since the full copper laminated bottom layer of the designed absorber prohibits the transmission of incident electromagnetic waves, the transmission coefficient is zero and Equation (1) is reduced to Equation (2) as,
 $$A = 1 - \vert S_{11} \vert ^2,$$
where |S 11|2 represents reflected power and |S 21|2 represents transmitted power. In order to achieve near unity absorption, reflected power |S 11|2 should be reduced to zero, as revealed from Equation (2).
The absorption curve for different developing stages of the structure-I has been discussed in Fig. 3.The absorption curve for square closed ring exhibits absorption peak of 99.07% at 3.02 GHz, while caved-plus shaped structure offers two absorption bands with peak absorption value of 92.10% at 4.72 GHz and 96.73% at 10.49 GHz. The combination of above two structures (structure-I), results in two absorption bands with peak absorptivity of 94.95 and 99.67% at 3.54 and 8.90 GHz, respectively. Further, structure-II which is the modification in structure-I, shown in Fig. 4, is responsible for the origin of a new absorption peak at 11.58 GHz with peak absorption value of 84.41%. On the other hand, the absorption curve for Structure-III (combination of four 90° rotated H-shaped structures) exhibits one absorption peak of 94.37% at 10.43 GHz.
Simulated absorption curves for different stages of structure-I.

Simulated absorption curves for structure-II and structure-III.

When structure-III is embedded inside structure-II, the designed unit cell corresponds four distinct absorption bands with peak absorption value of 97.02, 94.07, 91.72, and 98.20% at 3.40, 8.23, 9.89, and 11.80 GHz respectively, as shown in Fig. 5. The FWHM (full width at half maximum) Bandwidths of designed quad-band absorber are 160 MHz (3.32–3.48 GHz), 280 MHz (8.09–8.37 GHz), 300 MHz (9.74–10.04 GHz), and 520 MHz (11.54–12.06 GHz).
Simulated absorption curve for the designed absorber unit-cell.

In order to confirm the polarization independent behavior, designed unit cell has been studied at distinct angles of polarization (0° to 90° in step of 15°), shown in Fig. 6. It has been observed that the value of all four absorption peaks remains the same with the increase of polarization angles. Hence, the absorber is polarization independent.
Simulated absorption curve for the designed absorber structure at distinct angles of polarization. (a) TE polarization, (b) TM polarization.

The designed structure has been also investigated under distinct angles of oblique incidence (0° to 90° in step of 15°) for TE and TM polarization, shown in Figs. 7(a) and 7(b), respectively. For both the polarization state, a high absorption (greater than 80%) has been achieved up to 30° of incidence angle. The increment in incidence angle corresponds to a decrement in absorption peak and this is due to a reduction in incident magnetic flux between the top and bottom surfaces of the designed absorber structure. The variation in incidence angle is responsible for the origin of two more small absorption peaks at 8.23 and 9.89 GHz.
Simulated absorption curve for the designed absorber structure at distinct incident angles.

The metamaterial nature of designed absorber unit cell has been illustrated through dispersion diagram plot which is calculated by Equation (3) [Reference Mehdipour, Denidni and Sebak27] and shown in Fig. 8. Dispersion diagram plot contains left-handed (LH) and right-handed (RH) region. In case of LH region (β < 0), the direction of phase and group velocity are aligned opposite to each other, constituting a backward wave but for RH region (β > 0), phase and group velocity are aligned in the same direction, resulting in a forward wave. It has been observed that the entire FWHM bandwidth of first, second and fourth absorption band lies in LH region while a part of third absorption band lies in LH region, which confirms metamaterial nature of designed absorber structure.
 $$\beta d = \cos ^{ - 1}\left( {\displaystyle{{1 - S_{11}S_{22} + S_{12}S_{21}} \over {2S_{21}}}} \right).$$
Dispersion diagram plot for the designed absorber structure. (a) At 3.40 GHz, (b) at 8.23 GHz, (c) at 9.89 GHz, (d) at 11.80 GHz.

The electric field distribution and current density plots have been discussed to analyze absorption behavior of the designed absorber structure. Figure 9 shows electric field distribution plot for the designed absorber structure at all the absorption frequencies. It is observed that outer square closed ring is responsible for the origination of lower absorption peak at 3.40 GHz while absorption peak at 8.23 GHz is achieved mainly due to caved-plus patch. At 9.89 GHz, the absorption peak is produced due to the effect of thin rectangular copper strip attached to small square patch in shell 1 and shell 3 and caved-plus patch. Structure-II is responsible for the occurrence of the absorption peak at 11.80 GHz and the coupling between structure-II and structure-III improves the absorption at 11.80 GHz. Hence, an electric excitation has been developed in the top metallic patch at all the absorption frequencies.
Electric field distribution plot for the designed absorber structure at all the absorption frequencies. (a) At 3.40 GHz, (b) at 8.23 GHz, (c) at 9.89 GHz, (d) at 11.80 GHz.

Current density plot at all the absorption frequencies on top and bottom surfaces of designed absorber unit cell has been shown in Fig. 10. At 3.40 GHz, the current density is mainly localized in a caved-plus patch along with outer square closed ring resonator while most of the current is mainly distributed on the edges of the caved-plus patch at 8.23 GHz. A high density of surface current at 9.89 GHz flows on the H-shaped patch placed inside shell-2 and shell-4 of structure-II, whereas at 11.80 GHz, the current density is concentrated on outer square closed ring resonator along with H-shaped structure embedded inside shell-2 and shell-4 of structure-II. It is also seen that the direction of flow of surface current at all frequencies on top and bottom surface are anti-parallel to each other, thus creates a circulating current loop, responsible for magnetic excitation. This electric and magnetic excitation is responsible for strong absorption of EM wave.
Current density plot on top and bottom surfaces for the designed absorber structure at all the absorption frequencies.

In addition to this, input impedance plot has been also studied to explain the absorption behavior of designed absorber structure. It has been observed from Fig. 11 that the value of input impedance at 11.80 GHz (426.3 ± 0.955j) is closely matched to free space impedance (377 + 0j), hence a high absorption of 98.20% has been achieved. Further, input impedance at 3.40 GHz (522.9 + 40.53j) is far away from free space impedance value, so absorption peak of 97.02% has occurred. However, at 8.23 and 9.89 GHz, the value of input impedance is (235 + 31.41j) and (209.8 + 17.85j, respectively. The value of input impedance is calculated using Equation (4) [Reference Smith28],
 $$Z(\omega ) = \eta _0\sqrt {\displaystyle{{{(1 + S_{11})}^2 - S_{21}^2} \over {{(1 - S_{11})}^2 - S_{21}^2}}} = \eta _0\displaystyle{{1 + S_{11}} \over {1 - S_{11}}},$$
where Z (ω),η 0, represents input impedance, free space impedance, respectively.
Input impedance plot for the designed absorber structure.

Experimental results
In order to perform the experimental measurement, the proto-type of designed absorber structure has been fabricated in a planar sheet of two-sided copper coated FR-4 epoxy dielectric substrate having dimensions of 12 mm × 12 mm × 1 mm. The fabricated proto-type along with a zoomed view of designed absorber has been shown in Fig. 12. A pair of horn antenna connected with Agilent N5221A PNA vectored network analyzer has been required to perform experimental measurement of fabricated proto-type. One horn antenna is used for transmission of EM wave while the other horn antenna is used for reception purpose. The entire experimental measurement has been done in free space.
Photograph of fabricated prototype along with its zoomed view.

Initially, the input reflection coefficient for the copper sheet (as a reference) has been measured. After that, the input reflection coefficient for the fabricated proto-type has been determined. The subtraction of the input reflection coefficient of the designed absorber proto-type with that of a reference copper sheet provides the actual value of the input reflection coefficients. Further, the absorptivity has been calculated from this actual value of the input reflection coefficient. Simulated input reflection coefficient plot along with the measured actual input reflection plot has been depicted in Fig. 13(a). Experimentally obtained peak absorption values for the designed absorber proto-type, shown in Fig. 13(b), are 97% at 3.39 GHz, 93.98% at 8.21 GHz, 91.21% at 9.87 GHz, and 98.17% at 11.79 GHz. Further, the designed absorber proto-type offers experimental FWHM bandwidth of 240, 330, 340, and 460 MHz with respect to absorption peaks of 3.39, 8.21, 9.87, and 11.79 GHz. It has been seen that the simulated and measured absorption results are perfectly matched with each other. A slight deviation in absorption bandwidth, absorption peak, and presence of noise out of the absorption band may be occurred due to the free space measurement.
(a) Measured and Simulated input reflection coefficient plot. (b) Measured and simulated absorption curves.

Table 1 shows the comparison of the performance of the proposed quad-band ultrathin absorber with the previously published articles.
Comparison of this work with previously published articles

Conclusion
In this paper, a compact metamaterial inspired ultra-thin polarization independent quad-band microwave absorber for EMI/EMC applications has been presented. Both the structures, structure-II, and structure-III, are responsible for the occurrence of four absorption peaks at the desired frequency. Metamaterial nature of the designed unit cell has been discussed through dispersion diagram plot. The proposed absorber exhibits compactness of 0.136 λ 0 × 0.136 λ 0 and ultra-thin thickness of 0.0113 λ 0 at lower absorption frequency of 3.40 GHz. Electric field distribution, current density, and input impedance plot have been studied to explain the absorption behavior of the designed metamaterial absorber. Due to the compact size, polarization independent characteristics, ultra-thin thickness, and quad-band metamaterial absorption, the proposed absorber structure can be used for several EMI/EMC applications.
Acknowledgement
This research work is supported by Science and Engineering Research Board (SERB), Department of Science & Technology (DST), Government of India, India under Project No. EMR/2016/002559.
 Naveen Mishra was born in Deoria (Uttar Pradesh), India on October 04, 1990. He received the B. Tech. degree in electronics and communication engineering from Uttar Pradesh Technical University, Lucknow in 2010. Currently, he is pursuing Ph.D. from Department of Electronics Engineering, Indian Institute of Technology (Indian School of Mines), Dhanbad, India. He joined the Department of Electronics Engineering, Indian Institute of Technology (Indian School of Mines), Dhanbad, in January 2014, as a Junior Research Fellow, where he has been a Senior Research Fellow since January 2016. He has authored or co-authored more than 24 research articles in international/national journals/ conference proceedings. His current research interests involve Metamaterials structures and its applications.
 Khusboo Kumari was born in Koderma (Jharkhand), India on February 13, 1992. Currently, she is pursuing M. Tech. from Department of Electronics Engineering, Indian Institute of Technology (Indian School of Mines), Dhanbad. She did her B. Tech. from Vinoba Bhave University, Hazaribag in 2013. Her current research topic is Design and Development of Ultra-thin Metamaterial Absorber.
 Dr. Raghvendra Kumar Chaudhary is working as an Assistant Professor at Department of Electronics Engineering, Indian Institute of Technology (Indian School of Mines), Dhanbad, India. He did his Ph.D. from Indian Institute of Technology Kanpur, India in January 2014, the M.Tech. degree from Indian Institute of Technology (BHU), Varanasi, India, in 2009, and the B.Tech. degree from University Institute of Engineering and Technology, Kanpur India, in 2007. Dr. Chaudhary has authored more than 125 referred Journal and Conference papers. He was the recipient of the International Travel Grant form CSIR, DST, and IIT Kanpur, India. He was the recipient of the Best Student Paper Bronze Award at IEEE APACE, Malaysia in 2010 and also the recipient of the Best Paper Award at ATMS, India in 2012. He is a member of IEEE and potential reviewer of many journals and conferences such as IEEE Transactions on Antennas & Propagation, IEEE AWPL, IET MAP, IET Electronics Letters etc. His current research interests involve Metamaterials, Dielectric Resonators, and Computational Electromagnetics. He is presently handling many research projects in the capacity of Principal Investigator sponsored by Indian funding agencies like SERB(DST), ISRO etc.



