The Cuban Republic was born in 1902. It ended in 1959 when Fidel Castro took power, signaling the triumph of the revolution. The intervening years were marked by recurring political turmoil and a troubled relationship with the United States (U.S.). In contrast to the intense interest in all aspects of revolutionary Cuba, we have few macroeconomic time series for the republic.Footnote 1 We lack national accounts for most of the period. We lack wage indices. There are no price indices before the 1950s. There are no purchasing power parity adjusted income comparisons. Overall, we have less macroeconomic information on Republican Cuba than any other important Latin American economy.
As a result, Cuba is absent from most comparative studies. Yet the Cuban experience can shed light on important historical issues. Over the last century and a half, Cuba moved from a colony of Spain to a protectorate of the United States, an independent republic, and finally a communist state. Stanley Engerman and Kenneth Sokoloff suggest that initial factor endowments led to the development of institutions that inhibited growth in Latin America.Footnote 2 While Cuba provides a sharp test for their approach, it does not appear in the literature in this area. Along similar lines, Christopher Blattman, Jason Hwang, and Jeffrey Williamson argue that terms of trade volatility reduces growth, but they do not consider Cuba.Footnote 3 Finally, Cuba experienced a remarkable financial collapse and recovery during the early 1920s but it does not appear in Carmen Reinhart and Kenneth Rogoff's seminal study.Footnote 4
This article takes some first steps towards filling in the macroeconomic record of the republic. We provide international comparisons of Cuban living standards for the 1950s. In addition, we construct a Cuban GDP index from 1928 to 1958 with a cruder index going back to 1902. This appears to be the first GDP index for the Cuban Republic. Overall, our work provides a glimpse of the Cuban economy from the foundation of the republic to its demise.
Our first contribution is a 1953 benchmark estimate of purchasing power parity (PPP) adjusted Cuban GDP. We compare Cuban income, labor productivity, and consumption to the United States and 27 countries in Europe and Latin America. The results show Cuba as a middle-income economy. On the eve of the revolution, Cuban income per capita is 50 to 60 percent of European levels and close to the highest in Latin America.
We also make some controlled conjectures about comparative living standards for earlier decades. To extrapolate the 1953 Cuban benchmark back to 1928, we form a new GDP index by combining the industrial production index of Jorge Pérez-López with new indices for agriculture, construction, transportation, wholesale and retail trade, and services.Footnote 5 We also provide cruder GDP estimates back to 1902. The GDP index shows growth ceasing in the early 1920s, followed by a collapse in income during the Great Depression and a slow recovery thereafter. Income per capita for the late 1950s may have just regained its 1920s levels.
New international comparisons for the early years of the republic suggest that the sugar boom of the early twentieth century produced Cuban per capita incomes that were roughly 80 percent of European levels in the 1920s. Consistent with contemporary views during the sugar boom of the 1920s, the estimates suggest that Cuban per capita incomes were similar to levels in some Southern U.S. states.
Finally, our article provides an answer to a long-running Cuban controversy, the road not taken. Did the revolution increase living standards relative to what would have occurred had the revolution not taken place? There are no good estimates of current Cuban living standards so our conclusions on this point are tentative. Our preliminary estimates suggest that consumption for recent years is below its pre-revolutionary peak. Despite possible accomplishments elsewhere, the revolution may have permanently lowered consumption.
COMPARATIVE CUBAN LIVING STANDARDS ON THE EVE OF THE REVOLUTION
This section presents comparisons of incomes in Cuba and the United States after adjusting for purchasing power parity (PPP) for 1953.Footnote 6 There have been no true PPP-adjusted income comparisons for Cuba. Angus Maddison assumes that Cuban income per capita for 1990 is 15 percent below the average for Latin America.Footnote 7 The Penn World Tables include Cuba after 1969 but it bases estimates on a shortcut regression procedure rather than a full-fledged GDP comparison.Footnote 8
To compare the GDPs, we obtain relative nominal income per capita expressed in a common currency for a benchmark year, and then calculate real PPP-adjusted income by deflating nominal income with a new estimate of the relative price levels in Cuba and the United States. There are two sources of nominal GDP for the republic. Republican Cuba began publishing estimates of national income in the late 1940s with data going back to 1937. We also have an estimate of Cuban GDP for 1953 from Harry Oshima, a leading scholar of national income accounting.Footnote 9 There are large differences between Oshima's series and the official series. The official series shows 1953 GDP per capita at $348. Oshima calculates it to be $468, exceeding the official estimates by 35 percent.Footnote 10
We chose Oshima for three reasons. First, he provides independent estimates of GDP from the income and expenditure sides. He also carefully cross-checked his results using survey data. Second, most observers within Cuba accepted the Oshima estimates as being superior to the official numbers. The most notable example is Felipe Pazos, Director of the National Bank of Cuba and an able economist.Footnote 11 Third, we conducted two independent checks on the Oshima estimates of consumption using data that were not available to Oshima. We obtained similar results to Oshima in each case. Details of the calculations are in the online Data Appendix.
Having settled on the Oshima estimates for 1953, we compare Cuban-U.S. price levels using the approach followed by Milton Gilbert and Irving Kravis in making international comparisons.Footnote 12 We draw heavily on two aspect of their methodology. First, Gilbert and Kravis use a bilateral Fisher Ideal price index to compare price levels. We do not have enough information to compute multilateral price indices such as the Geary-Khamis measure used by Maddison and the Penn World Tables.Footnote 13 Previous historical income comparisons also use the Fisher Ideal method.Footnote 14
The second aspect of the Gilbert and Kravis methodology is their use of both price and quantity comparisons. This is often forgotten as the later work of the International Comparison Project (ICP) moved away from quantity comparisons except for service sectors that are difficult to compare, such as education and healthcare. We use quantity comparisons to provide a cross-check on our price comparisons. Moreover, only quantity comparisons are possible for some sectors, most notably housing, education, and health.Footnote 15 Previous work on historical income comparisons has not used quantity comparisons.
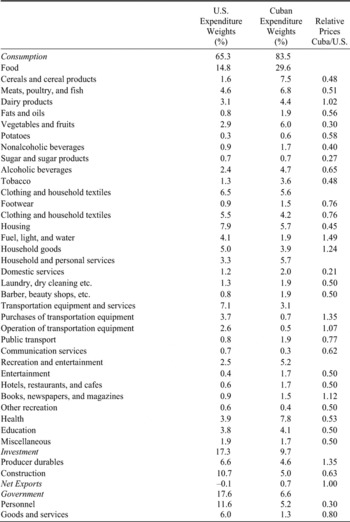
Table 1 provides the expenditure shares and the disaggregated Cuban-U.S. relative prices used to calculate the overall Cuban-U.S. price level. Sources are in the online Data Appendix.
We calculate Cuban expenditure from Oshima's data. The U.S. data are from the U.S. national income accounts. The final column provides relative price level estimates drawn from comparative price data from the International Labor Organization (ILO) for basic consumption items. We use additional data from alternative sources when the ILO comparisons are missing or are greatly different from other information that appears more accurate. Complete details are provided in the online Data Appendix.
EXPENDITURE SHARES AND RELATIVE PRICES

Sources:
Expenditure shares are from BEA, http://www.bea.gov/national/index.htm; and Gilbert and Kravis, International Comparison for the U.S. Oshima, “New Estimate,” provides expenditure shares for Cuba. Price data is mainly from ILO, Yearbook. Further details are in the online Data Appendix.
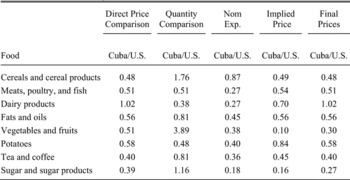
QUANTITY COMPARISON FOR FOOD

Notes:
See the text.
Sources:
See the text.
As discussed, we also follow Gilbert and Kravis in supplementing the price comparisons with quantity comparisons.Footnote 16 We provide independent quantity comparisons for most items of consumption. In most cases, the price comparisons derived from the quantity comparisons are similar to the direct price comparisons in the ILO data. When the comparisons are dissimilar, we average the two price ratios or we use additional information to determine which price ratio to choose. For some important cases, most notably housing, we only have quantity comparisons and thus rely on the price comparisons derived from the quantity information.
The following example illustrates the procedure. Table 2 shows our quantity comparison for food. We have data on expenditures for the United States and Cuba, and food balance sheets provide the quantities consumed in each country. Oshima provides a 1953 food balance sheet for Cuba while the U.S. quantities are from the U.S. Historical Statistics.Footnote 17
The second column is the relative Cuban/U.S. price comparison using the sources outlined earlier. The third column gives the Cuba/U.S. quantities from the food balance sheets. Column four gives the relative expenditures on each food category. Column five gives the implied prices obtained by dividing column four by column three. There is a reasonable correspondence between the direct and the implied food prices for most items. On the other hand, the quantity comparisons imply Cuba/U.S. prices for vegetables and fruits as well as sugar that are lower than the direct price comparisons. For the benchmark price, we take the average of the direct and indirect price level comparisons as our price for vegetables and fruit, and for sugar. For dairy products, however, the quantity comparison implies a Cuban price that is implausible since Cuba imported milk. Here we use the direct price comparison. The final column corresponds to the Cuba/U.S. food prices in Table 1.

We measure Cuban price levels and expenditure shares imperfectly. Even though Oshima's expenditure shares data are better than the official Cuban series, they are not as detailed or complete as the information on U.S. expenditures.Footnote 18 Similarly, price data is certainly not comparable in quality to the modern price level comparisons from the International Comparison Program (the ICP). For example, consumption comparisons for OECD economies in the 2005 round of the ICP compare prices for 2,600 different products and services. For developing economies, the ICP compares prices for between 600 and 1,000 goods and services.Footnote 19 Our comparisons are based on prices for a much smaller number of goods.Footnote 20 In addition, we have to rely on some price data not collected for purposes of international comparisons.
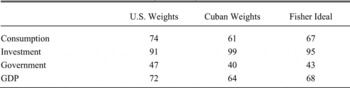
In general, we adopt procedures that will tend to overstate the Cuban price level. If there is a bias in our procedures, it will work to overstate Cuban prices and thus understate Cuban income. Table 3 provides the price indices for consumption, government spending, and investment derived from Table 1 using U.S., Cuban, and the Fisher Ideal results based on the geometric average of the Cuban and U.S. weights.
The Fisher Ideal results show that the Cuban price level for overall GDP was roughly two-thirds of the U.S. price level. The price level for investment goods was 95 percent of the U.S. price level primarily due to the relatively high machinery prices in Cuba driven by transport costs, taxes, and tariffs. The price level for government services in Cuba was only 43 percent of the U.S. level because of low Cuban wages and the labor intensity of government service.Footnote 21 These patterns, where the relative price of investment is higher than consumption and government spending in the lower income economy, occur in nearly all international comparisons.
Using the price benchmark, we can compare income and consumption across the U.S. and Cuba. In 1953 Cuban income per capita is 27 percent of U.S. levels. Output per worker was 33 percent due to a smaller share of the Cuban population in the labor force. Consumption per capita was 35 percent of U.S. levels due to the higher share of consumption in Cuban GDP. We will delay discussion of these results until we relate Cuba to the wider world.
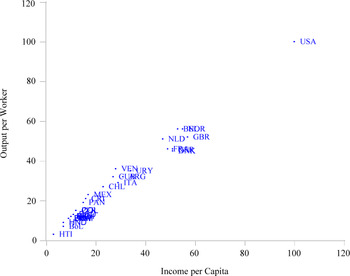
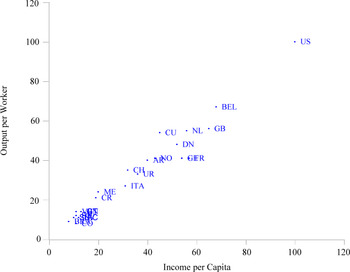
How did income for late Republican Cuba rank relative to other economies? Since we use Fisher Ideal measures based on prices in the 1950s, we cannot compare our results for Cuba relative to the United States to comparisons of other countries to the United States from the Penn World Tables (the PWT) or Maddison because they are Geary-Khamis income measures based on prices from recent years.Footnote 22 To relate our Cuba benchmark to other economies in the 1950s, we must rely on Fisher Ideal comparisons for years close to the 1953 Cuba/U.S. benchmark. Therefore, we collected data for the United States and 27 economies in Europe and Latin America. Our European data cover Belgium, Demark, France, Germany, Italy, Netherlands, Norway, and the United Kingdom in 1955 and come from Milton Gilbert and Associates.Footnote 23 For Latin America we use Stanley N. Braithwaite's data covering most of the countries in the Western Hemisphere in 1960 prices.Footnote 24 We extrapolate the 1953 comparison of Cuba and the United States to 1955 using GDP growth rates from the GDP index discussed in the next section. The 1955 estimates for each country are in the Appendix of this article.Footnote 25Figure 1 summarizes the most important features of the comparison.
CUBA IN COMPARATIVE PERSPECTIVE FOR 1955 (U.S. = 100)

The horizontal axis gives income per capita for 1955 measured relative to the United States while the vertical axis gives output per worker also measured relative to the United States. The United States has a commanding lead on both measures. The other economies fall into three groups. First, there are the economies of Western Europe, excluding Italy, where income averages 50 to 55 percent of the U.S. income. Output per worker is at similar levels. The next group consists of Italy, Argentina, Uruguay, Cuba, and Venezuela with income per capita at about 30 percent of U.S. levels. Output per worker was higher for these economies at 30 to 35 percent of the U.S. level, reflecting a larger share of the U.S. population in the labor force. The final group contains the remaining economies in Latin America with income and output per worker at small fractions of U.S. levels.
CUBAN CONSUMPTION IN COMPARATIVE PERSPECTIVE FOR 1955 (U.S. = 100)

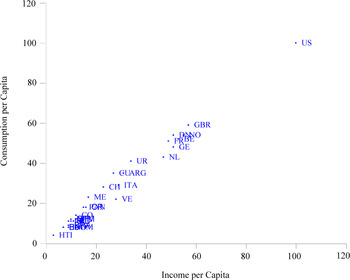
Cuba's income per capita was 50 to 60 percent of Western European levels and was about the same as Italy's income. Cuban labor productivity was higher than in Italy at 55 to 65 percent of the Western European economies. Cuban consumption was relatively high as a share of GDP, and Figure 2 shows that Cuban consumption was roughly 70 percent of the consumption levels in most European economies, while exceeding Italy's consumption by a considerable margin.
In sum, the comparative income data suggest that Republican Cuba was a middle-income country, comparable to Argentina and Uruguay in Latin America and Italy in Europe. We suspect that these conclusions would not surprise contemporary observers from the 1950s, when many believed that Cuba was a middle-income economy. In the early 1940s Henry Wallich wrote, “Although exact data are lacking, it seems safe to say that among all tropical countries, Cuba has the highest per capita national income.”Footnote 26
Similarly, the World Bank in 1951 reported:
The general impression of the members of the mission, from observations and travels all over Cuba, is that living levels of the farmers, agricultural laborers, industrial workers, storekeepers, and others are higher all along the line than for corresponding groups in other tropical countries and in nearly all other Latin American countries.
Contemporary observers were also impressed by Cuban consumption levels and by their similarities to the United States. For example, the U.S. Department of Commerce noted:
No observer with experience in Latin America can fail to be impressed by the variety, quantity, and quality of the merchandise displayed in the provincial towns and cities of the island. While such items as mechanical refrigerators, gas ranges, and television sets are prominently displayed, the strongest impressions are those formed by inspection of the stores carrying housewares, apparel, and foodstuffs.Footnote 27
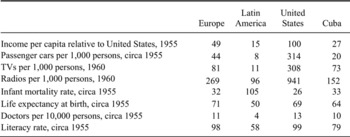
Before considering other evidence, we should mention one important caveat. Cuba's relatively high standing in Figure 1 should not be allowed to obscure the large income differences within Cuba, particularly between urban and rural areas. Like other Latin economies, Republican Cuba had a sharply unequal distribution of income. How unequal, we do not know. From the available information in Claes Brundenius and others, we would hazard the guess that poverty was more prevalent in rural Cuba as compared to rural areas of the Southern Cone.Footnote 28 The Cuban case also differs from the Southern Cone because Cuban poverty partly reflected racial disparities between incomes for whites and Cuba's large Afro-Cuban population. Cuba scored well in the 1950s on other economic and social measures in Table 4.Footnote 29
INCOME PER CAPITA AND SOCIOECONOMIC INDICATORS

Sources:
Income per capita is from the Appendix. Other variables for Europe and the United States: United Nations Statistical Yearbook, various issues; Latin America: OXLAD Database at http://oxlad.qeh.ox.ac.uk/search.php; and Cuba: Infant mortality and Life expectancy from Sixto, “Evaluation.” Finally, TV and Radios for 1960 are from World Bank, World Tables, 3rd Edition, vol. II, Social Data.
On most measures, especially televisions, Cuba ranks at the highest or close to the highest in Latin America.Footnote 30 Cuba also ranked high on health indicators. In 1955 Cuba's infant mortality rate was the lowest in Latin America and was similar to rates in developed economies.Footnote 31
There is a long tradition of using socioeconomic indicators to provide shortcut estimates of comparative PPP-adjusted income.Footnote 32 The chief issue in the literature is how to combine the results from different indictors. Clearly, we will get different results using infant mortality, where Cuba scores highly, as compared to other variables where it does less well. Luis Locay provides an elegant application of the socioeconomic indicator approach to Cuba of the 1950s.Footnote 33 Using data for a large number of indictors covering the countries in our sample supplemented with data from U.S. states, he finds the value of relative income that “best fits” the Cuban data as a whole. His GDP per capita estimates range from 5 percent above our estimate to 7 percent below them.Footnote 34
LOOKING BACK FROM THE 1950S
For earlier years, we would like to directly compare incomes in Cuba to incomes in the United States and other economies. Due to incomplete data, this is not possible. Following the approach of Maddison and others, we extrapolate our income benchmarks backwards in time using GDP growth rates to determine the relative income per capita for earlier years.Footnote 35 Our reliance on projections leaves us open to the charge that we neglect changes in relative prices and economic structure within Cuba during the early twentieth century. As we shall see, an equally pressing concern is the quality of the series for Cuban GDP.
There are three problems with the national accounts for Republican Cuba. As discussed earlier, the official GDP series understate nominal income. Second, the official series are in nominal terms because there are no GDP deflators. To obtain real GDP, prior researchers have deflated Cuban GDP by a crude CPI series based on food prices.Footnote 36 The final problem is that there are no national income accounts before 1937, when the Central Bank series began.Footnote 37 For the earlier years, scholars rely on a shortcut GDP series devised in 1950 by the director of research at the Cuban Central Bank, Julián Alienes Urosa. Alienes constructed nominal GDP using the nominal series for imports, government revenue, and bank deposits.Footnote 38 He deflated his GDP series by the U.S. wholesale price index (WPI), given that there were no Cuban price indices.Footnote 39
Alienes was an important contribution for its time. By today's standards, however, his shortcut GDP estimates are problematic. There is little reason to expect that the relationship between nominal GDP on the one hand and imports, government revenue, and bank deposits on the other had been stable over time. Along similar lines, the U.S. wholesale price index is unlikely to provide a good approximation to a Cuban GDP deflator. Cuba and the United States have vastly different distributions of wholesale purchases and it is by no means clear that the U.S. WPI and the Cuban GDP deflator should even move together over the long run given what appear to be divergent trends in economic growth. The chief problem with the Alienes series, however, is that it is implausible. For instance, it suggests that GDP per capita for 1905 is 20 percent higher than the 1953 level. It also yields huge year-to-year movements in GDP that are hard to accept.Footnote 40
Given the uncertainty about Cuban GDP, we decided to construct a new index based on procedures in the economic history literature, most notably Arthur Lewis's output measure of U.K. GDP from 1852 to 1913.Footnote 41 The new index, which covers the years 1928 to 1958, is a weighted quantity index where the weights are the base year shares in valued added.
We are fortunate that we can build on the carefully constructed industrial production index of Pérez-López.Footnote 42 The Pérez-López index covers manufacturing, mining, and public utilities. We add new indices for agriculture, construction, transportation, wholesale and retail trade, and services to obtain overall GDP.
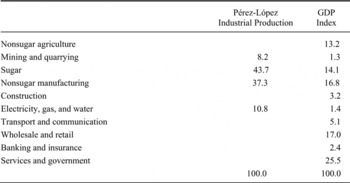
Table 5 compares the coverage of the Pérez-López industrial production index with our new GDP index.Footnote 43
The weights in the output index are valued added shares in GDP calculated from data in Oshima's research.Footnote 44 We therefore value output at Cuban prices of 1953. The key difference between the GDP index and the industrial production index is the reduced importance of sugar. Sugar includes value added in growing and processing sugar. It dominates the industrial production index with a weight of 0.44. In contrast, the overall sugar weight in value added for 1953 is 0.14.Footnote 45 We construct the overall GDP index using sectoral indices based on output data for each sector. As mentioned, we include sectoral indices for agriculture, mining, sugar manufacturing, nonsugar manufacturing, construction, electricity, transportation and communication, wholesale and retail trade, banking and insurance, and other services, including government services. Nonsugar manufacturing, mining, electricity and gas, and construction are from Perez-Lopez with additional information for the years before 1930. We form the agricultural index using gross agricultural output for items covering over 80 percent of agricultural output. We use sugar output for sugar manufacturing, while transportation includes freight and passenger traffic. We estimate wholesale and retail trade using the volume of goods moving through these channels and we use the real value of deposits in the banking system for banking and insurance. We estimate output in service sectors and the government using employment. Additional details along with the indices for each industry are in the online Data Appendix.
COMPARING WEIGHTS FOR INDUSTRIAL PRODUCTION AND GDP

Sources:
Adapted from Pérez-López, “Cuban Industrial Output”; and Oshima, “New Estimate.”
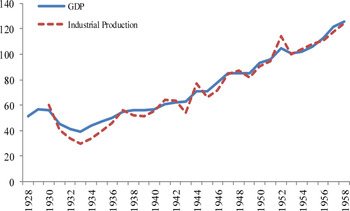
We see the index as providing a rough measure of trends in overall GDP. It is not suitable for the study of cyclical fluctuations.Footnote 46Figure 3 compares the industrial production index of Pérez-López with the GDP index.
The overall trends for industrial production and GDP are similar. The GDP series is less volatile because of the smaller share of the exceptionally volatile sugar sector in GDP and the lower volatility of services as compared to the components of industrial production.
INDUSTRIAL PRODUCTION AND OVERALL OUTPUT (1953 = 100)

The output index stops at 1928 because earlier data are scarce for nonsugar manufacturing, public utilities, financial services, and construction. We have indices for agriculture, sugar manufacturing, wholesale/retail trade, transportation, and services that go back to 1902. These sectors accounted for 77 percent of GDP for the base year of 1953. Using these indices, we calculated a reduced coverage GDP index from 1902 to 1928. The reduced coverage index tracks the GDP index almost perfectly after 1928, which led us to use the reduced coverage index to extrapolate the output index back to 1902 and the birth of the republic.Footnote 47
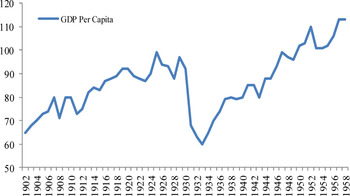
The resulting series for income per capita shown in Figure 4 suggests solid, albeit volatile, growth over the first two decades of the republic. This finding is consistent with standard accounts such as the descriptions by Hugh Thomas.Footnote 48 From 1902 to 1920 growth in GDP per capita in Figure 4 averaged 2 to 3 percent per year. After 1925 growth ceased, and income collapsed during the Great Depression. By 1933 income per capita was 60 percent of its 1925 level. A slow recovery followed, and income reached its 1928 levels only by the end of the Second World War. In the waning years of the republic, there was some growth and living standards that finally exceeded the levels of the 1920s.Footnote 49
INCOME PER CAPITA, 1902–1958 (1953 = 100)

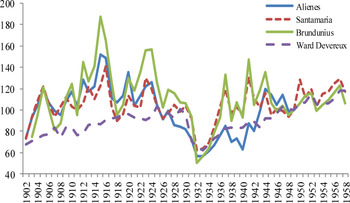
How do our estimates compare to other long-run GDP series for Cuba? As noted earlier, there is no true GDP index over the life of the republic and scholars have relied on the Alienes proxy series for nominal GDP.Footnote 50 Over the years, scholars have amended the Alienes series. Brundenius takes the Alienes nominal series and deflates it using the food CPI from Oscar Zanetti and Alejandro García.Footnote 51 More recently, Antonio Santamaria reworked the Alienes nominal series to change the relationship between nominal GDP and imports and other factors.Footnote 52
Figure 5 compares our output index to the series from Alienes, Santamaria, and Brundenius for 1902 to 1958. Our GDP series differs greatly from previous estimates. These series show much higher income before 1920 with income higher during the First World War than for 1958. Similarly, income is higher in 1937 than in 1929. The Alienes, Brundenius, and Santamaria series are also implausibly volatile relative to our index.
COMPARING ESTIMATES OF INCOME PER CAPITA, 1902–1958 (1953 = 100)

ADJUSTING GDP FOR CHANGES IN THE TERMS OF TRADE
There is wide agreement among national income accountants that GDP volume measures for small economies should be adjusted to reflect the changes in purchasing power arising from changes in world prices.Footnote 53 Republican Cuba is a good candidate for such an adjustment since it suffered from extraordinary volatility in its external terms of trade.Footnote 54
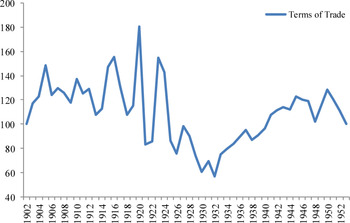
THE EXTERNAL TERMS OF TRADE OF CUBA, 1902–1953 (1953 = 100)

There are no official terms of trade indices for Republican Cuba. We use the previous import and export price indices of Thomas Birnberg and Stephen Resnick and the United Nations to estimate the external terms of trade from 1902 to 1953.Footnote 55 Additional details are available in the online Data Appendix. Figure 6 gives our estimates of the external terms of trade for Cuba from 1902 to 1953.
The volatility of the external terms of trade during the early part of the century reflects the gyrations in sugar prices. The low point occurs during the Great Depression. Thereafter the terms of trade improved, as the various trade agreements allowed Cuba access to the U.S. market and insulated Cuba from developments on world sugar markets.
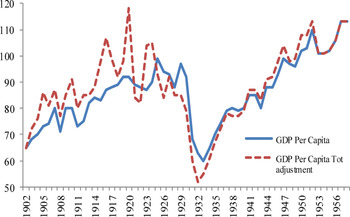
Figure 7 compares GDP with GDP adjusted for changes in the external terms of trade. We believe that the series after adjustments for external terms of trade provides a better measure of welfare as compared to the GDP volume index.Footnote 56 The terms of trade adjustments have large effects on income for two periods: the early 1920s and the 1930s. An increase in sugar prices raised the terms of trade from 115 in 1919 to 180 in 1920. This era in Cuban history is known as the “dance of millions” due to dramatic increases in consumption during this period. Without adjusting for changes in the terms of trade, 1920 income per capita is 91 percent of 1953 income. Taking into account changes in the terms of trade raises 1920 income to 117 percent of 1953 income. After adjusting for the terms of trade, we find that living standards in the 1950s never reached their 1920 level.
ADJUSTING INCOME PER CAPITA FOR CHANGES IN THE EXTERNAL TERMS OF TRADE (1953 = 100)

In contrast, the decline in the terms of trade during the 1930s reduced real income by more than GDP volumes would suggest. The terms of trade fell from 98 in 1927 to 57 in 1932. Without adjusting for the external shock, income per capita in 1932 is 68 percent of 1927 income. Including changes in the external terms of trade lowers income per capita in 1932 to 57 percent of 1927 income.
Figure 7 underlines the fact that the Great Depression was a catastrophe for Cuba. The fall in Cuban income during the Great Depression is akin to the income declines suffered by combatants such as France and Belgium in World War II.Footnote 57
Cuban society seems to have never recovered from the shock. From the early 1930s, extreme political instability and social polarization characterized the republic. President Gerardo Machado became president in 1925 with great hopes but then lost power in 1933. The ensuing political upheaval ended with the coup by Fulgencio Batista, which set in motion the course of events leading to revolution, communist rule, and the demise of the republic.
CUBA IN COMPARATIVE PERSPECTIVE FOR 1925
To show Cuba's relative standing earlier in the twentieth century, we extrapolate comparative income in 1950s prices backwards with growth rates of GDP per capita. We chose 1925 as the year for comparison because there is reasonably broad coverage for Cuban GDP and because the Cuban terms of trade for 1925 were fairly close to their level in 1953; therefore, terms of trade effects are unlikely to distort the results.Footnote 58 For the other countries, we use GDP growth rates calculated from GDP data in Maddison.Footnote 59 The resulting estimates of comparative incomes are in constant 1950s prices.
Before turning to the results, it is worth remarking that after 1925 Cuban growth was much slower than in the other countries of Europe and the Western Hemisphere. Cuba's income per capita grew by only 3 percent between 1925 and 1955 compared to 28 percent in Argentina, 23 percent in Chile, and 55 percent in the United States.
The scatter plot in Figure 8 shows that Cuba ranked higher among the countries in 1925 than in 1955. Cuban income per capita fell from 45 percent of the U.S. level in 1925 to 27 percent in 1955, while output per worker fell from 54 to 32 percent of the U.S. level. The striking change, however, is in the comparisons with European countries. Cuban income per capita for 1925 was 80 percent of the European average and exceeded Italy's by a wide margin. Moreover, output per worker was closer still to European levels. As in 1955 Cuba, Argentina, Chile, and Uruguay in 1925 had the highest incomes in Latin America, while pre-oil Venezuela was a relatively poor economy. Clearly, incomes in Cuba and the Southern Cone economies were similar to incomes in Western Europe.
During the early 1920s outside observers often considered Cuban living standards to be comparable to the poorer Southern States in the United States.Footnote 60 Based on data for U.S. income in 1929, Cuban per capita income was similar to income in South Carolina and Mississippi, the two poorest Southern States. We provide details of this comparison in the online Data Appendix.
CUBA IN COMPARATIVE PERSPECTIVE FOR 1925 (U.S. = 100)

Our finding of high relative Cuban incomes in the 1920s is supported by recent comparative work. Using trade data, Xavier Tafunell shows that Cuba's capital formation in equipment and machinery accounted for one- quarter of the Latin American total in 1920! Cuba had the highest level of investment in machinery per inhabitant in Latin America for the period from 1890 to 1930.Footnote 61 Similarly, Tafunell and Albert Carreras find that Cuba had the highest level of machinery imports and the second highest level of capital goods imports per capita in Latin America in 1925.Footnote 62 Tafunell shows that Cuban consumption of cement per capita in 1913 was the highest in Latin America, with Argentina and Uruguay close behind.Footnote 63 By 1929 Cuban cement consumption per capita was second highest in Latin America behind only Uruguay. Finally, estimates of energy consumption in Latin America and the Caribbean in the early twentieth century show Cuba among the leader group along with Argentina, Uruguay, and Chile.Footnote 64 Taken as a whole, this body of evidence suggests that Cuba was in the front rank of Latin economies during the first quarter of the twentieth century.
Yet, the 1925 comparisons should be viewed cautiously. Given the infirmities of the Cuban data and the conceptual difficulties associated with extrapolations, our estimates of relative Cuban living standards for the 1920s are meant only as rough guides. Nonetheless, once we accept that Cuba experienced slow growth between 1925 and 1955 as compared to the United States and Europe, this means relative Cuban incomes were much higher for the earlier years. The only question then is how much higher.
LOOKING BACK FROM THE TWENTY-FIRST CENTURY
This brings us to our final question, how does income per capita in present day Cuba compare its level in the late republic? There can be no precise answer to this question without PPP-adjusted estimates of recent Cuban GDP. Such estimates do not currently exist. We are able to provide a tentative comparison of Cuban consumption for 2000. We use Costa Rica as the basis for comparison due to similar consumption patterns in the two countries. In addition, we can compare education and healthcare for Cuba and Costa Rica, but not for other Latin American economies.
The United Nations Civil Service Commission provides detailed data on Cuban prices collected using International Comparison Program (ICP) classifications for 2000 and 2001. We also have nominal Cuban GDP data collected using the U.N. System of National Accounts for these years.Footnote 65 Using these data, we compare Cuban and Costa Rican consumption for food, beverages, housing, transportation, communication, healthcare, education and other services in 2000. Complete details are available in the online Data Appendix.
The results show that that overall Cuban consumption is 43 percent of Costa Rican consumption for 2000. Using the Costa Rican consumption estimates from the Penn World Tables 6.2 suggests that Cuban consumption per capita in 2000 dollars is $2,665. Appendix Table 1 shows that Cuban consumption levels in 1955 were 98 percent of Argentine levels, which leads to an estimate of Cuban consumption in 1955 of $5,100 in 2000 dollars.
These results imply that Cuban consumption levels in 2000 were 52 percent of 1955 levels. In 2000 Cuba was still recovering from an output collapse after the fall of the Eastern Bloc. Allowing for growth in consumption after 2000 using Economic Commission for Latin America (ECLA) data, an estimate of consumption for 2007 suggests that per capita consumption was 72 percent of the 1955 level.
This result provides a partial answer to the old question of the road not taken. What path would income per capita have followed for Cuba had the revolution not taken power? Since current living standards appear to be below the levels of the late republic, it is hard to visualize any scenario where the republic would not have outperformed the revolutionary economy by a considerable margin in terms of living standards.
The case for the regime therefore rests on its achievements in healthcare and education and on possible improvements in income distribution. The successes of the revolution in these areas are real. For example, Cuba has infant mortality rates below those of the United States and other developed economies.Footnote 66 To evaluate the successes, however, we have to compare current outcomes to the counterfactual of what would have occurred had the revolution failed. We suspect that overall healthcare outcomes would not have been much different given the remarkably low levels of infant mortality in Republican Cuba.
The one area where the revolution has probably done better is education. The revolution may also have leveled the income distribution, at least for the decades before the economic crisis after the collapse of the Soviet Union.Footnote 67 These issues are contentious and are well outside the scope of our article. The possible gains in these areas have to be balanced against the loss of many freedoms under revolutionary rule. We do not claim that the revolutionary regime increased or reduced welfare. We leave that for others to decide. Rather our point is that the extent of our knowledge about the republican era will determine how accurately we view or assess the record of the revolutionary regime.
CONCLUDING COMMENTS
Cuba has long been conspicuous by its absence from comparative historical studies of income and development. The neglect of Cuba has occurred because Cuba has no long-run GDP series. Moreover, there are no true Cuban PPP-adjusted income comparisons. This article takes some first steps towards filling in these gaps in the macroeconomic history of the Cuban Republic. First, we provide a PPP-adjusted international comparison of Cuban living standards for the 1950s. Second, we construct a new Cuban GDP index from 1928 to 1958 with a cruder index going back to 1902. Our estimates are tentative and much remains to be done. Users should also take into account the important conceptual differences between our estimates and those of the Penn World Tables and Maddison.Footnote 68
We hope, however, that our estimates represent an improvement in our knowledge of the Cuban economy. As scholars obtain unfettered access to the Cuban archives and Cuba joins the ICP, we will surely obtain better measures of Cuban living standards now and in the past. Nonetheless, we are confident that the broad patterns in our estimates will carry over. In particular, we believe that future work will confirm that Cuba was a middle-income economy on the eve of the revolution and that Cuban incomes were higher in a relative sense during the sugar boom. These findings are consistent with evidence from many sources and are unlikely to be overturned.
The story of Cuba during the twentieth century is therefore the story of how it has fallen in the world income distribution. What went wrong? With hindsight, the fact that central planning ended badly for Cuba should come as no surprise. Over the last fifty years, Cuba has replicated the failings of command systems elsewhere albeit in a uniquely Cuban fashion. In our view, the greater puzzle concerns economic performance in the decades after the end of the sugar boom. As Alan Dye and Mary Speck demonstrate, the Cuba of the sugar boom showed impressive levels of technological advance and institutional innovation rooted in the activities of Cuban entrepreneurs.Footnote 69
A central question for Cuban economic history is therefore to explain why the dynamism of the sugar era does not carry over to the last decades of the republic? After all, the late republic had moderate tariffs and open capital markets along with a stable monetary regime based on a hard fix to the U.S. dollar. A closer look shows that all this is true but may be beside the point. Starting in the late 1920s Cuba began to regulate its product and factor markets. The policy changes gathered pace in the 1930s after the devastating shock of the Great Depression. As a result, late Republican Cuba had exceptionally distorted labor, capital, and product markets even by the standards of Latin America.Footnote 70
Does the move to regulation explain the slow recovery of the 1930s? Does it also explain the anemic growth of the 1940s and 1950s?Footnote 71 Did the severe labor market distortions worsen unemployment and income distribution? These hypotheses are plausible but they require further work to be substantiated. On the other hand, there can be little doubt that the steep decline of income in the Great Depression and the slow recovery back to the 1920s peaks hastened the demise of the republic and partly led to the tragedies that would follow over the course of five long decades of revolutionary rule.