1. INTRODUCTION
Integrity is a measure of trust, which can be placed in the correctness of information supplied by the total system. Integrity includes the ability of a system to provide timely and valid warnings to the user. This is vital for liability and safety critical applications. Integrity risk (loss of integrity) of a navigation system is defined as the probability that a user will experience a position error (PE) larger than the alert limit (AL) without an alert being raised within the specified time-to-alert (TTA) at any instant in time and at any location in the coverage area. Loss of integrity can happen in three ways (Ochieng, Reference Ochieng2003; Tiemeyer, Reference Tiemeyer2002): an unsafe condition is not detected, an unsafe condition is detected but the isolation function removes the wrong satellite, and an unsafe condition is detected but annunciation takes longer than the TTA.
The integrity of a global navigation satellite system (GNSS) can be monitored at the independent network level (e.g. the European geostationary navigation overlay service, EGNOS), system level (e.g. Galileo), and user level. The main approach at the user sensor level is receiver autonomous integrity monitoring (RAIM). An extension of RAIM which accommodates the requirement for additional sensors to improve the performance of a GNSS such as GPS, is referred to as user level autonomous integrity monitoring (UAIM) (Feng et al Reference Feng, Ochieng, Walsh and Ioannides2006a).
Integrity monitoring at the user level can be divided into two parts: determination of the protection level (PL), and failure detection and exclusion (FDE). The PL is the upper bound of the positioning error, which is compared against the alert limit (AL) to determine if an alert should be raised. The FDE algorithm is used to detect unsafe conditions (including abnormal error in measurements). Once detected and if the exclusion function is available, then the algorithm excludes the failed measurement(s) and uses the remaining ones for positioning. If the remaining measurements cannot meet the minimum requirements (either geometry or number of visible satellites), an alert is raised because the conditions necessary for the execution of the detection function are inadequate (this is usually referred to as RAIM unavailability).
In general, failure detection algorithms are based on a number of assumptions, the most important of which is that residual errors in the measurements are normally distributed. Failure detection consists of three main steps: the construction of a test statistic; the characterisation of the test statistic and the determination of a threshold to reflect the user requirement in terms, for example, of probability of false alert; and decision making. One of the key features in the design of any integrity algorithm is its sensitivity to various types of failure modes. For positioning using GNSS, a significant error such as clock jump can be easily detected by a snapshot algorithm, while the most difficult types of failure to detect are those that grow slowly over time (e.g. clock drift at less than 2 m/s) (Lee et al Reference Lee and O'Laughlin1999). Such failures are of particular concern in filtering based UAIM because the Kalman filter tends to adapt to them. This results in the positioning solution being contaminated with the consequence of misleading information both in terms of accuracy and integrity. For this reason, early detection of this type of failure is vital.
Previous research on the detection of slowly growing errors (SGEs) has explored the suitability of the estimation of the mean of the residuals over time from the innovation of the Kalman Filter (Diesel et al Reference Diesel and Luu1995), culminating in the so-called Extrapolation Method (Lee et al Reference Lee and O'Laughlin1999). The process of estimating the mean involves storing measurements and residuals in buffers for a period of 30 minutes or more and estimating the mean of residuals over a selected time interval. The test statistic used is then the sum-squared of the estimated mean residuals which has a chi-square distribution if there is no failure and a non-central chi-square distribution otherwise (Diesel et al Reference Diesel and Luu1995). By taking a relatively long averaging interval, the covariance of the averaged residual should be small in the absence of failure and large otherwise. This property, in theory, makes it possible to detect SGEs. However, there is an issue with the degrees of freedom of the distribution if the number of satellites changes during the period of time used in the averaging process. In this case, the threshold determined from the distribution with either the current or an average number of visible satellites has the potential to result in a higher number of missed detections, false alerts or both. Any decision based on the threshold for example, does not reflect accurately the continuity risk (from which the probability of false alert is derived). Put simply, the averaging technique suffers from the fact that in some instances, the distributions used to determine the threshold and the test statistic may not match. It is important that the distribution used to determine the threshold should at least overbound the distribution of the test statistic. Given this significant weakness, the averaging concept is not discussed further in this paper.
The other approach is known as the ratio test which is based on the F distribution and is normally used to test whether there is a significant difference between two independent variants. The ratio test may be applicable to the comparison of two variants, one of which has to be fault-free. If the failure (ramp error) occurs before the test, the ratio test cannot give a correction decision. Therefore, the ratio test is not discussed further in this paper.
Given the background above, this paper proposes a “difference test” algorithm for the detection of slowly growing errors. A new test statistic is derived from the difference between the norm of the residuals at the current epoch and a previous epoch. The distribution that overbounds the test statistic is defined and justified by simulations. Section 2 of the paper gives background statistical information on overbounding. Section 3 develops the “difference test” method including the methods proposed for the determination of the test statistic, the distribution and the threshold. Section 4 looks at the application of the algorithm to early detection. Section 5 presents and discusses the results. The paper is concluded in Section 6.
2. OVERBOUNDING OF A DISTRIBUTION
The distribution of a test statistic could be non-regular which cannot be fully described by a typical distribution (e.g. normal, student etc.). Overbounding is to ensure that the probability of a known distribution is higher than the actual distribution at least for a part of a distribution such as the tail. There are normally two types of overbounding: the Probability Density Function (PDF) and Cumulative Distribution Function (CDF) (DeCleene, Reference DeCleene2000; Ober et al Reference Ober, Farnworth and Breeuwer2001). The other techniques of overbounding are largely based on these e.g. excess-mass functions (Rife et al Reference Rife, Walter and Blanch2004).
In general, PDF overbounding can be expressed as:

where p T(x) is the PDF of a typical distribution, p A(x) is the PDF of the actual distribution, a and b define the interval. If a=−∞, then p T(x) overbounds p A(x) on the left tail. If b=∞, then p T(x) overbounds p A(x) on the right tail.
Similarly, in general, CDF overbounding can be expressed as


where P T(x) is the CDF of a typical distribution, P A(x) is the CDF of the actual distribution. Expression (2) stands for P T(x) overbounding P A(x) on the left tail while expression (3) stands for P T(x) overbounding P A(x) on the right tail.
The CDF overbounding and PDF overbounding are correlated. If p A(x) is overbounded by p T(x) on the left tail (a=−∞), then P A(x) is overbounded by P T(x) on the left tail (x∈(−∞,b)). If p A(x) is overbounded by p T(x) on the right tail (b=∞), then P A(x) is overbounded by P T(x) on the right tail (x∈(a,∞)).
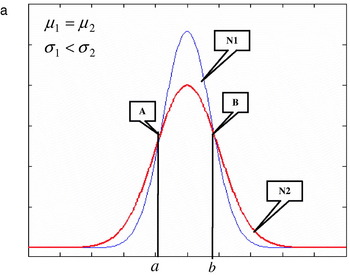
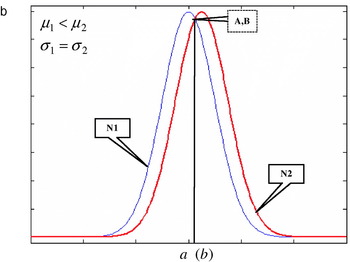
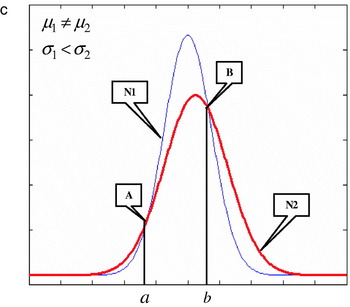
In GNSS integrity monitoring, the normal distribution is often used to overbound non-Gaussian distributed errors (e.g. multipath errors). Therefore, appropriate normal distribution in terms of overbounding is a key research issue. Suppose we have two normal distributions N 1∈N(μ1,σ1) and N 2∈N(μ2,σ2). Three typical scenarios are shown in Figures 1a–c where one can bound the other at some intervals. The intersection points A and B are the critical points for one distribution to overbound the other. Figure 1a demonstrates that N 2 overbounds N 1 in PDF at (−∞,a) and (b,∞) under the conditions of μ1=μ2 and σ1<σ2. This can be referred to as standard deviation overbounding. Figure 1b demonstrates that N 2 overbounds N 1 in PDF at (a,∞) under the conditions of μ1<μ2 and σ1=σ2. This can be referred to as mean overbounding. Figure 1c demonstrates that N 2 overbounds N 1 in PDF at (−∞,a) and (b,∞) under the conditions of μ1≠μ2 and σ1<σ2.
Overbounding of same mean and different standard deviations.

Overbounding of same standard deviation and different means.

Overbounding of different means and different standard deviations.

The critical values a and b can be resolved from the following equation (Abramowita et al, Reference Abramowita and Stegun1970)

Let m=σ12−σ22, p=2σ22μ1−2σ12μ2,  , d=p 2−4mq.
If σ2>σ1, and d⩾0, the intersection points (i.e. A,B in Figure 1) can be determined to be:

N(μ2,σ2) is used to overbound N(μ1,σ1) in the tails, with the overbounding K factor being:
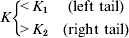
where , and which reflect the overbounding probability.
In the case of σ1=σ2 (i.e. m=0), the only intersection point is and the corresponding K factor is:

The analysis above suggests that a normal distribution can be overbounded on the left tail by another normal distribution with a larger sigma value and a left offset in the mean. The same is true for overbounding of the right tail by another normal distribution with a larger sigma value and a right offset in the mean.
3. DIFFERENCE TEST FOR DETECTING SLOWLY GROWING ERRORS
Failure detection in RAIM is based on statistical consistency checks using redundant measurements. There are two different RAIM schemes for use with measurements; snapshot and filtering (Brown, 1996). In the snapshot scheme only the current redundant measurements are used to check measurement consistency. In snapshot methods the test statistic is derived from the relationship between measurements and position given by:

where
y is the difference between the actual measured parameter (e.g. pseudorange) and the predicted parameter based on a nominal user position and clock bias. It is a n×1 vector. n is the number of measurements.
G is the design matrix (i.e. the observation matrix in a local horizontal coordinates system, e.g. ENU: East-North-Up).
x is the vector of the unknown parameters (i.e. three components of true position plus a user clock bias).
ε=[ε1 ε2 … εn]T is the measurement error vector caused by receiver noise, wave propagation, ephemeris etc. The elements of the error vector are assumed to be independent zero-mean Gaussian random variables with the same variance σm.
The square root of the sum of squared errors (SSE) is taken as a test statistic, which can be calculated by the least squares or parity methods. The SSE can be obtained from the residual vector (v) by:

where v=[I−G(G TG)−1G T]ε, I is an identity matrix (Feng et al Reference Feng, Ochieng, Walsh and Ioannides2006b). In a weighted mode where each measurement has a different error (σ), the SSE is expressed by:

Where W is the inverse of the measurement covariance matrix. Based on the assumption that the measurements errors are normally distributed with zero-mean, the SSE follows the Chi-square distribution with (n−4) degrees of freedom (Parkinson et al, Reference Parkinson and Axelrad1988). Therefore, the range residual parameter (norm of the residual), , follows a Chi-distribution with (n−4) degrees of freedom.
In the case of filtering methods, the test statistic is derived from the “innovation” of the Kalman filter as follows:

where r is the innovation vector, z is the current measurement vector, H is the observation matrix, and x_ is the state of the previous epoch. The test statistic is:

where W=(HP (−)H T+R)−1, P (−) is the predicted covariance, and R is the measurement noise matrix in the Kalman filter.
Based on the same assumption as snapshot methods for the measurements errors, the SSE follows a Chi-square distribution with degrees-of-freedom of (n) (Diesel et al, Reference Diesel and Luu1995; Lee et al, Reference Lee and O'Laughlin1999). Therefore, the range residual parameter (norm of the residual),, follows a Chi-distribution with (n) degrees of freedom. One important feature is that the statistical distributions of SSE and are completely independent of the satellite geometry for any (n) based on the assumption above under fault-free conditions.
Neither the snapshot nor filtering methods are designed for detecting slowly growing error. The concept proposed based on the mean of the residual to detect SGEs has been shown in the introduction section to have a fundamental weakness related to the change of the number of satellites. This section proposes a new approach based on the difference of the norm of the residuals between two epochs.
3.1. Test statistic
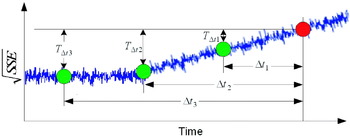
Normally GPS exhibits long term stability with normal residual measurement noise. However, in the presence of SGEs, the GPS residuals exhibit a rate of growth. Therefore, a test statistic based on the difference between the conventional test statistics at different epochs has the potential to enable the detection of SGEs (as illustrated in Figure 4). This paper proposes a “difference test” algorithm to check whether there is a significant difference between the current residuals and residuals at a previous epoch. This time period depends on the characteristics of the different failure mode. The test statistic is thus the difference between the two sets of residuals. In the basic mode, the test statistic can be expressed as:

In the weighted mode, the test statistic can be expressed as:

where t is current time and Δt is the time interval selected. The corresponding degrees of freedom are denoted as dof 2 and dof 1 respectively. σm is the standard deviation of the measurement error which is a constant value determined with the prior-knowledge of the measurement characteristics. Any change in the σm value based on previous information could be contaminated by the failures we are trying to detect. The test statistic is based on a moving window and always captures the difference between the two edges of the window. As described above, the norm of the residual follows a Chi-distribution. Therefore, the test statistic (T Δt) is in fact the difference of two Chi-distributed variants. In order to determine the threshold, the distribution of the test statistic must be known or determined.
3.2. Distribution and threshold determination
The mean (μ), standard deviation (σ), skewness (γ1) and kurtosis (γ2) of a Chi-distribution can be expressed as:
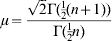



where is a Gamma function. Therefore, the theoretical mean of the difference of two Chi-distributed variants can be expressed as:

where, dof 1 and dof 2 are the degrees-of-freedom of two Chi-distributions respectively.
The variance of the difference of two Chi-distributed variants can be expressed through error propagation as:

where σ12 and σ22 are the value of expression (14) with (n) equal to dof 1 and dof 2 respectively.
The variance of the difference of two Chi-distributions converges from 0·3634 (dof=1) to 0·5 as a result of increasing degrees of freedom. Therefore, the variance of the test statistic (T Δt) converges to 1·0 as a result of increasing both dof 1 and dof 2. The minimum value is 0·7268 if both dof 1 and dof 2 take the value of 1.
Skewness is a measure of the asymmetry of the probability distribution. Roughly speaking, a distribution has a positive skew (right-skewed) if the right (higher value) tail is longer that the left tail and a negative skew (left-skewed) if the left (lower value) tail is longer than the right tail. The value of the skewness is zero for normal distribution where the probability distribution is symmetrical. The skewness of the distribution of the test statistic (T Δt) is a function of the two degrees of freedom (dof 2, dof 1 and dof 2−dof 1).
Kurtosis is the degree of peakedness of a distribution. For the normal distribution, the kurtosis is 0. It is difficult to figure out the analytical solution in terms of kurtosis for the distribution of the test statistic (T Δt). However, it can be approximated by an empirical expression using simulation based studies.
3.2.1. Simulation based analysis
This section relies on the assumption of normally distributed GPS residual errors and a conventional Chi-distributed test statistic to attempt to figure out the distribution for the new test statistic based on the difference between two variants of Chi-distribution. Hence the simulation presented is purely mathematical and scalable, and does not need to be based on GPS data.
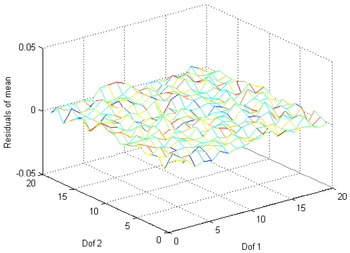
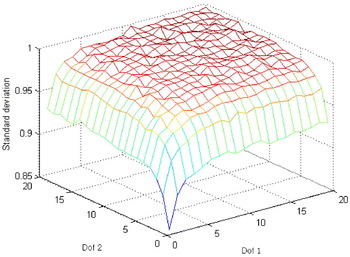
A number of Monte Carlo simulations were carried out to develop the distribution. The simulations were based on 100 000 samples each of Chi-distribution for the difference (dof 2−dof 1) of two sets of degrees-of-freedom ranging from 1 to 20. Figure 2a shows the residual of the mean of the simulated test statistic compared to the theoretical value (μd, expression 17). The values are very small with a minimum of −0·0092 and a maximum of 0·0086. The colour scheme (also in Figures 2b, 2c and 2e) emphasises the variation in three dimensions between the two sets of degrees-of-freedom and the parameter under investigation. Figure 2b shows the standard deviation (the square root of variance) of the simulated test statistic. It demonstrates that the standard deviation increases with both dof 2 and dof 1 with a minimum of 0·8506 and a maximum of 0·9982 both within the upper bound of 1. This increase is expected due to properties of measurement noise addressed in expressions (14) and (18).
The residual of mean.

The standard deviation.

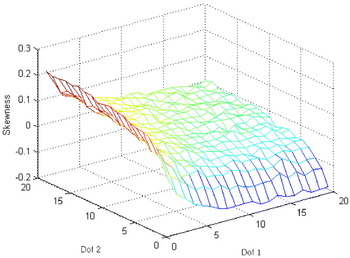
The skewness.

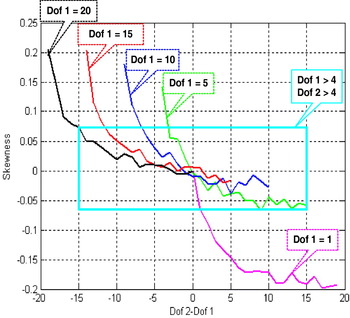
The relation of skewness and dof 2−dof 1.

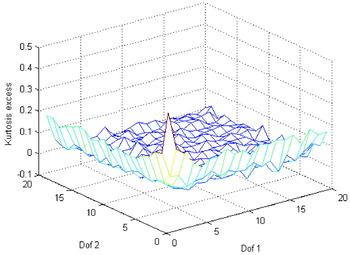
The kurtosis.

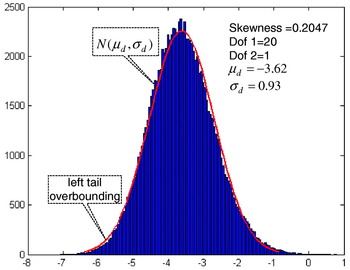
Figure 2c shows the skewness of the simulated test statistic samples. Skewness is strongly related to the value of dof 2−dof 1 with a minimum of −0·1974 and a maximum of 0·2047. The larger the absolute value of (dof 2−dof 1) the larger the skewness, and vice versa, while the sign determines whether the distribution is left or right skewed. The absolute value of the skewness tends to be large when either dof 1 or dof 2 has a small value (i.e. less than 5). The maximum value of the skewness is 0·0748 and the minimum value is −0·0671 when dof 2⩾5 and dof 1⩾5 as shown in Figure 2d. In general, the skewness is close to that of the normal distribution.
Figure 2e shows the kurtosis of the simulated test statistic samples. There is no significant offset to the normal distribution. The figure suggests that the kurtosis has a characteristic that is inverse to the standard deviation (see Figure 2b).
3.2.2. Determination of the distribution for detection
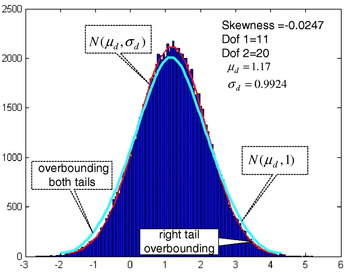
Based on the analysis of the mean, the standard deviation, the skewness, and the kurtosis, the distribution of the test statistic (T Δt) can be approximated by a normal distribution N(μd,σd) if the value of skewness is zero. If the skewness is considered, N(μd,σd) overbounds the right tail if the skewness is negative, and overbounds the left tail if the skewness is positive as shown in Figure 3a. Therefore, the test statistic can be overbounded by a normal distribution N(μd,1) if the value of skewness is close to zero where (dof 2−dof 1) is small in value. This reflects actual GNSS positioning in most environments where the number of visible satellites is around seven with a small possibility of significant deviation in the short term.
Distribution case 1.

Distribution case 2.

To have a general and conservative expression of the normal distribution that overbounds the test statistic, the skewness is used for the determination of the mean value while the standard deviation is taken to be 1 since all the values of σd are less than one. Hence, the proposed mean value is determined as:

Where μd is the theoretical mean, is the conservative offset factor with γ12 and γ11 being the skewness corresponding to dof 2 and dof 1 respectively. The offset applied to the mean value ensures that the absolute value of μD is always larger than μd while keeping the sign the same as that of μd. Therefore, the test statistic is overbounded by both the mean and standard deviation. A decision threshold can then be determined from the normal distribution N(μD,1) by taking account of the required navigation performance (RNP), specifically, the integrity and continuity risk from which the probability of missed detection (P MD) and the probability of false alert (P FA) can be derived. (Note that RNP is a concept endorsed by the International Civil Aviation Organisation (ICAO), and is a statement of the navigation performance necessary for operation within a defined airspace) (Ochieng et al, Reference Ochieng2003).
The relationship between threshold T and P FA, is (Feng et al, Reference Feng, Ochieng, Walsh and Ioannides2006b):
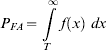
where f(x) is the probability density function of normal distribution in the fault-free case. The threshold can be calculated for a known P FA.
3.3. Early detection and identification of slowly growing error
One important factor in the test statistic constructed in section 3.1 is the time interval Δt. The choice of time interval depends on the rate of error growth and the length of the data buffer designed. Obviously, the slower the error growth rate, the longer the time interval required to detect the error.
To detect and identify SGEs, a multiple window scheme is developed below where a number of test statistics (e.g. three in Figure 4, T Δt1, T Δt2, T Δti) are used for different time intervals (Δt 1, Δt 2, Δt i). For each test statistic, a threshold can be derived from the distribution defined in section 3.2 (i.e. (TH Δt1,TH Δt2,TH Δti)). Figure 4 demonstrates the three test statistics case.
Formations of multiple test statistics.

The scenarios for failure detection are as follows:
● If T Δt3>TH Δt3, while T Δt2<TH Δt2 and T Δt1<TH Δt1, a very slow ramp error is detected;
● If T Δt3>TH Δt3, and T Δt2>TH Δt2 while T Δt1<TH Δt1, a slow ramp error is detected;
● If all the test statistics are larger than the corresponding thresholds, a relatively fast growing error is detected;
● If all the test statistics are less than the corresponding thresholds, no growing error is detected.
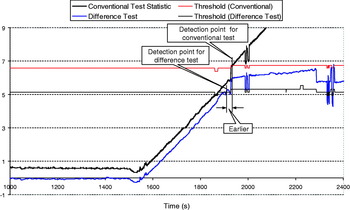
This difference test can be used to detect a failure significantly earlier compared to the conventional methods. Results demonstrate that it is able to detect a SGE about 20 seconds earlier than the conventional method as shown in Figure 6. This is crucial for safety critical applications such as aviation where the time-to-alert ranges from 5 minutes for the En-route phase of flight to 6 seconds for Category I precision approach with even more stringent requirements expected for Category II and Category III (ICAO, 2006).
Further reduction in the time taken to detect a failure can be achieved by applying the difference test to a number of sequential epochs. This is based on the hypothesis that if there is no failure, the test statistics are independent for sequential epochs. Therefore, for a given threshold, the joint probability of false alert is:

where P FA is the joint probability of false alert which reflects the user defined RNP, P FAi (i=1 … n) are the probabilities of false alert for each sequential epoch. If the values of P FAi are taken to be the same, the following equation holds:

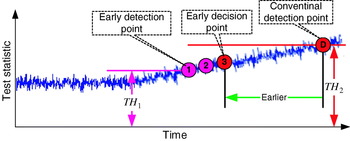
Figure 5 illustrates early detection where n=3. The single epoch detection requires a large threshold (TH 2) to reflect the RNP (e.g.1×10−6/sample false alert), while detection based on three sequential epochs requires a small threshold (TH 1 for 1×10⁻²/sample false alert) to reflect the same RNP parameters. If a measurement is faulty, the above hypothesis is breached. A failure is claimed if all the three sequential epochs detect a failure instead of waiting until the test statistic is large enough to exceed the single epoch threshold TH 2.
Early detection scheme.

The maximum number of sequential epochs is based on the K factor using the algorithm in section 2 and the parameters determined in this section above. The corresponding probability of false alert is the maximum value to be taken as P FAi for each sequential epoch. Therefore

where floor(x) means rounding to the nearest lower integer. The n max is therefore used to determine the actual P FAi from expression (22). Another benefit is that the scheme can give the confidence level at the first early detection point (e.g. 97·85% at point 1) and subsequent detection points (e.g. 99·95% at point 2).
4. RESULTS
Trial data (pseudorange measurements) contaminated by a simulated slowly growing error are used to verify the proposed methods. The trial was carried out near Aberporth, United Kingdom on 13 August 2005. The positioning algorithm uses a Kalman filter.
To demonstrate the performance of the algorithms, different time intervals for the “difference test” and different ramp errors are applied to PRN 21 at the 1500th second from epoch 0. The required probability of false alert is 3·333×10−7/sample. Figure 6 shows the test statistic (difference test) at a time interval of 360 seconds for a ramp error of 0·2 m/s. The conventional test statistic is also shown in the figure. The thresholds for the “difference test” are the same if the differences in the number of visible satellites are the same, and vice versa. The comparison of the conventional method and the difference test shows that the latter is able to detect the failure significantly earlier than the former.
Comparison of the conventional method and the difference test.

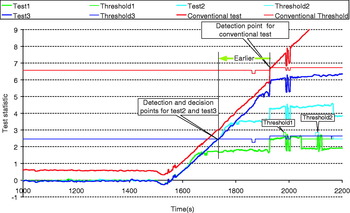
Figure 7 shows the test statistic (difference test) at time intervals of 120, 240, and 360 seconds for a ramp error of 0·2 m/s. It compares the conventional method with the difference test implementing the new early detection scheme. The algorithm with the shortest time interval (120 s) is not sensitive to this error (test 1 in the figure). On the other hand the algorithm with the longer time intervals (i.e. 240 s and 360 s) is sensitive to this error (test 2 and test 3 in the figure), and can detect the failure much earlier (about 180 s) than the conventional method.
Comparison of the conventional method and the difference test with the early detection scheme.

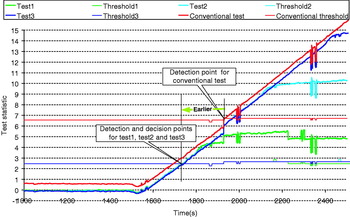
Figure 8 shows the test statistic (difference test) at time intervals of 300, 600, and 900 seconds for a ramp error of 0·2 m/s. All the three tests are able to detect the failure much earlier than the conventional methods. In comparison with the results shown in Figure 7, it is clear that the algorithm proposed is sensitive to the time interval used.
Comparison at different time intervals.

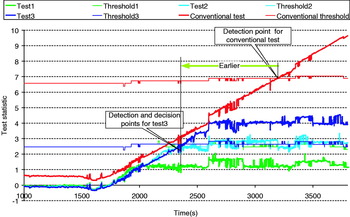
Figure 9 shows the test statistic (difference test) at time intervals of 300, 600, and 900 seconds for a ramp error of 0·05 m/s. Only the algorithm with the longest time interval (test 3) is able to detect the error earlier than the conventional method. The algorithm with a medium time interval is at the critical point where the test statistic is around the threshold (test 2). The algorithm with the shortest time interval does not detect the error. In comparison with the results shown in Figure 8, it is clear that the algorithm is sensitive to the rate of the ramp as well as emphasising the need for a good understanding of failure modes of integrity.
Comparison at different rates of error growing.

Table 1 presents the key quantities used in the comparison of the conventional method and the difference test approach. This table also shows the detectability in relation to time interval and failure mode (in terms of rate of ramp).
Comparison of results.

5. DISCUSSIONS AND CONCLUSIONS
The results in section 4 demonstrate the efficiency and sensitivity of the new algorithms in the early detection of the most difficult type of failure, the slowly growing errors. The length of the time interval used is the key factor that affects the sensitivity of the algorithm in terms of the minimum ramp error and the initialization time (i.e. the time it takes to start to execute a RAIM function). The multiple time interval algorithm can deal with the sensitivity issues completely and is also able to identify the ramp at least at a qualitative level (fast or slow).
The main contribution of this paper is the new “difference test” RAIM algorithm and the development of the distribution of the new test statistic, used to calculate the threshold. A slowly growing error detection algorithm is proposed based on the “difference test” with multiple time intervals. The “difference test” can detect a potential failure significantly earlier than conventional methods. It can be enhanced by the proposed early detection scheme to enable a further gain in the reduction in the time taken to detect a failure.
In terms of overall integrity monitoring, the first task is the characterisation of various failure modes, followed by implementation of appropriate algorithms. In this, a minimum configuration might involve the use of the difference test algorithm with carefully selected “differencing” intervals together with conventional methods in order to detect failures of different characteristics. Care should be exercised in the cases of variable rate or intermittent SGEs, with an example being multipath, which has a cyclic behaviour. In such cases the performance of the proposed algorithm will depend not only on the characteristics of the failure modes and the length of the time interval, but also the number of intervals.
ACKNOWLEDGEMENTS
This paper is the result of research carried out within SPACE project. SPACE (Seamless Positioning in All Conditions and Environments) is an EPSRC-funded collaborative research project. It is being undertaken by a consortium of eleven UK university and industrial groups. The university groups are the CAA Institute of Satellite Navigation at the University of Leeds, the Department of Civil and Environmental Engineering at Imperial College London, the Department of Geomatic Engineering at University College London (UCL), and the Institute of Engineering Surveying and Space Geodesy at University of Nottingham, and the industrial partners are the Civil Aviation Authority, EADS Astrium, Leica Geosystems, Nottingham Scientific Ltd, Ordnance Survey, QinetiQ and Thales Research and Technology.