I. INTRODUCTION
Considered as a promising rechargeable battery, nickel metal hydride (Ni–MH) batteries have been used in portable electronics and high power applications in the past decades.Reference Tliha, Khaldi, Boussami, Fenineche, El-Kedim, Mathlouthi and Lamloumi1 With the advent of Li-ion batteries, however, Ni–MH batteries have faced serious challenges mostly due to the higher energy density, no memory, and lower self-discharge offered by the newer battery technology. Nevertheless, Ni–MH batteries continue to develop and be utilized especially in high power application industries such as hybrid electric vehicles thanks to their higher safety and energy efficiency under high current rates, superior environmental friendliness, greater applicability in a broad temperature range, and lower production costs.Reference Tliha, Khaldi, Boussami, Fenineche, El-Kedim, Mathlouthi and Lamloumi1 The hydrogen-absorbing negative electrode of Ni–MH batteries has been the subject of numerous studies over the years intending to improve the performance in terms of discharge capacity, high rate discharge ability (HRD), cycle life, and nonambient temperature performance. Among the hydrogen storage alloys (HSAs), the well-known shape memory TiNi intermetallic compound shares unique hydrogen storage properties in close-to-ambient conditions of pressure and temperature making it a promising candidate as an AB-type HSA to be used as the negative electrode of Ni–MH batteries.Reference Guiose, Cuevas, Decamps and Percheronguegan2 It typically crystallizes in a high temperature (austenite) cubic CsCl-type structure (Pm3m) and has the gaseous hydrogen storage capacity of up to 1.4 H/f.u. (number of hydrogen atoms per formula unit) and the reversible electrochemical capacity of ∼150 mA h/g which is only less than half of its theoretical capacity of 355 mA h/g.Reference Guiose, Cuevas, Decamps and Percheronguegan2 In addition, upon deviation from the intermetallic compound stoichiometry or partial substitution with other transition metals, austenitic TiNi transforms into a low temperature monoclinic B19′ structure (P21/m) through a martensitic transformation around room temperature. In this state, a hydrogenation capacity of up to 2.6 H/f.u. was reported,Reference Guiose, Cuevas, Decamps and Percheronguegan2,Reference Emami and Cuevas3 potentially amounting to electrochemical capacities higher than 600 mA h/g. TiNi still suffers from poor electrochemical discharge capacity which has hindered its practical applications nonetheless. Various approaches have thus been suggested to improve its electrochemical performance such as substituting the transition metals,Reference Emami, Cuevas and Latroche4–Reference Balcerzak13 surface modifications and doping with other catalytic materials,Reference Balcerzak, Nowak, Jakubowicz and Jurczyk14,Reference Li, Elkedim, Nowak and Jurczyk15 and composite formation by blending with other hydriding compounds.Reference Zlatanova, Spassov, Eggeler and Spassova16 Among these methods, chemical substitution has proved to be a highly effective and facile technique to keenly manipulate the electrochemical performance of HSAs.Reference Rusman and Dahari17 Emami et al.Reference Emami, Cuevas and Latroche4 investigated the effect of Cu substitution for Ni in TiNi and acquired unprecedented results. The TiNi0.8Cu0.2 compound in the B19′ monoclinic structure displayed a discharge capacity of ∼300 mA h/g together with good cycle stability thanks to the thermodynamic hydride destabilization effect and martensitic transformation upon Cu addition. Other researchers, however, reported that Cu substitution for Ni reduced the discharge capacity of TiNi-based intermetallic compounds with the B2 BCC structure as the main phase.Reference Zhang, Elkedim, Ma, Balcerzak and Jurczyk5 In another investigation, low contents of Co (≤0.3 mol) substitution for Ni in TiNi slightly improved the discharge capacity and cycle stability of TiNi-based compounds with the B2 structure. In addition, the partial replacement of Ti by Zr in TiNi resulted in a high discharge capacity of up to 350 mA h/g in the B19′ monoclinic structure of pseudo-binary (Ti,Zr)Ni. However, the cycle stability suffered greatly.Reference Guiose, Cuevas, Décamps, Leroy and Percheron-Guégan7 The discharge capacity enhancement of TiNi by Zr substitution was also reported by several other researchers.Reference Makowiecka, Jankowska, Okonska and Jurczyk8–Reference Szajek, Makowiecka, Jankowska and Jurczyk10 Improved discharge capacity along with good cycle stability was resulted by partial Mg and Mn substitution as well.Reference Szajek, Makowiecka, Jankowska and Jurczyk10
Nanostructured synthesis using mechanical alloying (MA) has shown to be very effective in enhancing the thermodynamics and kinetics of hydrogen transfer through yielding nanostructured powders with clean and fresh surfaces capable of reversibly absorbing and desorbing greater amount of hydrogen atoms.Reference Jurczyk, Smardz and Szajek18
Previous investigations revealed that addition of Nb is beneficial to electrochemical properties of Mg2Ni intermetallic compounds.Reference Kashani-Bozorg, Mohri and Ebrahimi-Purkani19,Reference Mohri and Kashani-Bozorg20 Also, a study showed the enhanced discharge capacity and cycle life of Ti50Ni41Nb9 alloy electrodes compared to TiNi electrodes produced by melting methodsReference Wang, Lei and Wang21; however in this paper, we will systematically investigate the substitution of various amounts of Nb for Ni in mechanically alloyed TiNi-based compounds and quantitatively examine the electrochemical and kinetic performances of some ternary TiNiNb intermetallic compounds produced by MA and discuss the optimum amount of Nb substitution for enhancement of electrochemical hydrogen storage characteristics of TiNi-based intermetallic compounds using various electrochemical tests.
II. EXPERIMENTAL
To be able to systematically study the influence of Nb substitution for Ni in TiNi intermetallic compounds, the amount of Nb and its incremental value should not be selected too low to be left unnoticed by the imperfect repeatability of the electrochemical processes; on the other hand, large modifications in studying the basic TiNi compound could have generated entirely different compounds with different properties with respect to the main TiNi intermetallic of interest which was not the point of this study. Therefore, the values of 0.05, 0.1, and 0.2 mol were selected for Nb. Regarding these, TiNi(1−x)Nbx (x = 0, 0.05, 0.1, 0.2) intermetallic compounds were synthesized using MA. Elemental powders of Ti (98.5%, ≤150 µm, Merck KGaA, Darmstadt, Germany), Ni (99.5%, ≤1 µm, Merck KGaA), and Nb (99%, ≤20 µm, Merck KGaA) were precisely weighed and mixed in hardened steel vials (140 mL) together with chromium-hardened steel balls (diameter 20 and 10 mm) under high purity argon atmosphere (Air Products and Chemicals Inc., Allentown, Pennsylvania, >99.9995%) and milled for up to 20 h using an in-house (FP-2 FaraPazhoohesh, Isfahan, Iran) planetary ball mill (disk radius of 12 cm and disk to vial rotation ratio of 1/2). For the sake of purity, no process control agent was used in the milling process. Vial rotation speed and ball-to-powder weight ratio of 550 rpm and 20:1 were fixed, respectively, (Disk rotation speed was 225 rpm). Milling was interrupted every hour for 30 min to allow for heat dissipation and avoid excessive rise in temperature. To prevent oxidation of powder, proper O-ring was used. In addition, it was confirmed by argon gushing out of vial valve upon opening before each interval of powder removal.
The structure of the milled products was characterized using a Philips X′ Pert Pro X-ray diffraction (XRD) unit (Panalytical, Almelo, the Netherlands), with monochromatic Cu Kα radiation operating at the voltage and current of 40 kV and 30 mA, respectively. High precision XRD patterns were obtained with a step size of 0.02° and time per step of 5 s. Microstructure, morphology, and chemical analysis of the milled products were analyzed using a FEI Quanta 450 scanning electron microscope equipped with an energy dispersive spectrometry device.
For the electrochemical measurements, the working electrodes were made by mixing the milled products with pure Ni in the proportion of 1:4. Mixed powders were pressed to pellets of 10 mm diameter under a pressure of 30 MPa. A copper wire was then attached to each pellet. A tri-electrode half-cell was used for electrochemical measurements; the working electrodes as the negative electrode, a Nickel net as the counter electrode, a Hg/HgO (saturated NaOH) as the reference electrode, and 6 mol/L KOH solution as the electrolyte. Electrochemical tests were performed using a WonATech WPG100e potentiostat/galvanostat (WonATech, SeoChoGu, Seoul, Korea). To measure the electrochemical discharge capacity, the electrodes were charged at a current density of 800 mA/g for 1 h (enough for full hydrogen evolution). After 10 min of rest (open circuit), they were discharged at 80 mA/g (i.e., C/2, C is the obtained average discharge capacity) to the cut-off potential of −0.6 V versus the reference electrode. Same galvanostatic regime was implemented for 10 cycles to study the cycle stability of the electrodes. For measuring HRD, the discharge capacity of the electrodes was measured at various current densities of 160 (i.e., C), 320, 480, 800, and 1200 (i.e., 7.5C) mA/g. Kinetic properties of the electrodes were examined by the following techniques.
The linear polarization test was carried out at a scan rate of 0.1 mV/s from −10 to +10 mV (versus open circuit potential) at 50% depth of discharge (DOD). Anodic polarization was carried out at a scan rate of 1 mV/s, from open circuit potential to −0.4 V versus the reference electrode at 50% DOD. To further compare the overall electrochemical properties of TiNiNb, cyclic voltammetry (CV) curves were acquired at scan rates of 0.1, 0.5, and 1 mV/s. To calculate the hydrogen diffusion coefficient in the electrodes, a potentiostatic discharge step of +500 mV (versus open circuit potential) was applied to the fully charged electrodes for 3600 s. All measurements were carried out in the temperature of 295 K.
III. RESULTS AND DISCUSSION
A. Structure and morphology
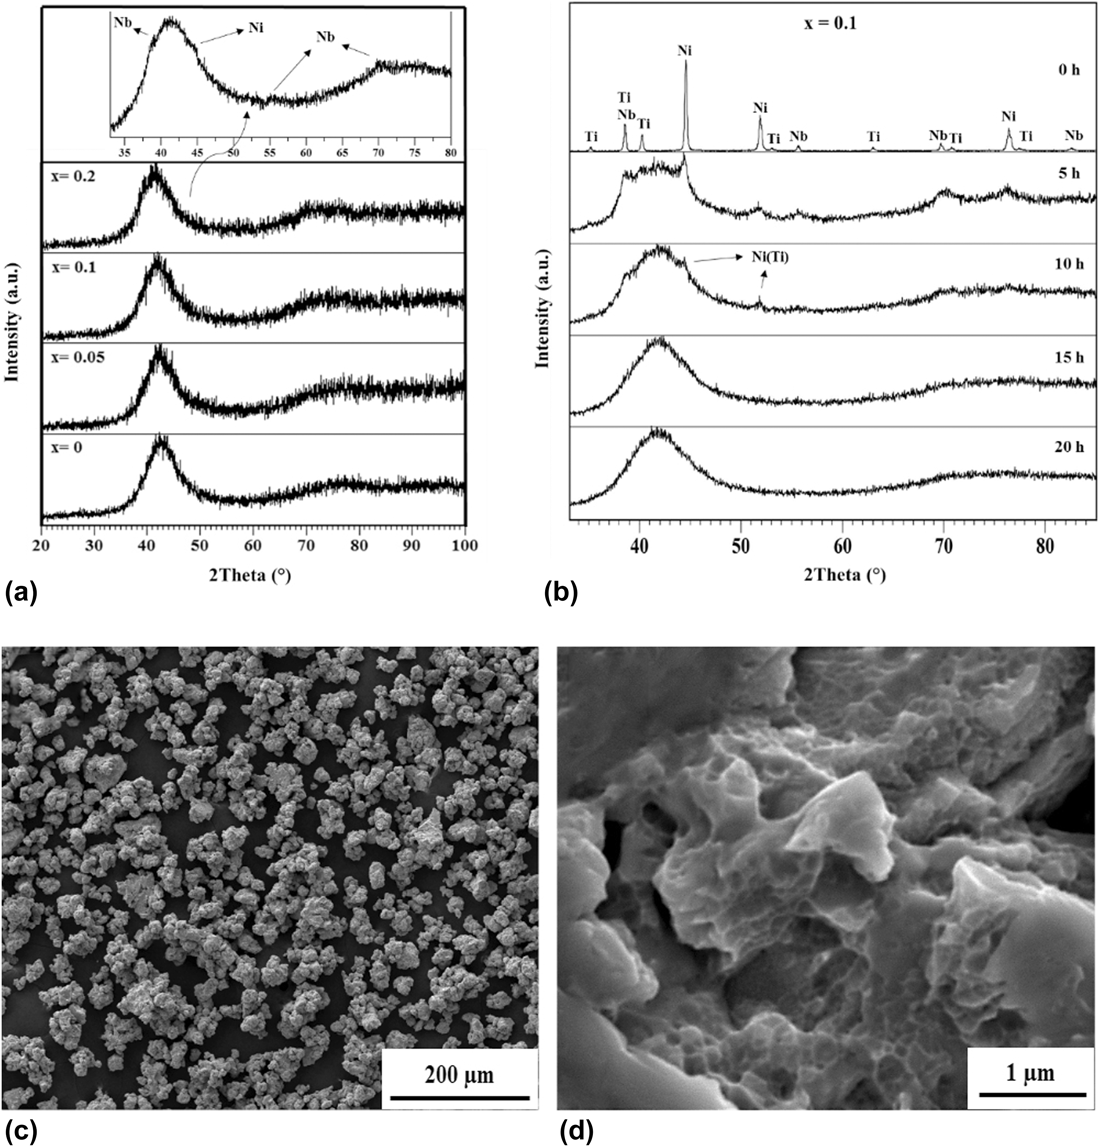
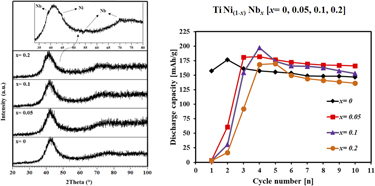
The XRD patterns of the milled TiNi(1−x)Nbx (x = 0, 0.05, 0.1, 0.2) powder mixtures for 20 h are shown in Fig. 1(a); broadened peaks and the associated background reflect a distorted nanostructured product.Reference Hapçı Ağaoğlu and Orhan22 Continuous impact on powders during milling introduces extreme number of defects into the elemental powder lattices which generate high density of dislocations in deformed powders. The hard-worked powders were then smashed and their crystallites approach nanosizes. In this way, the high density of grain boundaries reduces the interdiffusion distance between the elemental powders which significantly favors alloying.Reference Suryanarayana23
(a) XRD patterns of TiNi(1−x)Nbx (x = 0, 0.05, 0.1, 0.2) milled products after 20 h (the inset depicts the high-precision XRD pattern of the x = 0.2 ternary intermetallic compound), (b) XRD patterns of x = 0.1 ternary powder mixture after various milling times, (c) SEM micrograph of the x = 0.1 ternary milled product after 20 h, and (d) HR-SEM micrograph of (c).

The structural evolution of x = 0.1 ternary powder mixture with milling time is depicted in Fig. 1(b). After 10 h of milling, almost all Ti was dissolved in the Ni lattice forming solid solution of Ni (Ti). However, the presence of Nb indicates its difficult dissolution in the attendance of Ni and Ti. After 20 h of milling, no reflection is detected in the XRD pattern corresponding to initial elements. The occurrence of a single broad peak at 2θ vicinity of 36–47° reflects the formation of an amorphous ternary TiNiNb phase; this is consistent with the results found in other literature where initial elements of Ti and Ni were intensively milled to prolonged times leading to complete amorphization of TiNi compounds.Reference Balcerzak, Nowak, Jakubowicz and Jurczyk14,Reference Suryanarayana23,Reference Rousselot, Guay and Roué24 It was found that slight substitution of Nb for Ni in the ternary compounds does not alter the final structure of the whole compound after milling. All 20-h milled products showed similar amorphous/nanostructured patterns [Fig. 1(a)]. However, closer examination revealed that weak reflections corresponding to Nb were visible in the x = 0.2 ternary compound; this implies that Nb has not been completely dissolved in the amorphous matrix even after 20 h of milling [Fig. 1(a)]. In fact, the inset of Fig. 1 for the x = 0.2 ternary intermetallic compound demonstrates that the remaining nanostructured Ni and Nb elements are present along with the amorphous TiNiNb phase after 20 h of milling.
The morphology of the x = 0.1 ternary intermetallic compound after 20 h of milling is displayed in Fig. 1(c). Agglomerated irregular shape powder particles are clearly visible having sizes in the range of 10–20 µm. The particle size of all Nb-substituted intermetallic compounds was also found to be almost in the same range as the x = 0.1 intermetallic compound (for x = 0.05 and 0.2, they were ∼15–25 µm and ∼10–20 µm, respectively); however, the binary TiNi (x = 0) had particle sizes of almost half as that of Nb-substituted intermetallic compounds (5–15 µm, not shown here). This indicates that co-milling of slight amount of Nb with Ti and Ni elements after 20 h of milling results in coarser and more agglomerated particles, implying the ductile nature of Nb. In addition, using a higher magnification [Fig. 1(d)], layered agglomerates and nanopores on surfaces were revealed; these are principally consistent with the occurrence of repeated cold welding and fracture during MA. Such a nanoscale porous structure could be advantageous to hydrogen storage kinetics as it can provide active sites for the hydrogen reaction due to the increased surface area.
Chemical analysis using energy dispersive spectrometry was also conducted to the as-milled products and the results showed only trace amount of oxygen. XRD patterns were also free of crystallization during ball milling because it was observed that the introduction of slight amount of oxygen to the amorphous TiNi would result in crystallization of the amorphous phase.Reference Li, Elkedim, Nowak, Jurczyk and Chassagnon25
B. Electrochemical properties
1. Discharge capacity
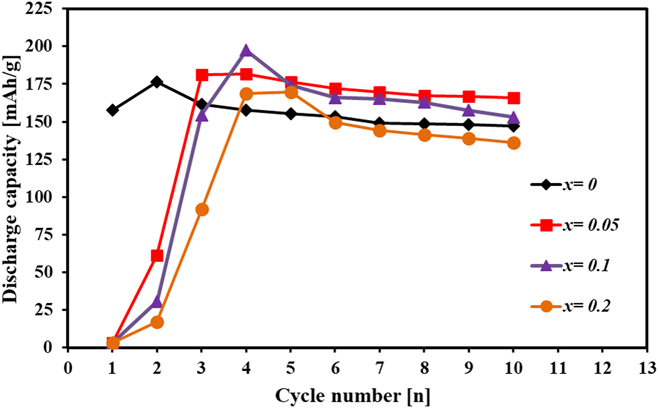
Figure 2 compares the discharge capacity of TiNi(1−x)Nbx (x = 0, 0.05, 0.1, 0.2) electrodes synthesized by MA. These electrodes were prepared from the milled products that showed only trace amount of oxygen. Before obtaining high purity as-milled products, some failed milled alloys that were exposed to oxygen during their milling were subjected to XRD and electrochemical tests; the results were expectedly way inferior to those of Fig. 2. Not only the XRD patterns were full of crystallized oxidized compounds but also their corresponding discharge capacity were too inferior barely even reaching one tenth of what is presented in Fig. 2.
Evolution of discharge capacity of TiNi(1−x)Nbx (x = 0, 0.05, 0.1, 0.2) electrodes with cycle number.

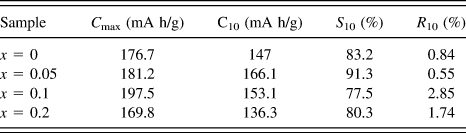
As can be seen, all electrodes require activation before reaching their maximum discharge capacities. The base binary TiNi intermetallic compound (x = 0) shows a maximum discharge capacity of over 176 mA h/g. Addition of Nb increases the maximum discharge capacity peaking at 197.5 mA h/g for the x = 0.1 intermetallic compound. However, the discharge capacities of the electrodes with higher Nb contents decreased owing to insolubility of this element in the whole compound as previously noticed in the XRD examinations [Fig. 1(a)]. Accordingly, the presence of slight amount of elemental Nb in the electrode accelerates the formation of oxides on the surface of powders in the corrosive alkaline environment. These oxides impede hydrogen transfer during electrochemical cycling. The maximum discharge capacity together with the discharge capacity in the 10th cycle for TiNi(1−x)Nbx (x = 0, 0.05, 0.1, 0.2) intermetallic compounds are presented in Table I.
Electrochemical discharge properties of TiNi(1−x)Nbx (x = 0, 0.05, 0.1, 0.2) intermetallic compounds.

The activation behavior of all the electrodes was found to be very good, indicating that the high density of clean surfaces constitutes the electrodes after the milling process. The milled products and their associated amorphous/nanocrystalline structures have very high activity to absorb a small atom like hydrogen. Oxygen, on the other hand, is adsorbed very rapidly during the ball milling process and produces oxide layers on the particles’ surfaces which certainly hinder the hydrogen intake. These thin oxide layers formed during the synthesis process are responsible for the activation issue.Reference Lee, Lee, Yu, Fateev and Lee26 Nevertheless, upon hydrogen absorption/desorption cycles by the galvanostatic regime, these thin film oxides are gradually dissolved in the highly corrosive potassium hydroxide solution as the alloy powders undergo expansion and contraction making cracks in the oxides, consequently, new clean surfaces emerge. In this way, the oxide layers are broken away and the electrodes are activated revealing their highest discharge capacities. This issue is said to be marked for AB-type electrodes especially for TiFe that naturally has much more difficult activation process which has brought problems for its commercial use.Reference Abrashev, Spassov, Bliznakov and Popov27 However, ball milling has proved to be a very promising technique for improving the activation properties of hydrogen storage materials due to production of surface-modified amorphous/nanostructured materials having superior kinetics of hydrogen transfer.Reference Jurczyk, Smardz and Szajek18,Reference Lee, Lee, Yu, Fateev and Lee26
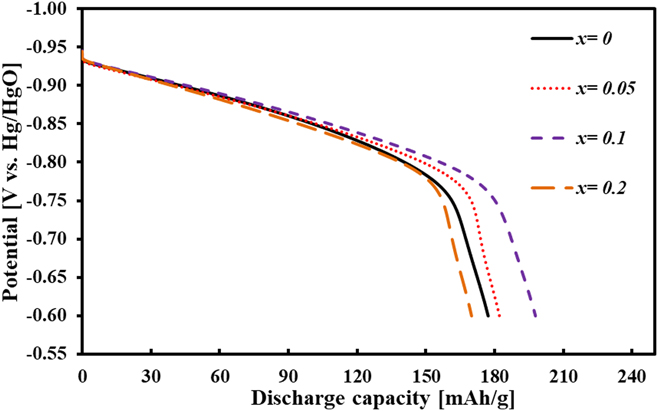
Figure 3 shows the discharge curves of the electrodes using the current density of 80 mA/g in their maximum discharge capacity. As it is seen, the curves are characterized by a sloping plateau to potentials more negative than −0.8 V (versus Hg/HgO) after which the abrupt potential drop is observed. In other words, hydrogen desorption does not occur at a fixed potential and no discernible plateau is found for these electrodes. This behavior may be attributed to the wide distribution of energy levels of hydrogen absorption in the structure. It is mentioned that for milled powders, due to high degree of lattice distortion and high amount of amorphous/nanocrystalline fraction, there are different occupation sites with different energy levels for absorption of hydrogen atoms leading to release of the absorbed hydrogen in a range of potentials when discharging.Reference Rousselot, Guay and Roué24 After the depletion of hydrogen from the interior structure of the electrodes, the potential rapidly drops. It can also be deduced that higher fraction of the amorphous phase may intensify this effect as the sites with different energies are increased as a result of disorder found in amorphous/nanocrystalline structures. This phenomenon also happens when hydrogen is absorbed by making solid solution rather than forming hydrides which has been reported for the crystalline austenitic TiNi compound.Reference Cuevas, Latroche and Ochin12 Martensitic TiNi-based compounds, however, were clearly shown to desorb hydrogen through distinctive plateaus implying their hydride formation and multiphase nature upon hydrogenation.Reference Emami, Cuevas and Latroche4,Reference Cuevas, Latroche and Ochin12 In the present case, the structure of the studied intermetallic-based electrodes was found to be utterly amorphous/nanocrystalline; consequently, the energy levels for hydrogen absorption in these materials are unspecific resulting in a sloping plateau for hydrogen release. It is worth mentioning that the study of this phenomenon systematically requires derivation of pressure-composition isotherms (PCIs) by solid–gas hydrogenation or equivalent electrochemical PCI curves where hydrogen desorption occurs in an almost equilibrium potential with minimum polarization resistance. Nevertheless, for a rough approximation of dehydriding behavior of the present intermetallic compounds, polarized discharge curves were represented alternatively.
Discharge curves of TiNi(1−x)Nbx (x = 0, 0.05, 0.1, 0.2) electrodes synthesized by MA at their maximum discharge capacity.

2. Cycle stability
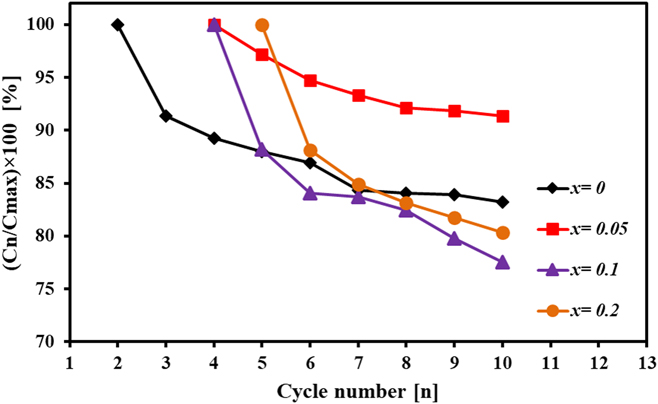
Figure 4 demonstrates the cycle stability of TiNi(1−x)Nbx (x = 0, 0.05, 0.1, 0.2) electrodes produced by MA after their activation cycle in terms of capacity retention (S n). The cycle stability of the negative electrode material is universally shown with capacity retention (S n) as
 $${S_n} = {{{C_n}} \over {{C_{{\rm{max}}}}}} \times 100\% \quad ,$$
where C n denotes the discharge capacity at nth cycle and C max denotes the maximum discharge capacity obtained for the electrode.
Capacity retention of TiNi(1−x)Nbx (x = 0, 0.05, 0.1, 0.2) electrodes with cycle number.

Another parameter can also be defined which is indicative of capacity decay per cycle (R n) as
 $${R_n} = {{{C_{n - 1}} - {C_n}} \over {{C_{n - 1}}}} \times 100\% \quad .$$
This parameter represents the capacity loss during one cycle. For the sake of comparison between the electrodes, S 10 and R 10 are presented in Table I.
As Fig. 4 and Table I suggest, slight substitution of Nb enhances the cycle stability but further addition impairs it in comparison with that of the binary (x = 0) base intermetallic compound. This could be ascribed to the relatively lower Ni content of the ternary intermetallic compound as Nb content increases that might eventually lead to higher oxidation of elements in KOH solution. However, better cycle stability of the ternary x = 0.2 intermetallic compound than that of x = 0.1 cannot be justified based on the Ni content. In fact, the presence of slight amount of nanostructured Ni homogeneously combined with the amorphous TiNiNb in x = 0.2 induces the “coating effect” on particles creating a nanocomposite which can thus act as a surface modifier or a catalyst in the whole compound suspending the oxidation process of the active material and, therefore, improving cycle stability.
Comparing these results with those presented by Wang et al.Reference Wang, Lei and Wang21 indicates somewhat different outcomes where the Ti50Ni41Nb9 compound which corresponds rather closely to the x = 0.2 alloy in this study possessed higher electrochemical properties compared to x = 0 in terms of discharge capacity and cycle stability. This discrepancy could be associated with the totally different synthesis method of the ternary TiNiNb in both studies resulting in different structures of the powder electrodes, i.e., an amorphous/nanocrystalline structure in this investigation versus the fully crystalline structure of the studied alloy by Wang et al.Reference Wang, Lei and Wang21
It is interesting to point that for all electrodes, the capacity loss after the cycle at which they reach their maximum discharge capacities is much higher than these at other cycles (Fig. 4). This is because after activation, the whole surface of particles is oxide-free and highly prone to oxidation by the corrosive environment; after being oxidized to some extent, the passive oxide layer protects the particles’ surface from further corrosion decelerating the oxidization kinetics, consequently, slowing the capacity drop.
The reason for capacity degradation during electrochemical charge/discharge cycling of TiNi-based intermetallic compounds is the gradual loss of the active material with oxidation by the formation of the oxide thin film on the surface of powders. These oxide layers impede hydrogen transfer by obstructing the process of hydrogen intake into the bulk of powders lowering the discharge capacity.Reference Guiose, Cuevas, Décamps, Leroy and Percheron-Guégan7 It should be stressed that the oxide layer formed on powders in the alkaline media must not be mistaken with the atmospheric oxide layer formed on TiNi-based intermetallic compounds during ball milling which causes the activation issue, as these two oxides must have different compositions, otherwise the activation stage would have no contribution to the discharge capacity revival. Yet, distinguishing between these two oxide thin films requires advanced surface microscopy and spectroscopy.
Any factor causing higher oxidation of the active material influences the cycle stability. For instance, pulverization is an important factor in which the powders are cracked during the electrochemical cycling and repetitive hydriding/dehydriding due to expansion and contraction of the crystal structure upon hydrogen absorption/desorption; the cracked particles with new clean surfaces are rapidly oxidized and in this way, the fraction of the active material is further reduced.Reference Gao, Zhang, Miao, Liu and Pan28 The less ductile an intermetallic-based powder or/and with excessive lattice volume change upon hydrogen transfer, the more prone it is to pulverization. The austenitic or amorphous TiNi compound is relatively a ductile intermetallic compound. In the present case, this was also confirmed by the excessive adherence of powders to balls and vial after milling. The superior electrochemical stability of TiNi-based compounds, especially the austenitic binary one, has been attributed to the remarkable passivating effect of oxide layers such that upon decrepitating of the active material, the newly formed oxides decelerate the oxidation process, consequently, lowering the detrimental effect of pulverization.Reference Cuevas, Latroche and Ochin12 By contrast, Zr-substituted TiNi compounds with monoclinic structure have been found to greatly suffer from pulverization mainly due to the loss of electrical contact between particles upon oxidation as a result of severe pulverization of the active material in these compounds.Reference Guiose, Cuevas, Décamps, Leroy and Percheron-Guégan7
3. Kinetic properties
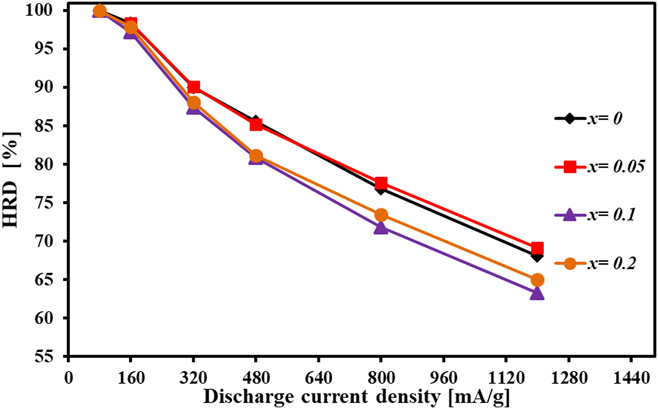
In this part, the kinetic properties of TiNi(1−x)Nbx (x = 0, 0.05, 0.1, 0.2) electrodes are investigated using various electrochemical techniques. To directly evaluate the kinetic performance of these electrodes, the HRD of the activated electrodes is shown in Fig. 5 at the current densities of 160, 320, 480, 800, and 1200 mA h/g. HRD is calculated using the following equationReference Rousselot, Guay and Roué24:
 $${\rm{HRD}}\left( \% \right) = {{{C_y}} \over {{C_y} + {C_{80}}}} \times 100\% \quad ,$$
where C y is the discharge capacity at y mA/g current density and C 80 is the remaining capacity at a current density of 80 mA/g after the electrode has been discharged at y current density. The cut-off potential was −0.6 V versus the reference electrode.
HRD% for TiNi(1−x)Nbx (x = 0, 0.05, 0.1, 0.2) electrodes at various current densities.

HRDs % of the electrodes at the current density of 1200 mA/g are listed in Table II. As can be seen in Fig. 5, all the electrodes preserve more than 60% of their capacities even at the high current density of 1200 mA/g, indicating their excellent catalytic properties. As it is obvious, the ternary x = 0.05 electrode has the highest HRD followed by the binary (x = 0) base intermetallic compound. The results indicate that slight addition of Nb improves the HRD by a small amount and further addition reduces it.
Characteristic kinetic parameters of TiNi(1−x)Nbx (x = 0, 0.05, 0.1, 0.2) electrodes.

In general, the HRD values for the electrodes are controlled by two factors: one is the charge transfer kinetics on the particles’ surface controlled by the activation polarization and the other is hydrogen diffusion kinetics into the bulk of particles controlled by concentration polarization.Reference Rousselot, Guay and Roué24,Reference Zhao and Ma29 In other words, the kinetic performance of hydrogen storage electrodes is controlled by both the kinetics of processes taking place at the electrode–electrolyte interface and the diffusion of hydrogen atoms into the particles’ lattice. As a consequence, the electrochemical kinetic parameters of an electrode-like exchange current density (I 0), limiting diffusion current density (I L), and hydrogen diffusion coefficient (D H) are investigated to fully analyze the kinetic properties of TiNi(1−x)Nbx (x = 0, 0.05, 0.1, 0.2) intermetallic compounds.
a. Determination of exchange current density
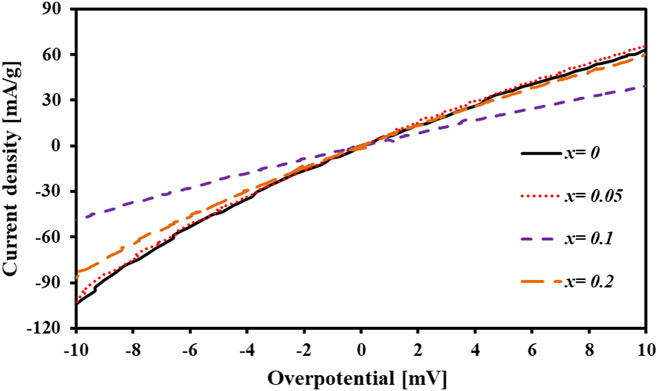
Figure 6 shows the linear polarization curve for TiNi(1−x)Nbx (x = 0, 0.05, 0.1, 0.2) electrodes produced by MA. According to Butler–Volmer,Reference Zhao and Ma29 when the over potential is scanned in a small range, the amount of exchange current density (I 0) can be calculated by
 $${I_0} = {{IRT} \over {F\eta }}\quad ,$$
where I is the applied current density (mA/g), R is the gas constant (J/mol K), T is the absolute temperature (K), F is the Faraday’s constant (C/mol), and η is the total over potential (mV). Therefore, the I/η ratio can be calculated from the slope of the line in Fig. 6.
Linear polarization curves for TiNi(1−x)Nbx (x = 0, 0.05, 0.1, 0.2) electrodes at 50% DOD and 0.1 mV/s scan rate.

The calculated values of I 0 are presented in Table II. I 0 indicates the speed at which the oxidation or reduction reactions are taking place at equilibrium potential.Reference Tliha, Khaldi, Boussami, Fenineche, El-Kedim, Mathlouthi and Lamloumi1 In general, as the charge transfer increases on the hydride surfaces, I 0 rises, lowering the activation polarization. The higher the exchange current density, the higher the electrocatalytic properties on the particles’ surface. For this reason, the particle size significantly affects this parameter such that smaller particles have higher reaction ability thus higher I 0. The high I 0 value of the x = 0.05 ternary intermetallic compound despite its larger particle size, especially in comparison with the x = 0 intermetallic compound, suggests its superior electrocatalytic activity among all the electrodes. In addition, the surface properties such as surface area, porosity, and surface oxides strongly influence the exchange current density.Reference Tliha, Khaldi, Boussami, Fenineche, El-Kedim, Mathlouthi and Lamloumi1 High reactivity of the present electrodes could also be related to the nanoporous surface morphology of the powders induced by MA. Beside surface properties, the state of charge and measurement method significantly affect the obtained value for I 0. Consequently, comparing the I 0 parameter from different studies may be misleading.Reference Tliha, Khaldi, Boussami, Fenineche, El-Kedim, Mathlouthi and Lamloumi1,Reference Zhao, Ma, Yang, Ding and Shen30 In the case of studies nearly identical to the present work, the great electrocatalytic behavior of MAed TiNi(1−x)Nbx (x = 0, 0.05, 0.1, 0.2) intermetallic compounds can be observed comparatively.
b. Determination of limiting diffusion current density and hydrogen diffusion coefficient
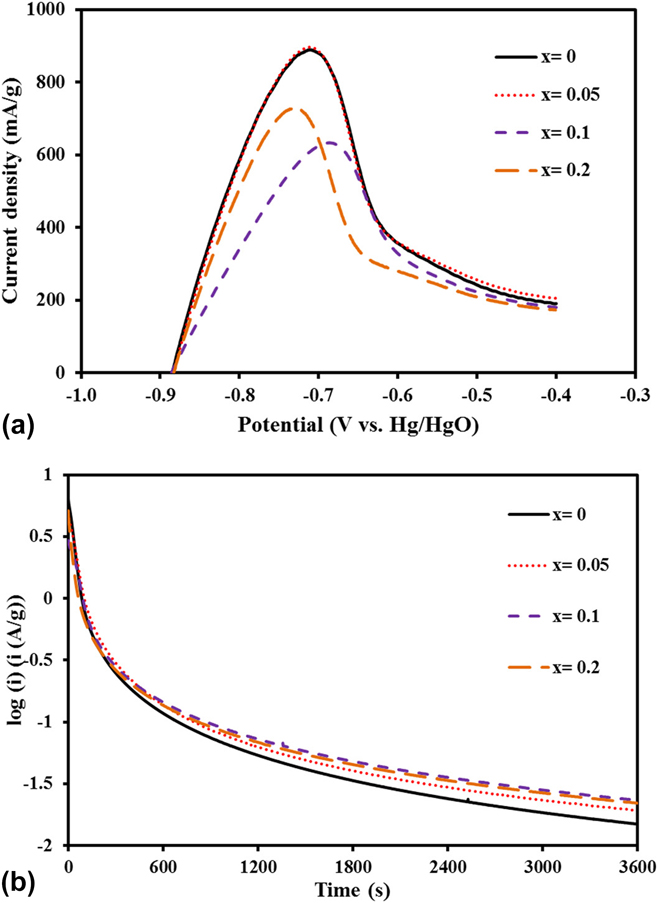
Figure 7(a) illustrates the anodic polarization curves of TiNi(1−x)Nbx (x = 0, 0.05, 0.1, 0.2) electrodes. Clearly, as the over potential increases, the anodic current initially increases and reaches a maximum point called the limiting diffusion current density (I L). I L is said to be principally controlled by the diffusion of hydrogen atoms and is less affected by the charge transfer resistance at the surface of electrodes especially at high discharge current densities.Reference Rousselot, Guay and Roué24,Reference Etiemble, Rousselot, Guo, Idrissi and Roué31 This parameter is listed in Table II for the electrodes. Expectedly, the values of I L are consistent with those of I 0. It can be concluded that both kinetic properties of mass transfer and charge transfer are in agreement for all the electrodes and that a distinctive factor may be responsible for controlling these properties which must be mainly the surface oxide layer.
(a) Anodic polarization curves for TiNi(1−x)Nbx (x = 0, 0.05, 0.1, 0.2) electrodes at 50% DOD and 1 mV/s scan rate and (b) potentiostatic discharge curves obtained for TiNi(1−x)Nbx (x = 0, 0.05, 0.1, 0.2) electrodes.

The hydrogen diffusion coefficient (D H) is estimated using the potentiostatic discharge method; the results are drawn in Fig. 7(b). Potentiostatic discharge is a very simple and convenient method commonly utilized for the study of hydrogen diffusivity in the bulk of hydrogen storage materials.Reference Guiose, Cuevas, Décamps, Leroy and Percheron-Guégan7 When a large step potential is applied to the hydride electrode, hydrogen atoms on the surface of particles are depleted rapidly and after a prolonged time, the current declines linearly. In this linear region, the hydrogen diffusion is said to control the electrode current density, which can be calculated by the following equationReference Zhao and Ma29:
 $$\log \;i = \log \left( {{{6FD} \over {d{a^2}}}\left( {{C_0} - {C_{\rm{S}}}} \right)} \right) - {{{\pi ^2}} \over {2.303}}{D \over {{a^2}}}t\quad ,$$
where i (A/g) is the current density, F is the Faraday’s constant (C/mol), D (cm2/s) is the hydrogen diffusion coefficient, d (g/cm3) is the density of the hydrogen storage material, a (cm) is the particle radius, C 0 (mol/cm3) is the initial concentration of hydrogen in the bulk of the material, C S is the surface concentration of hydrogen, and t (s) is the discharge time.
The curves in Fig. 7(b) can be divided into two regions. The first region is the nonlinear one in which the hydrogen atoms are rapidly consumed on the surface of powder particles by the application of a large step potential of +500 mV (versus stabilized open circuit potential). In the second region, however, the current declines slowly and linearly. In this region, the hydrogen atoms diffuse through the bulk of the powders according to the concentration gradient of hydrogen atoms with time. The D/a 2 values are calculated using the above equation and listed in Table II. It is seen that the values for all Nb-substituted intermetallic compounds are all nearly identical and slightly less than the x = 0 (binary) intermetallic compound. Introducing the mean particle radius of approximately 5 and 10 µm for x = 0 binary and x = 0.05 ternary intermetallic compounds, D H will be estimated to be 9 × 10⁻¹² and 3.2 × 10⁻¹¹ cm2/s, respectively. D H can be estimated for all the electrodes according to their average particle size (Table II). Obviously, Nb substitution has facilitated the diffusion of hydrogen atoms in the electrodes. The hydrogen diffusion coefficient for hydrogen storage materials has been reported to be in the range of 10−9 to 10−14 cm2/s,Reference Zhao and Ma29 even though, as with I 0, D H is largely affected by the microstructure, state of charge (i.e., the hydrogen concentration in the electrode), measurement method, and temperature.Reference Tliha, Khaldi, Boussami, Fenineche, El-Kedim, Mathlouthi and Lamloumi1
It should be emphasized that determination of the real particle size of the active electrode material for the calculation of the hydrogen diffusion coefficient is rather difficult since the galvanostatic cycling on the electrodes would cause pulverization effect on particles; this is believed to be less pronounced in the present case due to the relatively ductile nature of the studied materials.
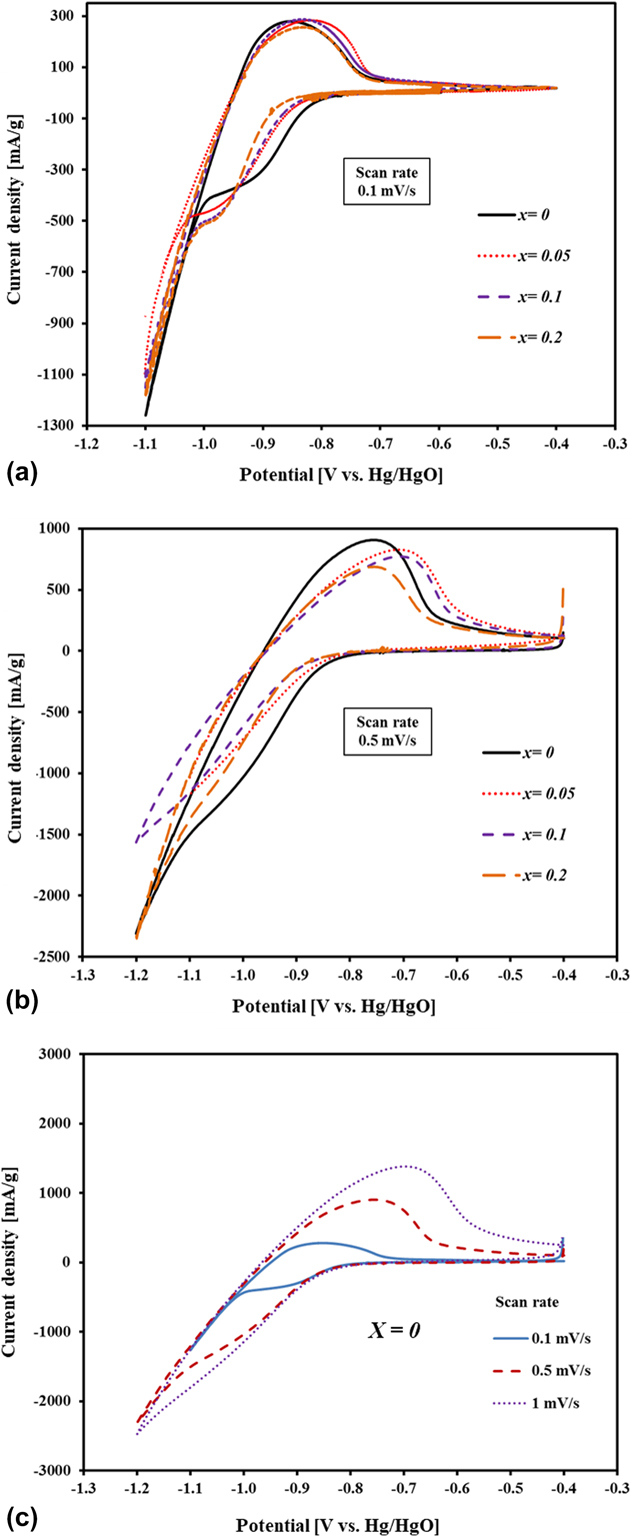
4. CV curves
To investigate the overall electrochemical process of the electrodes, CV curves are drawn in Figs. 8(a) and 8(b), for TiNi(1−x)Nbx (x = 0.05, 0.1, 0.2) ternary intermetallic compounds at the scan rates of 0.1 and 0.5 mV/s after full activation. In Fig. 8(a), for the low scan rate of 0.1 mV/s, in the cathodic direction from −0.4 V to more negative potentials, the applied current is initially very low before reaching the potentials of the hydrogen adsorption reaction. Following the potential of −0.8 V, the hydrogen atoms begin to be adsorbed on the whole electrode’s surface resulting in the current rise. As the hydrogen atoms fully cover the electrode surface, the current gradient declines until reaching a plateau. In this equilibrium state, the adsorbed hydrogen atoms are continuously absorbed into the electrode allowing more adsorbing atoms on the surface. After fully charging, the hydrogen atoms are combined into molecules and begun to evolve. In the reversal scan, however, the current is positively increased until the oxidation process occurs in positive current values and continues to rise until reaching a maximum value. The location of the anodic peak for the electrodes at around −0.84 V corresponds to the oxidation of absorbed hydrogen and the location of the cathodic peak between −0.9 and −1.0 V corresponds to the adsorption of hydrogen on the electrode surface. The area under the oxidation peak is indicative of the amount of oxidized hydrogen or namely the discharge capacity, which is consistent with the order of the discharge capacity of the electrodes described previously. The anodic peak height may also be a good indicator of the kinetics of electrodes. However, at low scan rates, low polarizations are applied to the electrodes and due to their all outstanding kinetics, their anodic peak heights are not very different. At higher scan rates like 0.5 mV/s [Fig. 8(b)], on the other hand, higher kinetics of electrodes might result in a higher peak current which is the case for the x = 0.05 ternary intermetallic compound compared to the other two Nb-contained electrodes. However, the same cannot be said about x = 0.1 and x = 0.2 ternary ones with higher kinetic properties of the latter possibly due to the higher capacity of x = 0.1 compared to that of the x = 0.2 ternary intermetallic compound. Interestingly, the base x = 0 binary intermetallic compound is superior among all the electrodes in this respect. A part of this could be ascribed to the slightly higher D/a 2 value for the x = 0 binary intermetallic compound and a part is ascribed to the fact that the x = 0.05 ternary intermetallic compound has undergone the cathodic direction up to −1.1 V compared to −1.2 V of the other electrodes. Thus, a lower time was resulted for the x = 0.05 ternary intermetallic compound to fully absorb hydrogen atoms at the scan rate of 0.5 mV/s. Overall, the superiority of all the electrodes in terms of kinetics of hydriding and dehydriding processes is evident from the appearance of distinctive current plateaus in anodic and cathodic scan directions. From Figs. 8(a) and 8(b), it is noticed that at low scan rates, the peaks are more symmetric indicating the higher reversibility of hydride reactions. However, at high scan rates, the reaction turns to a total irreversible one and a transformation from hydrogen diffusion to charge transfer occurs meaning that the effect of mass transfer on process control is reduced by the scan rate increment. In fact, high scan rates induce intense polarization and hence lead to an irreversible electrode process.Reference Jiang, Wang, Wang, Chen, Tang, Liu and Xie32
CV curves for TiNi(1−x)Nbx (x = 0.05, 0.1, 0.2) ternary electrodes at the scan rate of (a) 0.1 mV/s, (b) 0.5 mV/s, and (c) CV curves of the x = 0 binary intermetallic compound at various scan rates.

The effect of scan rate on CV curves of the x = 0 binary intermetallic compound is further depicted in Fig. 8(c). As clearly noticed, increasing the scan rate moves the anodic potential to more positive and cathodic potential to more negative values owing to higher polarization and an irreversible procedure. In other words, the anodic and cathodic peaks are more separated yet less discernible and the electrode reaction becomes more irreversible. It is noteworthy to point that in Fig. 8(c), the peak current values are almost proportional to the magnitude of the applied scan rates implying that the whole electrode reaction is controlled by surface adsorption and desorption namely the hydrogen redox reaction.Reference Ma, Wang, Hu, Jin and Chen33
IV. CONCLUSIONS
In summary, the application of MA to the elemental powder mixtures of binary TiNi and ternary TiNi(1−x)Nbx (x = 0.05, 0.1, 0.2) led to the formation of amorphous/nanostructured intermetallic compounds. All milled powders displayed outstanding activation kinetics thanks to their highly active nonequilibrium structures. Slight substitution of Nb for Ni in the TiNi intermetallic, namely TiNi0.95Nb0.05 compound, offered enhanced overall electrochemical properties including a maximal discharge capacity of 181.3 mA h/g, a capacity retention rate of above 91% after 10 cycles, HRD of more than 69% at the current density of 1200 mA/g (i.e., 7.5C), without compromising any properties in comparison to the TiNi binary intermetallic compound. The TiNi0.9Nb0.1 amorphous intermetallic compound delivered a maximum discharge capacity of 197.5 mA h/g. The optimum amount of Nb substitution was found to be between 0.05 and 0.1 mol to yield improved discharge capacity and catalytic properties. Finally, slight Nb substitution for Ni in the TiNi intermetallic compound proves to be a promising approach to boost the electrode performance of TiNi AB-type hydrogen storage materials for Ni–MH batteries.
ACKNOWLEDGMENTS
Partial financial support by Center of Excellence for Surface Engineering and Corrosion Protection of Industries, University of Tehran, and Iran Nanotechnology Initiative Council are gratefully acknowledged.