I. Introduction
What value is there in critical ratings for wine, such as those from the often-cited 20- or 100-point scales? A rating condenses the opinion of an experienced wine critic and ranks the wine against many others that the critic has reviewed. Consumers put faith in ratings as a way to overcome the fact that they have no way to know for certain, other than through a tasting session, what sensory experience is in the bottle before it is purchased. Yet a rating is nothing more than a professional opinion, the value of which depends on the degree of concordance between the opinions of the critic and consumer.
Due to the strong information asymmetry in wine markets between producers and consumers, wineries and wine retailers often use expert ratings or the results of competitive awards to signal wine quality. If the ratings of wine critics truly measure wine quality, in terms of being consistent with the preferences of wine buyers, then consumers benefit by getting the most preferable wines they can afford. There is evidence in the literature that expert ratings are positively related to wine prices (e.g., Ali et al., Reference Ali, Lecocq and Visser2008; Miller et al., Reference Miller, Genc and Driscoll2007). However, a large and growing literature has shown that consumers do not prefer more expensive and “reserve” wines in blind tastings (Ashton, Reference Ashton2014; Goldstein et al., Reference Goldstein, Almenberg, Dreber, Emerson, Herschkowitsch and Katz2008; Weil, Reference Weil2005) and that there is a high degree of inconsistency in wine competitions, both between judges in a particular competition and, especially, between competitions (e.g., Hodgson, Reference Hodgson2009a). Taken together, these studies suggest that consumers may be misled by competition awards and critical ratings.
Agreement is a central standard for expertise in wine tasting, as noted by Ashton (Reference Ashton2013), but why critics agree matters greatly for the value of ratings. Critics and wine judges should have the ability to taste and smell different attributes of a wine, and blind tasting makes it clear that any concordance that arises comes from shared opinions regarding the attributes. However, non–blinded tasting presents a moral hazard issue: critics who deviate too much from the opinions of other critics will be viewed as inept, off-beat, or both and so have an incentive to rate wines as their peers do.
A second reason the consistency of wine ratings is important pertains to wine economics. Hedonic wine-pricing studies, as well as studies of signaling behavior, depend on accurate measures of wine quality. Without such knowledge, the effects of quality and other factors on market behavior may be misestimated. Therefore, it is necessary to evaluate the extent to which wine ratings are consistent measures of quality.
In this paper, we extend the limited literature on wine critic consensus to include analysis of U.S. wines from the large wine-producing states of California and Washington. Previous studies in this area focused on Bordeaux wines, showing that professional wine critic ratings have strong concordance with both online community ratings (Gokcekus and Nottebaum, Reference Gokcekus and Nottebaum2011) and with one another (Ashton, Reference Ashton2013). We assemble and compare wine critic ratings from four wine publications—Wine Spectator (WS), Wine Enthusiast (WE), The Wine Advocate (WA), and International Wine Cellar (IWC)—to undertake a similar analysis for California and Washington wines.
We focus on consensus between wine critics instead of the reliability of individual critics because repeated tastings of the same wine by a critic are seldom done. Ashton (Reference Ashton2012) reports on the mean Pearson correlation coefficients across studies of other professional fields, which range from 0.75 in meteorology to just 0.37 in clinical psychology. Coefficients in the range of 0.6 and above are viewed very favorably. Different critics have different preferences, and so we should not expect perfect uniformity in assessments.
Our results show that there is ample critical consensus among the four publications. We collected data on 853 wines from three varietals of the 2005 vintage: cabernet sauvignon, merlot, and chardonnay. Correlating the pairs of ratings for which ratings were available, we find a high degree of consensus (r = 0.62, 0.63) between International Wine Cellar and each of Wine Spectator and Wine Advocate. We observe a lower, but still moderately high degree of consensus between Wine Spectator and Wine Advocate (r = 0.47). Wine Enthusiast has low correlation with International Wine Cellar (0.28), but moderately high correlations with Spectator and Advocate (r = 0.41, 0.44). Within each varietal, the correlations vary more, with the low between Wine Enthusiast and International Wine Cellar in cabernet (r = 0.10) and a high between Wine Advocate and International Wine Cellar, also in cabernet (r = 0.71).
An important question is whether the conditions under which the wines were tasted affects the level of consensus between the critics. Of the four, both Wine Spectator and Wine Enthusiast report blind-tasting policies, blind to both price and winemaker. Wine Advocate does not taste blind, and we have no information regarding International Wine Cellar's tasting policy. However, there is no clear connection between tasting policy and consensus. Wine Spectator shows a higher degree of consensus with Wine Advocate and International Wine Cellar than with the similarly blinded Wine Enthusiast.
Further, we conduct several robustness checks. There is little difference when examining either rank or intraclass correlations, suggesting that the influence of outliers, the arbitrariness of the cardinal rating scale, and consensus due to chance, is small. We also conduct a regression analysis to determine whether average differences in ratings per varietal or by state play a role. The pattern of correlation holds in this analysis as well.
II. Related Literature
By far, most of the literature on expert wine-rating consensus analyzes wine judge performance in major wine competitions. The well-known 1976 “Judgment in Paris” spawned several studies comparing the ratings of wine judges, reevaluating the results of the competition, and developing new methods of comparison (see, e.g., Ashenfelter and Quandt, Reference Ashenfelter and Quandt1999; Cicchetti, Reference Cicchetti2004a, Reference Cicchetti2004b, Reference Cicchetti2006). More recently a tasting of New Jersey and French wines at the sixth annual meeting of this association, a competition suggesting no distinguishable difference in wine quality among these wines, garnered much attention (Ashenfelter and Storchmann, Reference Ashenfelter and Storchmann2012; Bodington, Reference Bodington2012; Ginsburgh and Zang, Reference Ginsburgh and Zang2012; Quandt, Reference Quandt2012; Taber, Reference Taber2012; Ward, Reference Ward2012).
In an early study, Brien, May, and Mayo (Reference Brien, May and Mayo1987) found intrajudge reliability reasonably high based on tasting and retasting of the same wines, especially if the retasting occurred the same day. Lawless, Liu, and Goldwyn (Reference Lawless, Liu and Goldwyn1997) found a large range of reliability across wine judges and that reliability of the mean ratings was higher than the mean reliability of the individual judges, a result that is consistent with the literature on judges' reliability across many fields (Ashton, Reference Ashton2011). In contrast to these early studies, Cliff and King (Reference Cliff and King1997) suggested that wine judges’ ratings appear to be random. Gawel and Godden (Reference Gawel and Godden2008) also reported a large variability in reliability across judges, with a mean reliability correlation coefficient of 0.45. Further, they find a mean absolute difference in scores of repeated tastings to be 1.04 for reds and 1.16 for whites on a 20-point scale, representing an average difference of about 5%.
Following Ashenfelter's (Reference Ashenfelter2006) discussion of the general lack of concordance among wine judges, Hodgson (Reference Hodgson2008) analyzed wine judge performance, defined as a combination of consensus and reliability of judges. In his analysis of the 2005–2008 California State Fair Commercial Wine Competition, Hodgson found a high level of temporal inconsistency on ratings of the same wine by the same judge. Overall, he concluded that in only 46% of the cases was the wine quality alone the significant factor in determining a judge's score. In a follow-up study, Hodgson (Reference Hodgson2009b) also concluded that few wine judges could be considered experts, in terms of reliability. Indeed, Hodgson concludes that less than 30% attain that status.
Cao and Stokes (Reference Cao and Stokes2010) went further, dissecting judge performance at a 2009 California wine competition into parameters for bias, discrimination, and variability, which were estimated with a Bayesian ordinal model. Here bias refers to the difference between a judge's scores and the mean scores among all judges of the same wine. Discrimination refers to the similarity between the ranking assigned by a judge and the rankings of the other judges, a measure of consensus. They concluded that only three out of 67 judges at the wine competition displayed poor discrimination ability and excessive variation in their scores.
Hodgson (Reference Hodgson2009a) also extended his analysis to 13 major wine competitions, where the competition, not the individual judge, was the level of observation. The research questions were related to the replicability of a wine's medal awards across competitions. Hodgson found that among 375 wines entered in five competitions, no wine received a gold medal in either all five or at least four. Only six wines received three gold medals, 20 received two and 106 received only one gold medal. Furthermore, and perhaps most damaging for competition concordance, of the 106 wines receiving a gold medal in one competition, 84 of them received “no award,” the lowest score, in another competition. Correlation results also suggest lack of concordance with a maximum intercompetition correlation coefficient 0.33. Hodgson concluded that receiving a gold medal can be statistically explained by chance alone.
The analysis of ratings of prominent wine critics, that we undertake here, is less common than analysis of the performance of wine judges at competitions. As far as we are aware, only two studies have examined the degree of consensus among professional wine critics: Ashton (Reference Ashton2013) and Gokcekus and Nottebaum (Reference Gokcekus and Nottebaum2011). As mentioned above, the latter study focused on the relationship between prominent wine critic ratings and “community” ratings: the average of ratings given by anonymous, and amateur, subscribers to Cellar Tracker, a website dedicated to wine reviews. Gokcekus and Nottebaum found very high correlations between the professional ratings of Wine Advocate, Wine Spectator, and International Wine Cellar and the community ratings (r = 0.77, 0.77, and 0.83, respectively). However, the community ratings may have been influenced by the professional ratings themselves—users of Cellar Tracker have direct access to the professional ratings. More recently, Ashton (Reference Ashton2013) correlated ratings of prominent wine critics of red Bordeaux wine. He found that each of 100 pairwise correlations was statistically significant at the 0.01% level and that the mean of all correlations was 0.6. Notably, he confirmed a suspicion of many oenophiles that the leading critics Robert Parker and Jancis Robinson have divergent preferences, reflected in an average ratings correlation coefficient (across seven vintages) of 0.45, which was the lowest of all pairs of critics examined.
III. Data
In previous research, we compiled data on wines from California and Washington State that had been reviewed by Wine Spectator. Three hundred each of cabernet sauvignon and chardonnay were selected at random from all California and Washington wines from 2005 in that dataset. Additionally, we used all 253 vintage 2005 merlot wines in our dataset. Ratings from the other publications were compiled manually by our research assistants and are missing for many wines because coverage by the various publications overlaps only somewhat.
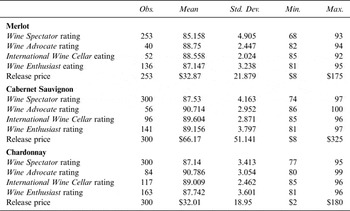
Table 1 shows that the prices range from $2 to $325, with the mean price substantially higher for cabernet sauvignon than for the other two varietals. The mean expert ratings vary from 85.1 for Wine Spectator and merlot to 90.79 for Wine Advocate and chardonnay. For all varietals, Wine Advocate had the highest average ratings. This is likely due to differences between how Advocate and the others select wines to review. Wine Advocate is focused on reviewing and recommending a narrow selection of excellent wines, while other publications review a wider range of wines. In the case of Wine Spectator, wines reviewed include those submitted by winemakers as well as wines chosen by Spectator staff. Interestingly, International Wine Cellar exhibits a lower average rating than Wine Advocate, though its scope is similarly narrow, which is evidence of “grade inflation” in Wine Advocate ratings that International Wine Cellar has resisted.
Sample Statistics, by Varietal

These publications were selected because they represent the critical opinions that are often consulted for the U.S. market. Winemakers and retailers frequently cite their ratings in marketing materials. Further, the four have adopted nearly identical rating scales, in which 100 represents perfection, and most wines are categorized in the 75–99 point range. The 100-point scale seems to be the standard in the United States, while European and Australian critics tend to go with the 20-point scale. For each publication, the 100-point scale is broken down into quality categories, typically 100–95, 94–90, 89–85, and so on. Wine Advocate uses 100–96 as its top category. Wine Enthusiast does not publish scores below 80. Wines that would have received such a score are considered unacceptable and are omitted from the publication.
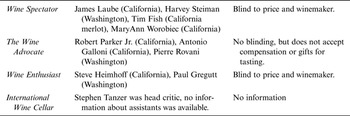
The Wine Advocate was started by prominent critic Robert Parker Jr. in 1978. In our 2005 sample of Washington and California wines, Robert Parker and his former associate Antonio Galloni tasted and reviewed California wines, and another former associate, Pierre Rovani, covered Washington wines. Wine Advocate has no blind-tasting policy, allowing its tasters full knowledge of prices, winemakers, region of origin, and varietal. However, it eschews the receipt of compensation, gifts, and favors from winemakers and industry representatives.Footnote 1
Wine Spectator has been reviewing wines since 1976. Its official tasting policy requires all tasters to be blind to price and winemaker. In our sample, James Laube was the primary taster for California cabernet sauvignon and chardonnay, though MaryAnn Worobiec reviewed some. Tim Fish reviewed California merlot, and Harvey Steiman reviewed all wines from Washington. Wine Spectator reports that 25 years of blind tastings have produced an approximately normal distribution of wine ratings, centered on 86, with only 21% classified as “outstanding” (90–94) and just 2% classified as “classic” (95–100).Footnote 2 While it would be better to compare critics directly, instead of publications, we were unable in our data to distinguish the individual critics. In some specifications, we control for region, which adjusts for differences in average ratings between the California critics and the Washington critic. Overall, our approach seems compelling because when ratings are used commercially in the United States, it is the publication and not the critic that is usually cited.
Wine Enthusiast reports that it tastes blind to price and winemaker and avoids conducting tastings hosted by individual wine producers.Footnote 3 Critics for the 2005 vintage were Steve Heimhoff for California wines and Paul Gregutt for Washington. Information about critics for International Wine Cellar was not available; Stephen Tanzer, who founded it, is its primary critic, but it is not clear whether any associates were the tasters for wines in our sample. Also, no information on tasting policy could be found on International Wine Cellar's official site.Footnote 4 Table 2 summarizes the critics and tasting policy of each publication.
Critical Publications Used in this Study

IV. Analysis of Critic Consensus
A. Pearson Correlation Coefficients
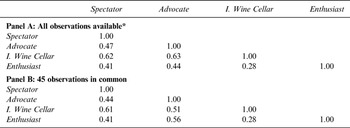
We review the Pearson product-moment correlations between rating scores for each pair of publications, which are presented in Table 3. Panel A displays correlations when using all available observations for each pair. We can see that while a high degree of correlation exists between some publications, it is not uniform. In the case of Wine Enthusiast and International Wine Cellar, the correlation is fairly low (0.28). Ashton (Reference Ashton2013), having reviewed the literature on critical consensus in many fields, characterizes a level of consensus around 0.60 as “quite favorable.” Here we find levels of consensus above 0.60 between Wine Spectator and International Wine Cellar, as well as between Wine Advocate and International Wine Cellar.
Pearson Correlation Coefficients

* Note: Observations per pair vary from 80 to 443.
Some other combinations of publications display a moderate level of consensus. Between Wine Spectator and Wine Advocate it is 0.47; between Wine Enthusiast and Wine Advocate it is 0.44, and between Wine Spectator and Wine Enthusiast 0.41. These correlations reveal some degree of consensus, although they are at the low end of the range Ashton (Reference Ashton2013, Table 3) found for critics in Bordeaux wine: 0.34–0.80. Still, these correlations are substantially higher than those found by Hodgson (Reference Hodgson2009a) between wine competitions: mostly in the 0.00–0.10 range.
The samples for the correlations in Panel A include wines of all three varietals. We did not find much variation when examining correlations by varietal subsamples (not shown in Table 3). There are exceptions, however. Wine Enthusiast has a much higher correlation with Wine Advocate in merlot (0.57) than cabernet sauvignon (0.38) and chardonnay (0.39). It also has a much lower correlation with International Wine Cellar in cabernet than the others (0.10).
Panel B presents the same set of correlations using only the 45 wines for which we have scores from all four publications. This eliminates the possibility that the differences in consensus observed in Panel A are due to the fact that different, although overlapping, samples were used. The three correlations that do not include Wine Advocate are identical to their counterparts in Panel A. However, the three with Wine Advocate differ and not always in the same direction. The correlations with Wine Spectator and International Wine Cellar are lower than with the larger samples, while the correlation with Wine Enthusiast is significantly higher. This is likely due to a few influential outliers affecting the correlations in the full sample, while the smaller sample includes fewer extreme scores. Comparing Panel B with Panel A, the correlations are still in the same general range of 0.28 to about 0.62, and Wine Enthusiast no longer stands out as uniformly having the least concordance with the other publications.
It would be a provocative finding if consensus were linked to tasting policy, if blind reviewers were more in accord than non–blind reviewers. However, there is no clear pattern from Table 3 regarding tasting policy and consensus.
B. Rank Correlations
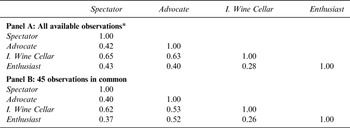
Because wine scores represent ordinal preference rankings, we examine the degree of agreement in ordinal rankings among the four publications. In Table 4, we present the Spearman correlations in rankings.
Rank Correlations

* Note: Observations per pair vary from 80 to 443.
The values in Panel A are generally similar to those of the Pearson correlations in Table 3, Panel A, but some differences emerge. The rank correlations between Wine Spectator and Wine Advocate, and Wine Enthusiast and Wine Advocate, are somewhat lower. This may reflect overlap in the high and low ends of the distribution of scores that covers up a lower degree of concordance in the middle. The rank correlation between Spectator and Enthusiast is somewhat better than the general correlation. The concordance between Wine Enthusiast and International Wine Cellar is still low, at 0.28, owing to the fact that of the three varietals for this pair, only the concordance within chardonnay wines is statistically significant.
Comparing Panel B with Panel A, we find changes similar to those in the Pearson correlations with the change in samples. The correlations for Wine Advocate are changed, lower with International Wine Cellar and higher with Wine Enthusiast. Between Wine Spectator and Wine Enthusiast, the correlation is 0.06 lower in the smaller sample. Overall, using either of the samples, the rank correlations support what we find with the correlations in Table 3: a medium level of consensus for most pairs, but higher for International Wine Cellar with Spectator and with Advocate, and a low level of consensus between International Wine Cellar and Enthusiast.
C. Intraclass Correlations
We extend the analysis to include intraclass correlations (ICC) of the ratings. We apply the (ICC) described by Olkin, Lou, Stokes, and Cao (Reference Olkin, Lou, Stokes and Cao2014), out of a set of ICC statistics catalogued by McGraw and Wong (Reference McGraw and Wong1996), because it fits the analysis of concordance of multiple critics. Because the publications are identifiable and we are interested in the level of concordance between each one and the others, we used the two-way mixed effects model:
 $${y_{ij}} = \mu + {\beta _j} + {w_i} + {u_{ij}}$$
Here y ij represents the score of wine i, i = 1,…,n, by critic j, j = 1,…,m. The term β j is a publication-specific fixed effect, w i is a wine-specific random effect, that is, a random disturbance specific to each particular wine that is common across publications, and u ij is a random disturbance specific to each score. The ICC associated with this model is defined as:
 $$\rho = \displaystyle{{\sigma _w^2} \over {\sigma _w^2 + \sigma _u^2}} $$
Higher values of the ICC therefore indicate that a greater proportion of the composite error variance is due to differences in scores between wines, rather than between critics.
We estimated
 $\sigma _w^2 $
and
 $\sigma _u^2 $
for all possible combinations of two, three, and all four of the publications from linear regressions on Equation (1). We used the STATA command xtreg to estimate random-effects models, with indicator variables included that controlled for the fixed effect of each publication, β
j
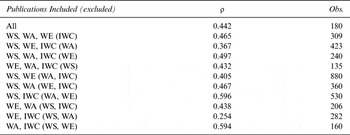
. The estimated intraclass coefficients are shown in Table 5. Note that in this analysis, each wine appeared in the dataset two to four times: each observation is a separate wine-rating instance. Table 5 shows that the ICC for the 180 ratings on 45 wines for which we had a rating from all four publications was 0.442. For comparison, the ICC estimated by Ciccetti (Reference Cicchetti2004a) of overall concordance between the judges in the famous 1976 “Judgment of Paris” was only 0.22. The interpretation of this statistic is that 44.2% of the variance in ratings is attributable to variation in the wine-specific effects, as opposed to discordance between the critics, so it shows a moderate degree of consensus between all four publications.
Intraclass Correlation Coefficients

Note: Abbreviations refer to the publications Wine Spectator (WS), Wine Advocate (WA), Wine Enthusiast (WE) and International Wine Cellar (IWC).
Examining the three-way and pairwise ICC statistics in the remainder of Table 5, we see a similar pattern of concordance as in the Pearson and Spearman correlations. In the three-way ICCs, the one that excludes Wine Enthusiast has the highest concordance, and the one that excludes Wine Advocate the lowest, which is consistent with the previous finding of a low correlation between Enthusiast and both Wine Spectator and International Wine Cellar. In the pairwise statistics, the pattern continues. International Wine Cellar has the highest concordance with Wine Spectator and Wine Advocate, but low concordance with Wine Enthusiast. In the largest sample of pairs, Spectator and Enthusiast display a moderate level of concordance, at 0.405.
D. Regression Analysis
We conducted a regression analysis to examine whether the linear relationships given by the correlations presented in Table 3 held up after controlling for average differences in the ratings by varietal and state. Each regression estimates an equation of the form:
 $$rating{1_i} = \alpha + {\beta _1}rating{2_i} + {\beta _2}Caberne{t_i} + {\beta _3}Merlo{t_i} + {\beta _4}Was{h_i} + {\epsilon _i}$$
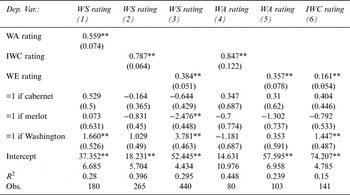
where i = 1,… , n indexes wines and ε is the random disturbance term. Each column of Table 6 shows the results of ordinary least squares (OLS) regression of one publication's rating on another, with controls for cabernet sauvignon, merlot, and Washington State.
Linear Regressions with Varietal and State Indicators

Note: Abbreviations refer to the publications Wine Spectator (WS), Wine Advocate (WA), Wine Enthusiast (WE) and International Wine Cellar (IWC). * Significant at the 5% level. ** Significant at the 1% level.
The results of Table 6 confirm that the positive correlations found in Table 3 persist despite differences in average ratings between varietals and between Washington and California wines. In the first and third regressions, with Wine Spectator rating as the dependent variable, the Washington State indicator is positive and statistically significant, revealing that Wine Spectator's ratings of Washington wines are inflated by 1.6 points more than Wine Advocate's and 3.7 points more than Wine Enthusiast's, but interestingly, not any more than International Wine Cellar's. In Equation (3), the merlot indicator is significantly negative, showing that Wine Spectator tends to rate merlot wines lower than does Wine Enthusiast, by 2.5 points.
We conducted tests for the hypothesis that β 1 = 1 , and only for Equation (4) could we not reject that hypothesis. That is, the relationship between Wine Advocate and International Wine Cellar is so close as to be in lockstep, as every extra point that Robert Parker (or an associate) assigned to a wine was matched with a point by Stephen Tanzer. This high degree of concordance is not observed for the other pairs of critics.
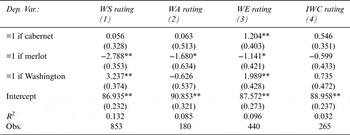
In Table 7 we examine the average differences within each publication due to varietal and Washington State. This is similar to the approach in Table 6, but we omit the rating independent variable to simply examine how the average ratings vary. That is, we estimate:
 $$ratin{g_i} = \alpha + {\beta _1}Caberne{t_i} + {\beta _2}Merlo{t_i} + {\beta _3}Was{h_i} + {\epsilon _i}$$
Linear Regressions: Ratings on Varietal and State Indicators

Note: Abbreviations refer to the publications Wine Spectator (WS), Wine Advocate (WA), Wine Enthusiast (WE) and International Wine Cellar (IWC). * Significant at the 5% level. ** Significant at the 1% level.
Under the assumption that
 $\left( {{\epsilon _i} \left\vert \right. Caberne{t_i},Merlo{t_i},Was{h_i}} \right) = 0$
,
 $$E\left( {ratin{g_i}} \right) = \alpha + {\beta _1}Caberne{t_i} + {\beta _2}Merlo{t_i} + {\beta _3}Was{h_i}$$
so the interpretation of the estimated coefficients of Cabernet, Merlot, and Wash is the difference in the average rating for wines of those categories.
Table 7, column (1) shows a large gap (3.2 points) in the average Wine Spectator ratings for Washington wines over California wines. Is this gap due to more generosity on the part of Wine Spectator's Washington critic, Harvey Steiman, or is it simply a reflection of strong quality of Washington wines? We examined the correlations between Spectator and each of the others with samples of only Washington wines, and they were all lower than their counterparts in Table 3: 0.38, 0.33, and 0.58 for WS-WE, WS-WA, and WS-IWC, respectively. However, the other three display higher consensus among themselves: 0.67, 0.65, and 0.53 for WA-IWC, WE-WA, and WE-IWC, respectively. This reveals that Steiman's opinions diverged from those of his counterparts.
Other differences are apparent from Table 7, too. A similar but smaller Washington point gap is observed for Wine Enthusiast, as seen in column (3). The average ratings for International Wine Cellar do not vary by varietal and state, as seen in column (4). Wine Advocate discounts Merlot by about 1.7 points on average, shown in column (2).
V. Concluding Comments
Our analysis reveals a moderate degree of consensus between the four most prominent critical publications in the U.S. wine market. As measured by the correlation coefficient of wine quality ratings, the degree of consensus between pairs of publications ranged from 0.28 to 0.63. At the high end of these, the correlations of Wine Spectator and Wine Advocate with International Wine Cellar, at 0.62 and 0.63, are comparable to the level of agreement that Ashton (Reference Ashton2013) found among critics in a sample of Bordeaux wines. Wine Enthusiast's opinion appears to diverge from the others the most, although when the sample is limited to a common set of wines, it showed a fairly high degree of concordance with Wine Advocate. Further, most correlations observed here exceed the level of consensus among wine competition judges, as Ashton (Reference Ashton2012) reports the mean correlation coefficient across many studies to be just 0.34 (from, inter alia, Ashton, Reference Ashton2011; Brien et al., Reference Brien, May and Mayo1987; Cicchetti, Reference Cicchetti2004a; Hodgson, Reference Hodgson2009a). So while it might be more reassuring to users of ratings if the consensus between publications were higher, we should not ever expect perfect unanimity in tastes and observe that at least the critical publications perform better than competition judges.
While the Pearson correlation coefficients are informative, they are sensitive to the cardinality of the scale used and may reflect agreement by chance. To allay those concerns, we undertook additional analyses of the rank correlations and intraclass correlations. The pattern of agreement changed only slightly.
An optimistic and conventional explanation for the greater consensus among critics than judges is that it is due to more extensive experience evaluating and comparing wines. It is possible, though, that critics do not always adhere to their publications’ tasting policies and that knowledge of winemaker, price, and even other critics’ ratings is responsible for the greater degree of consensus. This may not harm consumers for whom winemaker and price are valuable as status symbols but clearly would be misleading to consumers and researchers who value ratings as a measure of sensory quality. So while the moderate degree of consensus found here is encouraging, more research remains to be done.