




No CrossRef data available.
Data mining parasite genomes
Published online by Cambridge University Press: 12 May 2005
Abstract
The term ‘data mining’ can be used to describe any process where useful information is extracted from data with a large background of ‘noise’. In the context of a genome project, several stages involve data mining. Amongst the sequence data, ‘signals’ need to be detected that indicate the presence of interesting features. Often this involves differentiating between transcribed and non-transcribed bases to predict coding regions. After detection, defining the roles of these sequences involves sifting through multiple lines of evidence. If these roles are accurately reflected in genome annotation, they can be used by researchers to frame queries and interrogate the data further.
Information
- Type
- Research Article
- Information
- Copyright
- © 2004 Cambridge University Press
INTRODUCTION
High throughput approaches to understanding parasite biology are increasing, their costs are decreasing, and there has been an explosion in the amount of genomic data available. Deriving useful biological information from data containing high background ‘noise’ is the next challenge. In a typical genome project, several stages could be considered as involving ‘mining’ the data. After generating sequence data, the usual next step is to annotate it, a process whereby useful biological descriptions are applied to the genome. A focus of annotation often is the gene content of an organism. A variety of ‘signals’ amongst the millions of sequenced bases can indicate the presence of genes. When the genes have been defined, putative functions can be ascribed and this requires multiple lines of evidence to be drawn upon.
When the data are submitted to databases, it is often these biological descriptions that have been applied in the form of annotations that researchers encounter first. They provide not only a mechanism for researches to focus searches on genes that interest them but also a framework upon which ‘big picture’ analyses can be built. Good genome annotation reflects the collective knowledge of many scientists but distributed over the entire genome. By providing tools and database infrastructure, this diffuse knowledge can be harnessed; the data can be interrogated and new hypotheses built.
This review will describe some of the many approaches that are commonly referred to as data mining. The annotation process that is normally carried out by genome centres will be discussed as well as some of the tools and methods that can be employed to focus on regions of a genome, or subsets of genes that are of interest to any user of genome data.
GENE PREDICTION
Describing the genes is the focus of most genome annotation and is often likened to solving a puzzle. In reality, this oversimplification detracts from the fact that gene prediction is an inexact science. Against a background of millions of non-coding bases, signals need to be detected that indicate protein-coding potential. The hunt for genes takes into account numerous signals of this kind. The first of these are open reading frames (ORFs). Literally, they are a length of DNA that contains a contiguous run of codons, starting with a start codon (usually ATG in eukaryotes) and ending with one of the three stop codons. By taking into account no information, other than the spaces between stop codons (vertical bars in Fig. 1A), sequences that might encode proteins can be spotted. Fig. 1B shows that many of these ORFs were later annotated as coding sequences. Confusion sometimes surrounds the use of the terms ‘coding sequence’ (annotated as a CDS in the language of the EMBL database), ‘gene’ and ‘ORF’. The latter is most easily addressed first; its frequency is a property of the underlying sequence – and not necessarily a reflection of the number of genes. For example, stop codons are more frequent in AT-rich genomes and ORFs are less frequent but this does not mean that AT-rich genomes necessarily have fewer coding sequences. An ORF simply indicates the presence of a potential protein-coding sequence; larger ORFs are, however, more likely to encode proteins. The difference between a CDS and a gene is also distinct: genes contain coding sequences in addition to other, untranslated sequences (UTRs). The precise boundaries of a gene are usually hard to determine so annotation normally is applied only to coding sequences. It is normally assumed that the presence of a CDS indicates that a fully functional gene is present, albeit without the exact coordinates being defined. With this in mind, references to genes in the context of genome annotation are in fact usually a reference to its CDS.

Fig. 1. A six-frame translation of the genome sequence of Leishmania major reveals the position of possible genes. Two horizontal grey lines represent the top and bottom strands of the DNA sequence. Above and below the sequence the forward and reverse reading frames are depicted with vertical bars indicating the position of stop codons. The gaps between stop codons (A) agree well with the positions of final annotated protein coding sequences (B).
The fact that not all ORFs encode proteins presents a problem: which ones are real? When cis-spliced genes are considered, the problem is further compounded: open reading frames are fragmented into sections. Careful manual inspection can identify some spliced genes but the process is difficult and laborious. Computer algorithms invariably need to be employed to bring varying levels of automation to the process. A common principle behind them is that they look at the properties of known genes and build a model of what a typical gene looks like. The algorithms then search the genome for other sequences that share properties with the model. Often a particular type of statistical model, known as a Hidden Markhov Model (Krogh, 1998; Mount, 2001) is used, and it usually is built by looking at the properties of at least 100 genes, which constitute a training set. The training set may not always contain known genes, in which case putative genes are chosen based on either strong similarity to other species–for instance, it may be possible to find highly conserved ribosomal proteins – or, long ORFs may be selected. Running a gene-finder against the training set refines its accuracy to include other possible genes that appear correct upon manual inspection. By adding these additional gene predictions to the training set the performance of the gene finder can be iteratively improved.
Unfortunately, gene-finding algorithms suffer from variable performance across different genomes. For some species, obtaining a training set is difficult. For others, the underlying model might, for example, put undue emphasis on a particular aspect of a gene's structure, such as possible splice donor or acceptor sites. The most reliable gene predictions are, therefore, those that have been manually inspected. This is most easily done using a tool that allows multiple lines of evidence to be reviewed in the context of the sequence. Artemis (Rutherford et al. 2000; Berriman & Rutherford, 2003) is a freely available computer program (http://www.sanger.ac.uk/Software/Artemis/) that is particularly well-suited to the task and runs on most computer operating systems.
Researchers using genome annotation should be aware of how annotations are generated to assess their validity correctly and to decide what level of inference can be made from them. Fig. 2 illustrates how the predicted exon structure of a gene can vary depending on the computer tool used to create it. The first three lines show the results from the gene-finding tools used in the Plasmodium falciparum genome project (Gardner et al. 2002), namely Phat (Pretty Handy Annotation Tool (Cawley, Wirth & Speed, 2001)), Genefinder (Phil Green, unpublished) and Glimmer (Salzberg et al. 1999). Although they broadly agree which bases are coding sequences, the final gene structure produced by a human annotator (Fig. 2, ‘Pf Annotation’), has incorporated additional information and is in fact a combination of all three. In the absence of manual review, each prediction falls far short of predicting the precise coordinates of the exon boundaries.

Fig. 2. A comparison of gene predictions in Plasmodium falciparum. The results of three gene-finding algorithms, in the forward (+) and reverse (−) directions are compared against the annotation from the P. falciparum Genome Project (Pf Annotation). Image taken from PlasmoDB (http://plasmodb.org).
Much of the additional information used to create a gene comes from an in-depth and careful review of multiple evidence. For instance, the base composition of the DNA sequence itself can often provide essential clues. This is epitomised in the case of the P. falciparum genome (Fig. 3), where the G+C content is used to aid annotation. P. falciparum has a very low average G+C content (approximately 19·4%) but there is considerable variability between the coding regions (23·7% G+C) and the introns/intergenic regions (13·5% G+C). Therefore a comparison of the sequence against a graph of G+C content reveals the positions of likely exons (an example peak is indicated in Fig. 3A). Many organisms exhibit a bias in their use of a specific codon for the same amino acid. Like G+C content, codon bias presents another ‘signal’ to be mined from a genome. The genome of Leishmania major is an exemplary case. A plot for each reading frame (Fig. 3B), showing the correlation between codon usage frequencies of putative codons in a moving window with the codon usage of known genes in that organism, can indicate with high confidence the positions of previously unknown genes.

Fig. 3. Variation in the base composition of a genome can indicate the likely position of coding sequences. The position of exons in P. falciparum corresponds with peaks in G+C content in the genome (A). In L. major, reading-frame specific peaks in the correlation with known codon usage can indicate the presence of a coding sequence (B).
SEQUENCE COMPARISONS
Probably the most common tools for data mining involve comparisons between sequences. They are indispensable for ascribing functions to sequences and lie at the heart of bioinformatics. In similarity searches, a sequence is systematically compared to every sequence in a database. The comparison is performed by creating alignments, where every pair of residues between two sequences is compared. Similar residues receive scores and miss-matched residues incur a penalty. Gaps are inserted, with additional penalty scores incurred, in such a way as to maximise the score between the two sequences. The most commonly used sequence similarity search tools are BLAST (Altschul et al. 1990) and FASTA (Pearson & Lipman, 1988), which differ in the type of the alignment that they perform. FASTA performs a global alignment; it aligns a query sequence along it entire length against a target sequence, which is particularly suited to evaluating the overall similarity between two sequences. BLAST performs a local alignment; it aligns only the most similar regions between two sequences and is therefore particularly suited for identifying domains.
In many cases, the results of similarity searches may be ambiguous; numerous sequences may be identified to which the query sequence could be related. In these situations, a multiple alignment can be performed using tools such as Clustal W (Thompson, Higgins & Gibson, 1994). Multiple alignments can be especially effective in revealing important, conserved residues between sequences. In particular, they will quickly highlight whether a query sequence is indeed related to or represents an outlier. Motif and domain databases take this principle further and allow features that are conserved across multiple sequences to be rapidly searched, making them particularly suited to data mining. One of the least complicated systems uses a simple syntax (Bucher & Bairoch, 1994) to define specific residues as a ‘signature’ for a particular family. For instance, many ATP- or GTP-binding proteins contain alanine or glycine followed by any four residues, a glycine, a lysine and then either serine or threonine. They can searched for in databases such as Prosite (http://ca.expasy.org/prosite/), where they would be represented as: [AG]-x(4)-G-K-[ST]. Though very sensitive, these types of motifs are too inflexible to describe diffuse features or extended and complex domains. Other methods overcome these problems by capturing the probability in which individual amino acids occur in a multiple alignment. ‘Profiles’ accomplish this with a probability matrix – a probability is assigned to all 20 amino acids for every position in the sequence. The method is extended with the use of Profile HMMs (Eddy, 1998). Essentially, the major difference between Profiles and Profile HMMs is the way in which they treat inserted gaps in multiple alignments. A large searchable collection of Profile HMMs can be found in the protein families database, Pfam (http://www.sanger.ac.uk/Software/Pfam/).
The benefits of comparing sequences reach far beyond small-scale or gene-by-gene similarity searches. Large sequences can also be used and in extreme cases whole chromosomes or even genomes can be searched against each other. Although computationally intensive, these kinds of searches are increasingly becoming within the realms of the desktop computer user. The Artemis Comparison Tool (ACT) is one such example freely available (http://www.sanger.ac.uk/Software/ACT/) and is compatible with most computer operating systems. Fig. 4 shows the application in use to compare the genomes of P. falciparum and P. knowlesi. The genomes are compared directly against each other with red bars connecting regions that are similar between them. Not only are homologous genes highlighted, entire regions that appear to have common evolutionary ancestry are revealed by the conservation of gene order, as well as the conservation of individual sequences. The term ‘synteny’ has been adopted to describe this phenomenon; a deviation from its original definition (Passarge, Horsthemke & Farber, 1999) where it simply described genes from a single organism that are located on the same chromosome. Considered on a more global scale, comparing synteny across genomes has become a fast way to focus upon specific regions of interest within a genome. Breaks in synteny are particularly apparent when tools such as ACT are used to view conserved regions. For instance, when a ~90 kb region of the P. falciparum genome (Fig. 4, top) is compared with a homologous region of P. knowlesi (Fig. 4, bottom), ‘equivalent’ genes are seen in both genomes as well as an insertion of three predicted genes in P. falciparum. Of these three, ebl-1 (Fig. 4, (Peterson, Miller & Wellems, 1995), has a putative role in the invasion of red blood cells by the parasite. This highly visual method therefore highlights differences between genomes and, when closely related species are compared, it is likely that differences may include genes (or regulatory elements) that contribute to differences between parasite, such as different pathology or different host-parasite interactions. In some cases the difference can be quite subtle. Fig. 5 shows how structure of individual genes themselves can be probed. Here, P. falciparum and P. knowlesi are compared. The similarity hits from the first exon of the P. falciparum gene have been highlighted to show that they are homologous to a large first exon in a P. knowlesi gene as well as a small second exon – the P. knowlesi gene contains an additional intron.

Fig. 4. A comparison of a ~90 kb region of Plasmodium falciparum with an homologous region of P. knowlesi. A screen-shot from the Artemis Comparison Tool (ACT) is shown. Both sequences are translated into forward and reverse reading frames and the positions of annotated genes are indicated by boxes. Vertical bars connect regions of similarity between the two genomes, which have been identified using tblastx.

Fig. 5. A comparison of gene structures in Plasmodium falciparum and P. knowlesi using ACT. In P. knowlesi, the position of an additional intron is indicated with an arrow.
MINING THE DESCRIPTIONS OF GENES
Increasingly important to a data ‘miner’ is the ability to interrogate the descriptions applied to genes and their products. During the process of manual annotation, new information is learnt about each gene encountered. An ability to tap into this resource – diverse knowledge that has been applied piecemeal to the genome – is, therefore, highly desirable. Classification of gene products according to their inferred role plays an important part in being able to reconstruct aspects of parasite biology just from gene descriptions.
Enzyme Commission (EC) numbers (http://www.chem.qmw.ac.uk/iubmb/enzyme/) can be used during annotation to describe in detail the reaction that an enzyme catalyses. Therefore, when every EC number annotation to a genome is considered, entire biochemical pathways can be constructed. To aid pathway construction, powerful tools exist. For instance, the Kyoto Encyclopedia of Genes and Genomes (KEGG, http://www.genome.ac.jp/kegg/) includes many known biochemical pathways, pre-drawn as templates showing the EC numbers for each possible reaction. If a list of EC numbers is provided, KEGG highlights the pathways that can be preformed, on the pre-drawn templates. For instance, Fig. 6 shows a map of pyrimidine metabolism drawn by KEGG. Shown as shaded boxes, are EC numbers that had been annotated to the P. falciparum genome. The diagram shows an unbroken chain of steps required for de novo pyrimidine biosynthesis. Pathway analysis of this kind can also be very useful for highlighting omissions or errors in genome annotation. When gaps appear in pathways it can focus annotation efforts on finding a gene that was perhaps missed in an earlier search. Alternatively, a single EC number on a large pathway may indicate an incorrect classification of a gene during annotation.

Fig. 6. A map of pyrimidine metabolism in Plasmodium falciparum. Those EC numbers present in the P. falciparum genome annotation are shown shaded. Screenshot from the Kyoto Encyclopedia of Genes and Genomes (KEGG, http://www.genome.ad.jp/kegg/kegg2.html/).
It should be remembered that no classification system is perfect. It is by definition an abstraction of a subject. In particular, EC numbers will never classify a pathway that is novel to biology – only pathways that have been characterized in other organisms. Pathways, drawn with EC numbers, will normally only show the potential reactions that could be performed by a cell; the fact that certain subsets of metabolism become active or inactive during the various stages of a parasite's life cycle may easily be missed.
EC numbers represent a hierarchical classification system; categories can be divided into subcategories and further subdivided to provide more and more detailed descriptions. However, EC numbers have limited scope – they only describe enzyme catalysed reactions. More recently, a new system has emerged as a powerful way to describe gene products that is not limited to enzymes, namely Gene Ontology (GO) (Ashburner et al. 2000; Harris et al. 2004). GO provides a vocabulary of descriptions that cover the molecular function of a gene product, any biological process that the product is involved in, such as ‘transcription’, as well as the location of gene product in terms of its subcellular localisation, or location within a complex, such as a ribosome. The provision and maintenance of such a vocabulary as a centralised resource allows biologists to use a consistent language for sharing and communicating knowledge about what gene products do. In the context of data mining, controlled vocabularies become essential. If one database uses the description ‘translation’ and another uses the phrase ‘protein synthesis’, it is hard for a biologist to find equivalent genes from each database. For a computer, the job is even harder.
One of the strengths of GO is that the terms in the vocabulary are organized into a type of hierarchy. As with the EC number classification system, each ‘category’ is subdivided into progressively more specific sub-categories. However, in GO, the terms may belong to more than one broader category. For instance, the term ‘DNA helicase activity’ can be found within the category ‘DNA binding activity’ and within ‘helicase activity’. In this way, a researcher querying a database can find the same gene products using differently ‘phrased’ queries. Furthermore, researchers can pick terms from different levels with the structure of GO, to expand or narrow their queries to those genes in which they are really interested.
A number of tools now exist for finding genes of interest using GO terms. Recently, GeneDB (http://www.genedb.org) was established (Hertz-Fowler & Peacock, 2002; Hertz-Fowler et al. 2004) as a curated database, allowing annotated genes to be easily accessed based on their sequence or descriptions. GO terms are included with each gene and, using Amigo (Gene Ontology Consortium, http://www.godatabase.org), can be rapidly queried from the GeneDB homepage. For instance, Fig. 7 shows Amigo in use to query genes in GeneDB that have the annotation ‘glycolysis’, or any narrower description that falls within the description of ‘glycolysis’. The results have been filtered (by selecting the ‘datasource’; circled in Fig. 7A) to show only those genes that are found in P. falciparum. Clicking on any term takes the user to a results page (Fig. 7B) where every gene annotated to the selected GO term is displayed with a link to the database that annotated it.

Fig. 7. Querying Gene Ontology annotations using AmiGO. Searches can be filtered to select a specific organism (A). Clicking on a term, takes the user to a results page (B), showing all the genes annotated to the GO term and links to GeneDB.
In addition to finding genes of interest, GO is a useful tool for gaining an overview of a genome. These summaries are not limited to genome snap-shots in the form of pie-charts and histograms. GO terms provide information on the clustering of certain types of genes to specific areas in a genome – for instance, chromosome 5 of P. falciparum appears to encode more apicoplast-targeted proteins than other P. falciparum chromosomes (Hall et al. 2002). The interpretation of clustered genes can be taken even further when data from functional genomics is considered. For instance, genes clustered by their expression profiles may convey almost no information to a biologist when only the gene names are used. However, if the associated GO terms for each gene are examined – and GO descriptions are easy for computers to understand – the biological significance of the expression pattern can be more readily determined (Áshburner et al. 2000).
DISCUSSION
Information is mined from data throughout a typical genome project. The initial stages usually are carried out by genome centres and include using a variety of methods to try to accurately predict the position, structure and functions of genes. These ascribed functions can then form the framework for other researchers to interrogate the data. However, given the rapid rate in which new genome sequences are emerging, it may appear unlikely that annotations will ever keep pace. The most accurate annotations do require careful human intervention. However, when the cost of producing genome sequences is considered, the effort is worthwhile to maximise its utility. Feedback from the research community to the databases that house genome data is one important way to improve the accuracy of data. Database curators can never take the place of the expert biologist for annotating those specific genes on which his or her research is focused. For this reason, input is strongly encouraged at databases like GeneDB, which have feedback forms to facilitate community involvement. Furthermore, many of the tools used by the genome centers – such as Artemis – are available to the laboratory user, so it is possible to have the same view of a sequence as the original annotator.
Fortunately, as the repertoire of sequenced genomes increases, the investment required ot make full use of the data can be reduced. Firstly, related sequences may not need to be sequenced to completion. Furthermore, with a finished genome (one with no gaps between contigs) as a reference, synteny can be used to ‘assemble’ the contigs of a partially sequenced genome. Sequencing closely related species will also accelerate the prediction of genes, and their annotation. For instance, gene prediction from Trypanosoma vivax (http://www.genedb.org/genedb/tvivax/) has been automated by searching for orthologues sequences in the manually annotated genome of T. brucei and transferring selected annotation between the two. Furthermore, if the species for sequencing are carefully chosen, the function and organisation of genes that are usually intractable to study in one species can be annotated by making references to close relatives.
ACKNOWLEDGEMENTS
I am grateful to Christiane Hertz-Fowler for helpful discussions whilst preparing this manuscript.
References
REFERENCES
ALTSCHUL, S. F.,
GISH, W.,
MILLER, W.,
MYERS, E. W. &
LIPMAN, D. J. (
1990).
Basic local alignment search tool.
Journal of Molecular Biology
215,
403–410.CrossRefGoogle Scholar
ASHBURNER, M.,
BALL, C. A.,
BLAKE, J. A.,
BOTSTEIN, D.,
BUTLER, H.,
CHERRY, J. M.,
DAVIS, A. P.,
DOLINSKI, K.,
DWIGHT, S. S.,
EPPIG, J. T.,
HARRIS, M. A.,
HILL, D. P.,
ISSEL-TARVER, L.,
KASARSKIS, A.,
LEWIS, S.,
MATESE, J. C.,
RICHARDSON, J. E.,
RINGWALD, M.,
RUBIN, G. M. &
SHERLOCK, G. (
2000).
Gene ontology: tool for the unification of biology. The Gene Ontology Consortium.
Nature Genetics
25,
25–29.CrossRefGoogle Scholar
BERRIMAN, M. &
RUTHERFORD, K. (
2003).
Annotation and visualisation of sequences using Artemis.
Brief Bioinformatics
4,
124–132.CrossRefGoogle Scholar
BUCHER, P. &
BAIROCH, A. (
1994).
A generalized profile syntax for biomolecular sequence motifs and its function in automatic sequence interpretation.
Proceedings of the International Conference on Intelligent Systems for Molecular Biology
2,
53–61.Google Scholar
CAWLEY, S. E.,
WIRTH, A. I. &
SPEED, T. P. (
2001).
Phat – a gene finding program for Plasmodium falciparum.
Molecular and Biochemical Parasitology
118,
167–174.CrossRefGoogle Scholar
EDDY, S. R. (
1998).
Profile hidden Markov models.
Bioinformatics
14,
755–763.CrossRefGoogle Scholar
GARDNER, M. J.,
HALL, N.,
FUNG, E.,
WHITE, O.,
BERRIMAN, M.,
HYMAN, R. W.,
CARLTON, J. M.,
PAIN, A.,
NELSON, K. E.,
BOWMAN, S.,
PAULSEN, I. T.,
JAMES, K.,
EISEN, J. A.,
RUTHERFORD, K.,
SALZBERG, S. L.,
CRAIG, A.,
KYES, S.,
CHAN, M. S.,
NENE, V.,
SHALLOM, S. J.,
SUH, B.,
PETERSON, J.,
ANGIUOLI, S.,
PERTEA, M.,
ALLEN, J.,
SELENGUT, J.,
HAFT, D.,
MATHER, M. W.,
VAIDYA, A. B.,
MARTIN, D. M.,
FAIRLAMB, A. H.,
FRAUNHOLZ, M. J.,
ROOS, D. S.,
RALPH, S. A.,
McFADDEN, G. I.,
CUMMINGS, L. M.,
SUBRAMANIAN, G. M.,
MUNGALL, C.,
VENTER, J. C.,
CARUCCI, D. J.,
HOFFMAN, S. L.,
NEWBOLD, C.,
DAVIS, R. W.,
FRASER, C. M. &
BARRELL, B. (
2002).
Genome sequence of the human malaria parasite Plasmodium falciparum.
Nature
419,
498–511.CrossRefGoogle Scholar
HALL, N.,
PAIN, A.,
BERRIMAN, M.,
CHURCHER, C.,
HARRIS, B.,
HARRIS, D.,
MUNGALL, K.,
BOWMAN, S.,
ATKIN, R.,
BAKER, S.,
BARRON, A.,
BROOKS, K.,
BUCKEE, C. O.,
BURROWS, C.,
CHEREVACH, I.,
CHILLINGWORTH, C.,
CHILLINGWORTH, T.,
CHRISTODOULOU, Z.,
CLARK, L.,
CLARK, R.,
CORTON, C.,
CRONIN, A.,
DAVIES, R.,
DAVIS, P.,
DEAR, P.,
DEARDEN, F.,
DOGGETT, J.,
FELTWELL, T.,
GOBLE, A.,
GOODHEAD, I.,
GWILLIAM, R.,
HAMLIN, N.,
HANCE, Z.,
HARPER, D.,
HAUSER, H.,
HORNSBY, T.,
HOLROYD, S.,
HORROCKS, P.,
HUMPHRAY, S.,
JAGELS, K.,
JAMES, K. D.,
JOHNSON, D.,
KERHORNOU, A.,
KNIGHTS, A.,
KONFORTOV, B.,
KYES, S.,
LARKE, N.,
LAWSON, D.,
LENNARD, N.,
LINE, A.,
MADDISON, M.,
McLEAN, J.,
MOONEY, P.,
MOULE, S.,
MURPHY, L.,
OLIVER, K.,
ORMOND, D.,
PRICE, C.,
QUAIL, M. A.,
RABBINOWITSCH, E.,
RAJANDREAM, M. A.,
RUTTER, S.,
RUTHERFORD, K. M.,
SANDERS, M.,
SIMMONDS, M.,
SEEGER, K.,
SHARP, S.,
SMITH, R.,
SQUARES, R.,
SQUARES, S.,
STEVENS, K.,
TAYLOR, K.,
TIVEY, A.,
UNWIN, L.,
WHITEHEAD, S.,
WOODWARD, J.,
SULSTON, J. E.,
CRAIG, A.,
NEWBOLD, C. &
BARRELL, B. G. (
2002).
Sequence of Plasmodium falciparum chromosomes 1, 3–9 and 13.
Nature
419,
527–531.CrossRefGoogle Scholar
HARRIS, M. A.,
CLARK, J.,
IRELAND, A.,
LOMAX, J.,
ASHBURNER, M.,
FOULGER, R.,
EILBECK, K.,
LEWIS, S.,
MARSHALL, B.,
MUNGALL, C.,
RICHTER, J.,
RUBIN, G. M.,
BLAKE, J. A.,
BULT, C.,
DOLAN, M.,
DRABKIN, H.,
EPPIG, J. T.,
HILL, D. P.,
NI, L.,
RINGWALD, M.,
BALAKRISHNAN, R.,
CHERRY, J. M.,
CHRISTIE, K. R.,
COSTANZO, M. C.,
DWIGHT, S. S.,
ENGEL, S.,
FISK, D. G.,
HIRSCHMAN, J. E.,
HONG, E. L.,
NASH, R. S.,
SETHURAMAN, A.,
THEESFELD, C. L.,
BOTSTEIN, D.,
DOLINSKI, K.,
FEIERBACH, B.,
BERARDINI, T.,
MUNDODI, S.,
RHEE, S. Y.,
APWEILER, R.,
BARRELL, D.,
CAMON, E.,
DIMMER, E.,
LEE, V.,
CHISHOLM, R.,
GAUDET, P.,
KIBBE, W.,
KISHORE, R.,
SCHWARZ, E. M.,
STERNBERG, P.,
GWINN, M.,
HANNICK, L.,
WORTMAN, J.,
BERRIMAN, M.,
WOOD, V.,
DE LA CRUZ, N.,
TONELLATO, P.,
JAISWAL, P.,
SEIGFRIED, T. &
WHITE, R. (
2004).
The Gene Ontology (GO) database and informatics resource.
Nucleic Acids Research
32,
D258–D261.Google Scholar
HERTZ-FOWLER, C. &
PEACOCK, C. S. (
2002).
Introducing GeneDB: a generic database.
Trends in Parasitology
18,
465–467.CrossRefGoogle Scholar
HERTZ-FOWLER, C.,
PEACOCK, C. S.,
WOOD, V.,
ASLETT, M.,
KERHORNOU, A.,
MOONEY, P.,
TIVEY, A.,
BERRIMAN, M.,
HALL, N.,
RUTHERFORD, K.,
PARKHILL, J.,
IVENS, A. C.,
RAJANDREAM, M. A. &
BARRELL, B. (
2004).
GeneDB: a resource for prokaryotic and eukaryotic organisms.
Nucleic Acids Research
32,
D339–D343.CrossRefGoogle Scholar
KROGH, A. (
1998).
An Introduction to Hidden Markov Models for Biological Sequences. In
Computational Methods in Molecular Biology
(ed. S. L. Salzberg, D. B. Searls and S. Kasif), pp.
45–63. Elsevier Amsterdam.CrossRef
MOUNT, D. W. (
2001).
Bioinformatics: Sequence and Genome Analysis.
Cold Spring Harbor Laboratory Press,
Cold Spring Harbor, New York.
PASSARGE, E.,
HORSTHEMKE, B. &
FARBER, R. A. (
1999).
Incorrect use of the term synteny.
Nature Genetics
23,
387.CrossRefGoogle Scholar
PEARSON, W. R. &
LIPMAN, D. J. (
1988).
Improved tools for biological sequence comparison.
Proceedings of the National Academy of Sciences, USA
85,
2444–2448.CrossRefGoogle Scholar
PETERSON, D. S.,
MILLER, L. H. &
WELLEMS, T. E. (
1995).
Isolation of multiple sequences from the Plasmodium falciparum genome that encode conserved domains homologous to those in erythrocyte-binding proteins.
Proceedings of the National Academy of Sciences, USA
92,
7100–7104.CrossRefGoogle Scholar
RUTHERFORD, K.,
PARKHILL, J.,
CROOK, J.,
HORSNELL, T.,
RICE, P.,
RAJANDREAM, M. A. &
BARRELL, B. (
2000).
Artemis: sequence visualization and annotation.
Bioinformatics
16,
944–945.CrossRefGoogle Scholar
SALZBERG, S. L.,
PERTEA, M.,
DELCHER, A. L.,
GARDNER, M. J. &
TETTELIN, H. (
1999).
Interpolated Markov models for eukaryotic gene finding.
Genomics
59,
24–31.CrossRefGoogle Scholar
THOMPSON, J. D.,
HIGGINS, D. G. &
GIBSON, T. J. (
1994).
CLUSTAL W: improving the sensitivity of progressive multiple sequence alignment through sequence weighting, position-specific gap penalties and weight matrix choice.
Nucleic Acids Research
22,
4673–4680.CrossRefGoogle Scholar
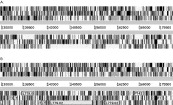
Fig. 1. A six-frame translation of the genome sequence of Leishmania major reveals the position of possible genes. Two horizontal grey lines represent the top and bottom strands of the DNA sequence. Above and below the sequence the forward and reverse reading frames are depicted with vertical bars indicating the position of stop codons. The gaps between stop codons (A) agree well with the positions of final annotated protein coding sequences (B).
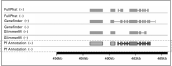
Fig. 2. A comparison of gene predictions in Plasmodium falciparum. The results of three gene-finding algorithms, in the forward (+) and reverse (−) directions are compared against the annotation from the P. falciparum Genome Project (Pf Annotation). Image taken from PlasmoDB (http://plasmodb.org).
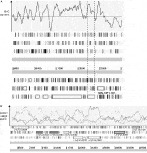
Fig. 3. Variation in the base composition of a genome can indicate the likely position of coding sequences. The position of exons in P. falciparum corresponds with peaks in G+C content in the genome (A). In L. major, reading-frame specific peaks in the correlation with known codon usage can indicate the presence of a coding sequence (B).
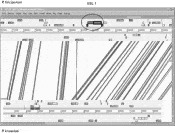
Fig. 4. A comparison of a ~90 kb region of Plasmodium falciparum with an homologous region of P. knowlesi. A screen-shot from the Artemis Comparison Tool (ACT) is shown. Both sequences are translated into forward and reverse reading frames and the positions of annotated genes are indicated by boxes. Vertical bars connect regions of similarity between the two genomes, which have been identified using tblastx.
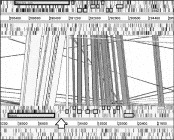
Fig. 5. A comparison of gene structures in Plasmodium falciparum and P. knowlesi using ACT. In P. knowlesi, the position of an additional intron is indicated with an arrow.
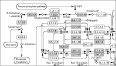
Fig. 6. A map of pyrimidine metabolism in Plasmodium falciparum. Those EC numbers present in the P. falciparum genome annotation are shown shaded. Screenshot from the Kyoto Encyclopedia of Genes and Genomes (KEGG, http://www.genome.ad.jp/kegg/kegg2.html/).
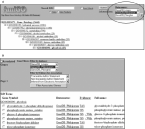
Fig. 7. Querying Gene Ontology annotations using AmiGO. Searches can be filtered to select a specific organism (A). Clicking on a term, takes the user to a results page (B), showing all the genes annotated to the GO term and links to GeneDB.
 You have
Access
- 5
- Cited by