INTRODUCTION
Radiocarbon (14C) calibration as the backbone of 14C dating is constantly evolving, driven by an improved understanding of the carbon cycle and by adding new 14C data to the calibration dataset used to generate the IntCal curve. Technical developments such as accelerator mass spectrometry (AMS) have enabled the 14C community to generate more 14C data with a higher time resolution and also to reproduce sections of the calibration curve with better statistical coverage (multiple data series covering the same period of time, measured in different laboratories on the same or different samples).
This manuscript portrays such an example. The time period around 1600–1500 BCE where the major volcanic eruption of Thera (Sigurdsson et al. Reference Sigurdsson, Carey, Alexandri, Vougioukalakis, Croff, Roman, Sakellariou, Anagnostou, Rousakis and Ioakim2006)—also known as Santorini—took place was and is under constant focus due to the fact that archaeological evidence of the exact timing of the event is at odds with 14C dates (Aitken et al. Reference Aitken, Michael and Betancourt1988; Bronk Ramsey et al. Reference Bronk Ramsey, Manning and Galimberti2004; Friedrich et al. Reference Friedrich, Kromer, Friedrich, Heinemeier, Pfeiffer and Talamo2006; Kutschera et al. Reference Kutschera, Bietak, Wild, Ramsey, Dee, Golser, Kopetzky, Stadler, Steier and Thanheiser2012; Manning et al. Reference Manning, Höflmayer, Moeller, Dee, Ramsey, Fleitmann, Higham, Kutschera and Wild2014; Constantinidis Reference Constantinidis2016). The eruption presents an important time marker for the synchronization of various archaeological chronologies across the Eastern Mediterranean region (Aegean and east Mediterranean) and paleoclimate archives (e.g. ice cores, speleothems). Thus, accurate dating of the event is crucial. One possible explanation is a slight inaccuracy of the calibration curve covering that period of time. A recently analyzed 14C dataset measured on tree rings of Irish oak and bristlecone pine (Pearson et al. Reference Pearson, Brewer, Brown, Heaton, Hodgins, Jull, Lange and Salzer2018) has demonstrated differences to the latest calibration curve IntCal13 (Reimer et al. Reference Reimer, Bard, Bayliss, Beck, Blackwell, Ramsey, Buck, Cheng, Edwards and Friedrich2013). Those new data when used to recalibrate previously dated materials could arguably resolve the discrepancies between archaeological and 14C evidence.
Therefore, the question arose whether or not the new data set does indeed provide evidence that the current IntCal calibration data might not fully represent the carbon cycle during that period of time.
The 14C laboratory at the Curt-Engelhorn-Center Archaeometry (CEZA, sample identifier MAMS) in Mannheim has analyzed tree-ring samples with annual resolution spanning 1625–1510 BCE on a German oak tree (Quercus spec.) providing the means for a direct comparison with the annual bristlecone-pine data across the critical plateau period. A subset of samples between 1625 and 1585 BCE was measured in 3 other laboratories—radiocarbon laboratories at ETH Zurich (sample identifier ETH), Aarhus University (sample identifier AAR), and University of Arizona (sample identifier AA)—in order to intensively cross-check the results, uncover possible laboratory offsets and provide a high level of certainty to have technically accurate results. Besides ensuring high-quality results, running a large number of replicates in different laboratories also replicates that section of the calibration data with high resolution. Consequently, multiple datasets were generated for better statistical coverage. This paper will present the outcome of these new analyses of calibration data for the period 1625–1510 BCE.
METHODS
Tree Location and Dendrochronology
Logs of oak trees (Quercus spec.) were recovered from a surface-mining gravel-pit near the town Knetzgau, Germany (latitude 49.998757N, longitude 10.565708E). The tree labeled as KNET40 was dated dendrochronologically. The sample was compared as raw data against the local chronology (“Main_11”). The software TSAPWin Professional (version 4.80f) was used for cross-dating operations. Those positions that produced results above a given threshold (TBP> 5) were taken into consideration. For every position, t-values and Gleichläufigkeits-percentages were noted. The date has been determined by checking the synchronous positions both statistically and visually.
Sample Preparation and 14C Measurements
Wood from the tree KNET40 was sampled at the Hohenheim Dendrochonology Laboratory where the tree is archived. The full tree-ring material was used rather than just the late wood. Samples covering the time period 1625–1510 BCE were sent to the 14C laboratory MAMS at CEZA in Mannheim. A subset of material between 1625 and 1585 BCE was split into 4 sub samples which were in addition to MAMS sent to the 14C laboratories ETH, AA, and AAR.
The following sample preparation and measurement procedures were applied:
CEZA (MAMS): CEZA has prepared and analyzed 115 single tree-rings. Holo-cellulose from the wood samples was extracted by applying a BABA-bleaching method: (1) soaking in NaOH 4% at 60°C overnight, (2) HCl 4% at 60°C for 30 min, (3) NaOH 4% at 60°C for 30 min, (4) NaClO2 (solution set to pH3 by adding HCl) at 60°C for 1 hr. Between all steps the sample material was rinsed with Milli-Q-H2O. Step (4) was repeated until cellulose turned white. Finally, the samples were dried at 60°C overnight. Typical extraction yields were between 30% and 50% with cellulose weights between 50 and 90 mg.
The cellulose was combusted (3–4 mg) using an elemental analyzer (vario MICROcube, Elementar) and the CO2 was catalytically reduced to graphite either in a custom-made graphitization system (Kromer et al. Reference Kromer, Lindauer, Synal and Wacker2013) or a commercially available system (AGE3) manufactured by IonPlus (Němec et al. Reference Němec, Wacker and Gäggeler2010). Graphite was pressed into aluminum sample targets and analyzed by a MICADAS type AMS (MIni CArbon DAting System, IonPlus AG; Synal et al. Reference Synal, Stocker and Suter2007; Wacker et al. Reference Wacker, Bonani, Friedrich, Hajdas, Kromer, Němec, Ruff, Suter, Synal and Vockenhuber2010a) at CEZA (Kromer et al. Reference Kromer, Lindauer, Synal and Wacker2013).
Oxalic Acid II (NIST SRM 4990C) and Phthalic anhydride C8H4O3 (Sigma-Aldrich, PN320064) were used for standardization and blank determination, respectively. Several other reference materials including wood blanks were analyzed. Data were evaluated using the software package BATS 4.15 (Wacker et al. Reference Wacker, Christl and Synal2010b). Errors of standards and blanks were fully propagated. A current and isobar correction was applied. An additional uncertainty of 1‰ (sample scatter) was added to the uncertainty of each result accounting for non-analytical errors.
ETH Zürich (ETH): The ETH laboratory has prepared and analyzed 41 samples. The wood samples were converted to cellulose with the BABAB treatment (Němec et al. Reference Němec, Wacker and Gäggeler2010) and subsequently converted to graphite with the automated graphitization system AGE3 (Ionplus AG, Switzerland (Wacker et al. Reference Wacker, Němec and Bourquin2010c)). The samples were then analyzed with a MICADAS type AMS (Wacker et al. Reference Wacker, Bonani, Friedrich, Hajdas, Kromer, Němec, Ruff, Suter, Synal and Vockenhuber2010a). Oxalic Acid II (NIST SRM 4990C) and Oxalic Acid I (NIST SRM 4990B) were together used for standard normalization. Data were evaluated using the software package BATS 4.3 (Wacker et al. Reference Wacker, Christl and Synal2010b). An uncertainty of 1‰ was attributed to the sample preparation in addition to the measurement uncertainty to yield a total error of 1.7‰ for single measurements.
Aarhus University (AAR): The Aarhus laboratory has prepared and analyzed 36 samples. α-cellulose was extracted from all wood samples using a combined method of Loader et al. (Reference Loader, Robertson, Barker, Switsur and Waterhouse1997) and Southon and Magana (Reference Southon and Magana2010). The wood samples were first bleached at 70°C with 1M sodium chlorite (NaClO2) acidified with 1M hydrochloric acid (HCl), then treated at room temperature with 17% sodium hydroxide (NaOH) to dissolve hemicellulose. Lastly, they were treated with 1M hydrochloric acid at room temperature to remove any contamination from atmospheric CO2. Subsequently, the α-cellulose was sealed in glass tubes containing copper oxide (CuO) and combusted to CO2 at 900°C cryogenically purified, and then reduced to graphite using hydrogen and iron as catalyst. All samples were analyzed using the 1MV High Voltage Engineering accelerator mass-spectrometer system at the Aarhus AMS Centre (AARAMS), Aarhus University, Denmark (Olsen et al. Reference Olsen, Tikhomirov, Grosen, Heinemeier and Klein2017).
University of Arizona (AA): AA prepared and analyzed 11 single tree-rings. Holo-cellulose from the wood samples was extracted by first reducing the wood chip size to sub-millimeter thick slices of wood with large surface areas and short diffusion distances in order to facilitate the extraction process. Samples were processed one at a time following standard 1N HCl/NaOH/HCl extraction protocols at 70ºC. A bleaching solution (also 70ºC) of NaClO2, HCl and H2O was then used to reduce the remainder of the sample to pure white holo-cellulose. This was then combusted to CO2 and converted to graphite using procedures outlined in Jull et al. (Reference Jull, Burr, Beck, Hodgins, Biddulph, McHargue and Lange2008) and measured with a National Electrostatics Corporation AMS system operated at a terminal voltage of 2.5 MV (Donahue et al. Reference Donahue, Beck, Biddulph, Burr, Courtney, Damon, Hatheway, Hewitt, Jull, Lange and Lifton1997). The 14C/13C ratio of each sample was compared to standard materials Oxalic Acid I and Oxalic Acid II (NIST SRM 4990B and 4990C). The resulting fractionation was corrected to a δ13C value measured offline on a stable isotope mass spectrometer. Calculations of the fraction of modern carbon and Δ14C can be found in Jull and Burr (Reference Jull, Burr, Rink and Thompson2014).
Offset Calculation
In order to calculate offsets of the 14C ages between the individual datasets of the participating laboratories to each other and to IntCal13, pooled means (error-weighted average offsets) and their pooled uncertainties were used (Ward and Wilson Reference Ward and Wilson1978). There a positive number denotes an older MAMS 14C-age compared to another laboratory or to IntCal13. When comparing the MAMS data to IntCal13 a single-year interpolation (generated by the software OxCal; Bronk Ramsey Reference Bronk Ramsey2009) of IntCal13 was used for the relevant date ranges.
RESULTS AND DISCUSSION
Dendrochronology
The dendro-dated section of the oak tree KNET40 produced good cross-dating results including tBP-values of 15.4 (Glk%=74, THO=14.6).
Quality Control
CEZA (MAMS): 18 Phthalic Anhydride blanks were analyzed together with the sample material averaging to F14C = 0.0022 ± 0.0004. Wood blanks ManuKau Kauri (Hogg et al. Reference Hogg, Fifield, Palmer, Turney and Galbraith2007) from New Zealand were analyzed together with the samples with a slightly elevated average of F14C = 0.0032 ± 0.0004 (4 analyses). Other quality control standards such as IAEA C6 show good agreement to the reference value of F14C = 1.5016 (Xu et al. Reference Xu, Khosh, Druffel-Rodriguez, Trumbore and Southon2010) with F14C = 1.4960 ± 0.0033.
ETH Zürich (ETH): 3 ManuKau Kauri blanks (Hogg et al. Reference Hogg, Fifield, Palmer, Turney and Galbraith2007) and 4 lignite blanks from Reichwalde (Sookdeo et al. Reference Sookdeo, Kromer, Büntgen, Friedrich, Friedrich, Helle, Pauly, Nievergelt, Reinig, Treydte, Synal and Wacker2019) processed to cellulose together with the samples yielded an average of F14C of 0.0020 ± 0.0002 and were used for blank correction. Four reference samples (pine tree-ring from 1515 AD) yielded a 14C age of 336 ± 6 yr (ref. 344 ± 1, L. Wacker et al., personal communication).
Aarhus University (AAR): 8 wood blanks ManuKau Kauri (Hogg et al. Reference Hogg, Fifield, Palmer, Turney and Galbraith2007) from New Zealand were analyzed together with the samples yielding an F14C average of 0.0023 ± 0.0001. Further IAEA-C3 (n = 3), IAEA-C8 (n = 2) and TIRI B (n = 2) was analyzed and yielded F14C values of 1.2960 ± 0.0014, 0.1513 ± 0.0008 and 0.5693 ± 0.0012 respectively. Compared with the nominal reference values of 1.2941 ± 0.0006 (IAEA-C3), 0.1503 ± 0.0017 (IAEA-C8), 0.5705 ± 0.0213 (TIRI B), all 3 reference standards are in statistical agreement.
University of Arizona (AA): 8 Rio Frio Ash (naturally occurring charcoal) blanks were analyzed with the samples. The average F14C was 0.0023. The 2018 yearly wt. mean for blanks was F14C = 0.0024.
14C Data
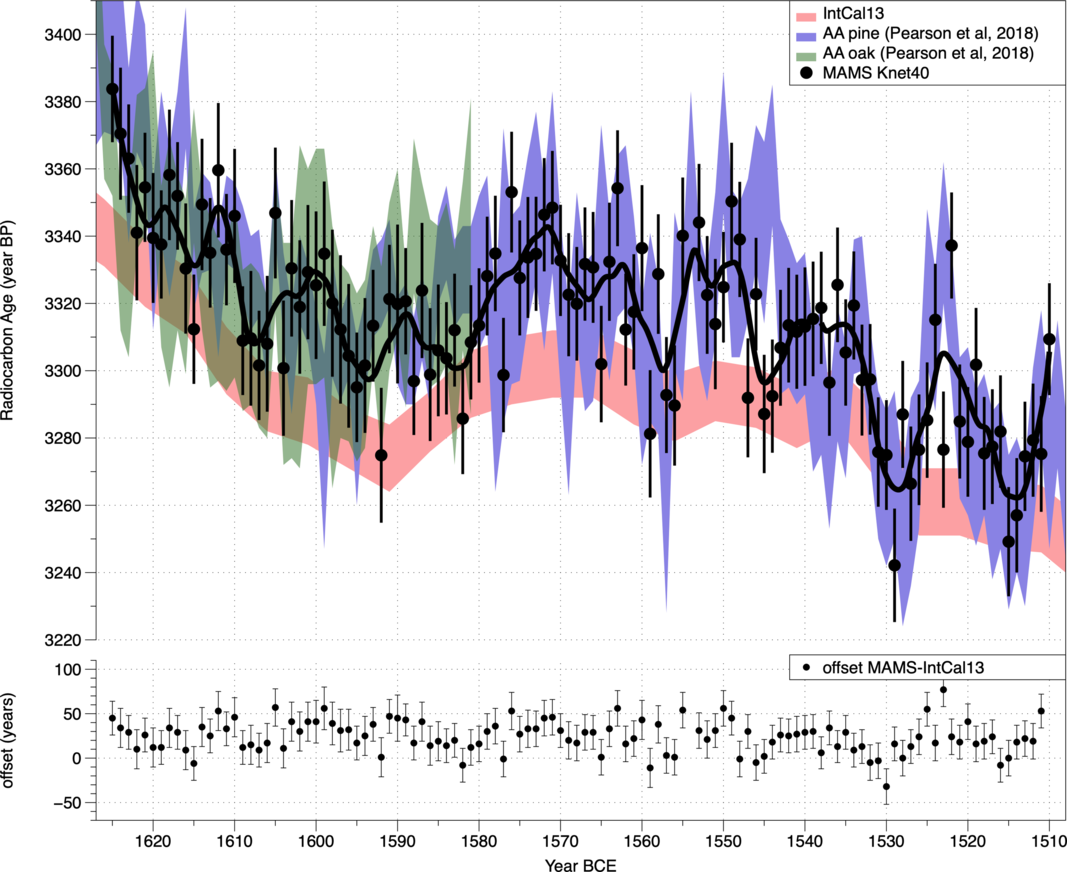
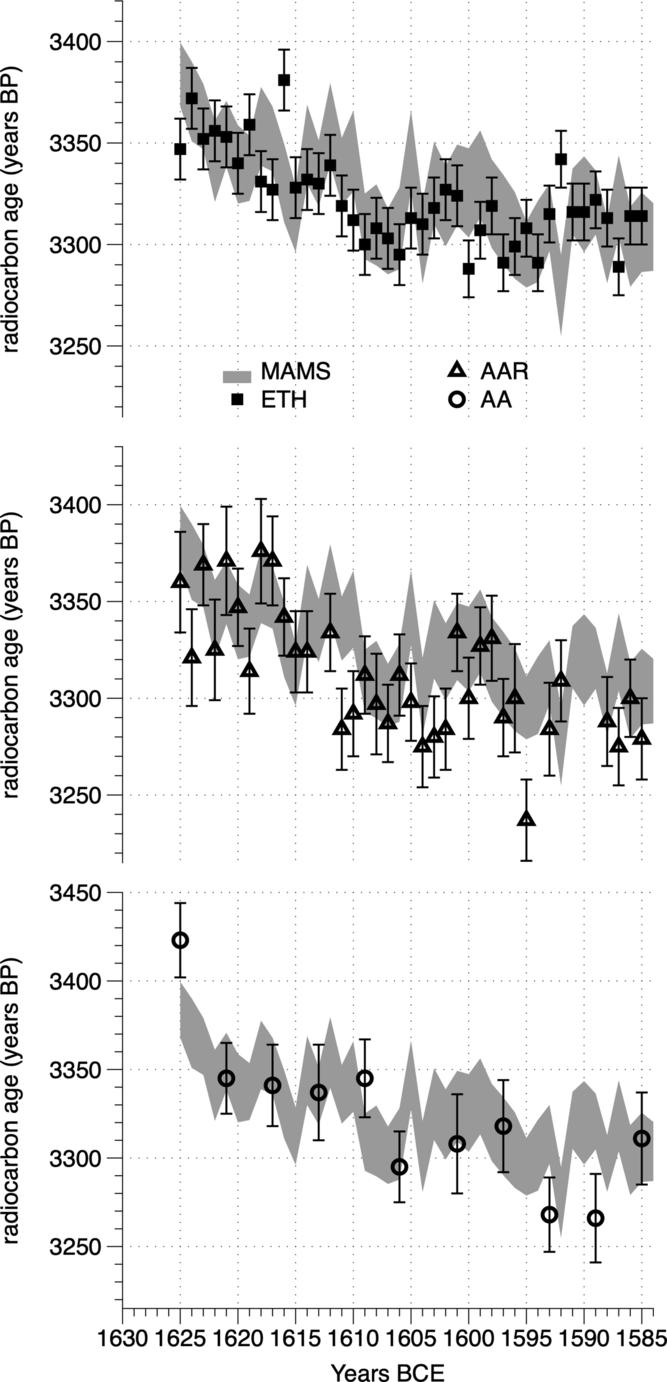
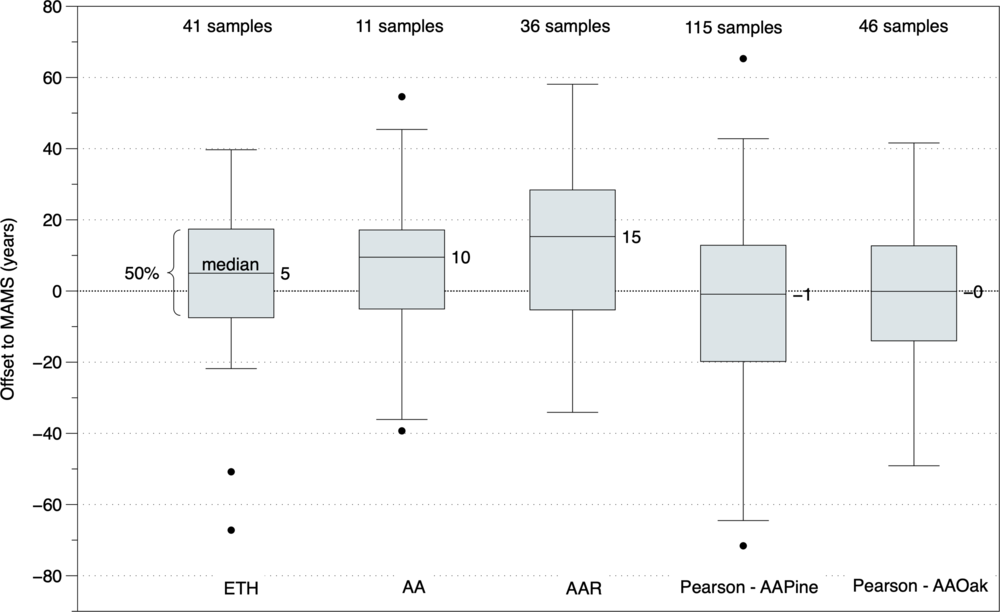
Figure 1 shows the 14C results of the MAMS data as conventional 14C ages compared to the data published before (Pearson et al. Reference Pearson, Brewer, Brown, Heaton, Hodgins, Jull, Lange and Salzer2018) and to IntCal13. Figure 2 shows the results of all 14C laboratories compared to MAMS. MAMS data are shown as gray bands that represent a linear interpolation of the 1-sigma uncertainty ranges of the 14C ages. The calculated offsets between the samples of the same date of each dataset to MAMS are shown in Figure 3. All 14C data can be found in the supplementary material.
Upper panel: single tree-rings analyzed at MAMS (black markers) compared to IntCal13 (red band). Blue and green bands represent the 1-sigma ranges of the pine and oak data measured and published before (Pearson et al. Reference Pearson, Brewer, Brown, Heaton, Hodgins, Jull, Lange and Salzer2018). Lower panel: offset (MAMS minus IntCal13) between MAMS and IntCal13 (annually interpolated). (Please see electronic version for color figures.)

14C results of the duplicate samples measured at CEZA (gray band) compared to ETH (top panel), AAR (middle panel) and AA (bottom panel).

Boxplot of offsets between MAMS and the comparing labs ETH, AAR, AA and the data published by Pearson et al. (Reference Pearson, Brewer, Brown, Heaton, Hodgins, Jull, Lange and Salzer2018) of the pine and oak data. Horizontal line inside the boxes: median offsets to MAMS (calculated as MAMS minus comparison lab); bottom line of the boxes: first quartile, top line of the boxes: third quartile; black dots: outliers that are outside of 1.5 time IRQ (Inner Quartile Range = difference between first and third quartile); error bars around the boxes: minimum and maximum differences that are not outliers.

Inter-Comparison Results
A subset of samples 1625–1585 BCE measured at MAMS were split and analyzed in 3 other 14C laboratories (ETH, AAR, AA) in addition to MAMS in order to investigate the presence of laboratory offsets. The results between MAMS and the partner laboratories show offsets to MAMS (MAMS minus other laboratories) of ETH: 4 ± 4, AAR: 16 ± 5 and AA: 5 ± 10 yr. Median values as shown in Figure 3 are 5, 15 and 9.5 yr. The results from MAMS agree well with the other laboratories with the exception of AAR where MAMS shows a larger offset (see Figure 2).
Comparison to IntCal
A general offset between MAMS and IntCal13 of 24 ± 2 yr is present as shown in the lower panel of Figure 1. The overall trends of the new dataset and IntCal13 are, however, very similar. They show maxima around 1570 and 1620 BCE as well as minima around 1590, 1555 and 1533 BCE. The new dataset being at a high resolution naturally has a much higher frequency structure compared to IntCal, i.e. the 11-yr solar cycle is observable in the new dataset.
Comparison to Previously Published Data
The new data series between 1625 and 1510 BCE on German oak agrees well with the data reported before in Pearson et al. (Reference Pearson, Brewer, Brown, Heaton, Hodgins, Jull, Lange and Salzer2018). Over the whole period an offset of –5 ± 3 for their bristlecone pine (AA-pine) data is observed. Comparing data from German oak with Irish oak (AA-oak) data is only possible over a period between 1625 and 1585 BCE showing an offset of –1 ± 5. Median offsets are –1 and 0 years, respectively (see Figure 3). Those high levels of agreement exist despite the fact that the MAMS 14C data (as well as for ETH, AA and AAR) were analyzed from whole-wood contrary to the previously published oak data which were from the late wood only. Analyzing late wood only would prevent shifted 14C ages due to the carry-over of 14C from the previous year stored in the early wood (Pilcher Reference Pilcher1995). This factor does not affect the results significantly in the case presented here. The width of the tree rings was generally large so that the amount of late wood was much larger compared to the early wood, thus, suppressing the carry-over effect.
It should be noted, however, that the new MAMS record deviates from the AA-pine data in a small date range around 1582 and 1545 BCE for the AA-pine data. For the data around 1545 BCE we can only compare AA-pine to MAMS-oak (although see Pearson et al. Reference Pearson, Wacker, Bayliss, Brown, Salzer, Brewer, Bollhalder, Boswijk and Hodgins2020 in this issue for Irish oak measured at ETH across this same period). Around 1582 BCE where MAMS-oak, AA-oak and AA-pine can be compared the MAMS data shows a better fit to the AA-oak than the AA-pine.
Consequence for Dating Thera Eruption
Pearson et al. (Reference Pearson, Brewer, Brown, Heaton, Hodgins, Jull, Lange and Salzer2018) tested the possible effects for calibration of Thera relevant 14C data sets using a calibration curve based on their annual data. Such an adjustment could significantly affect the calibrated dates of previously dated materials because of the presence of a plateau-like section in the calibration curve. Confirming the height and shape of the plateau and defining the transition at either end is critical to establishing the possible dating range for materials relevant to dating Thera. The fact that our data sets agree closely with those of Pearson et al. (Reference Pearson, Brewer, Brown, Heaton, Hodgins, Jull, Lange and Salzer2018) means that Thera context materials are likely to have increased probabilities for calibration in the 16th century BCE making it possible for radiocarbon dates to be compatible with those dates proposed based on various lines of archaeological evidence within this wider range. The general agreement with Pearson et al. (Reference Pearson, Brewer, Brown, Heaton, Hodgins, Jull, Lange and Salzer2018) illustrates how well annual data based on three different tree-ring chronologies processed at different laboratories can be replicated. On the other hand differences around 1545 BCE between the new dataset and the one by Pearson et al. (Reference Pearson, Brewer, Brown, Heaton, Hodgins, Jull, Lange and Salzer2018) illustrate the importance of large scale replication of annual 14C datasets in order to arrive at the best representation of past 14C as a basis for calibration.
CONCLUSION
The MAMS, ETH, AAR and AA data presented here confirm the general accuracy of the data in Pearson et al. (Reference Pearson, Brewer, Brown, Heaton, Hodgins, Jull, Lange and Salzer2018). When incorporated into the calibration data IntCal, those datasets would alter the interpretation of 14C-dated samples significantly closing the gap to archaeologically based evidence for the Thera eruption. This comparison study furthermore shows first, that results from different 14C laboratories employing their specific sample pretreatment protocols and AMS systems can be compatible. Second, the importance of adding more highly resolved records to the radiocarbon calibration data with high replication is more and more pressing since aspirations to use IntCal for high accuracy and precision dating is ever increasing.
ACKNOWLEDGMENTS
We thank Greg Hodgins, Todd Lange, Rich Cruz and Jessica Nordby for preparation and analysis of the oak samples at the University of Arizona AMS Laboratory. Analyses at AA were funded by the Malcolm H. Wiener Foundation.
SUPPLEMENTARY MATERIAL
To view supplementary material for this article, please visit https://doi.org/10.1017/RDC.2020.33