





Introduction
Non-communicable diseases (NCDs) are the leading cause of mortality worldwide, accounting for 41 million deaths annually, or 74 % of all deaths, with over 77 % of these occurring in low- and middle-income countries (LMIC)(1). Rapid urbanisation, industrialisation and lifestyle changes in LMIC have contributed to a nutritional transition from traditional diets towards energy-dense, nutrient-poor foods, fueling rising rates of obesity, diabetes and CVD(Reference Masters, Finaret and Block2). In many LMIC settings, this transition occurs within hybrid food systems where formal retail outlets coexist, creating complex food retail environments that differ from those typically observed in high-income countries.
The food retail environment is a key determinant of dietary behaviours, encompassing the availability, accessibility, cost, quality and promotion of foods(Reference Turner, Kalamatianou and Drewnowski3). Food environments are commonly conceptualised as comprising both community and consumer domains. Community food environments refer to the availability, density and spatial distribution of food outlets, while consumer food environments include affordability, quality, pricing, marketing and promotion within food outlets. Examining food retail environments across neighbourhoods with differing socio-economic conditions helps illuminate deprivation-related spatial inequities that shape dietary opportunities and health outcomes, including the food insecurity–obesity paradox, where communities facing high access to poor nutritional quality and highly processed foods simultaneously experience high rates of overweight and obesity(Reference Dhurandhar4). In 2023, approximately 68 % of women and 38 % of men in South Africa were overweight or obese(Reference Simelane, Mutanga and Hongoro5), with urban township residents at greater risk than their rural counterparts: men were 2·3 and 3·1 times and women 1·6 times (for both) more likely to report overweight or obesity, respectively(Reference Okop, Levitt and Puoane6). These high rates of overweight and obesity, particularly among urban township residents, highlight the public health importance of understanding how local food retail environments may shape dietary behaviours and health outcomes. In particular, Soweto, South Africa’s largest township – historically under-resourced urban residential areas established under apartheid-era policies, often characterised by high population density, limited services and socio-economic disadvantage – exemplifies this paradox, with the burden of overweight and obesity is increasing, particularly among women(Reference Ramsay, Crowther and Agongo7). Residents typically purchase food from a mix of formal supermarkets, small convenience stores, informal vendors and takeaway outlets(Reference Rudolph, Kroll and Muchesa8), where outlet type, spatial accessibility and transport options may influence dietary behaviour in this setting.
Food insecurity, defined as limited access to adequate, nutritious food, exacerbates these challenges(Reference Dhurandhar4). For households with constrained resources, cheaper, calorie-dense foods such as fried takeaways are often the most accessible and filling options, contributing to increased NCD risk(Reference Feeley, Kahn and Twine9). Conditions once associated with affluence, such as diabetes and CVD, are now increasingly linked to poverty, insecurity and disadvantaged living conditions(Reference Manderson and Jewett10). South Africa’s high levels of inequality(11) are evident within Soweto(12), where wealth and deprivation often exist side by side. The township’s food retail environment is characterised by affordability yet limited dietary diversity(Reference Mukoma, Bosire and Klingberg13), highlighting the importance of understanding local retail structures as potential drivers of health inequities.
Understanding the characteristics of Soweto’s food retail environment is an essential first step in linking structural food access with dietary behaviours. Despite increasing recognition of food retail environments as structural determinants of diet and health, there remains limited evidence describing township food environments in African settings using standardised assessment tools. This study therefore aimed to describe the Soweto food retail environment and examine the availability, quality, pricing and promotion of food items across areas of higher- and lower- deprivation. By applying an adapted Environmental Profile of a Community’s Health (EPOCH) framework, this study provides a systematic assessment of food retail environments in a rapidly urbanising township setting.
Methods
Study design and setting
We conducted a cross-sectional study involving in-person field audits of the food environment using the EPOCH tool in the township of Soweto, South Africa, from August to October 2022.
Soweto, a densely populated and predominantly low-income urban township in Johannesburg, is historically shaped by spatial segregation and deprivation. Characterised by high-density housing and inadequate urban planning, it continues to face rapid population growth while many residents experience persistent barriers to achieving basic health outcomes due to limited access to healthcare(Reference Grant14,Reference Van Rensburg15) .
Sampling of the study areas
The geographical sampling strategy for this study was informed by a previous large-scale study that surveyed eight randomly selected communities in Soweto(Reference Prioreschi, Ware and Draper16). Building on this approach, the current study focused on four small areas representing different levels of deprivation within Soweto. Chiawelo and Orlando East were classified as higher-deprivation areas (lower socio-economic status), while Protea Glen and Diepmeadow were classified as lower-deprivation areas (higher socio-economic status). We purposively selected these four study wards (Chiawelo (Ward 12), Diepmeadow (Ward 13), Protea Glen (Ward 14) and Orlando East (Ward 31)) within Soweto to capture socioeconomic heterogeneity. Area-level deprivation was operationalised using a South African small-area deprivation framework aligned with the South African Index of Multiple Deprivation (SAIMD 2011)(Reference Noble, Zembe and Wright17), which characterises ward-level deprivation across material, employment, education and living-environment domains based on Census 2011 indicators. Wards were categorised as relatively higher or lower deprivation using ward-level Census 2011 measures of: (i) household income distribution; (ii) unemployment and economic activity; (iii) dwelling type (including informal housing); and (iv) access to basic household services (water, sanitation, electricity and refuse removal).
Subsequently, routes with a median distance of 503 m (range 445–682 m) were mapped to cover 25 % of the total street network within each small area following McMillan et al. (2010) strategy(Reference McMillan, Cubbin and Parmenter18), meaning that areas with larger networks contributed more routes but a similar proportion of streets was sampled in each area, to represent the residential food environment. Routes were created by (i) selecting residential buildings from the Open Buildings dataset(Reference Noble, Zembe and Wright17) as starting points; (ii) identifying points of interest as destinations using local knowledge and OpenStreetMap(20) and (iii) randomly choosing a route between these points along the street network. A detailed description of the process can be found in the supplementary material 1.
The average size of these areas was 7·8 km2, with Orlando East being the smallest and Protea Glen the largest (Figure 1). The combined population of the study areas was approximately 370 000, with a population density of around 56 000 people per km2. Overall, Soweto has a population of 1 695 047, with 48 % middle-aged adults (30–60 yrs) and 24 % elderly individuals (over 60yrs). The township is predominantly inhabited by Black South Africans(12).
Spatial distribution of area-level deprivation across areas in Soweto, Johannesburg, South Africa.

Figure 1. Long description
Spatial distribution of area-level deprivation across the 48 study areas in Soweto, Johannesburg, South Africa. The figure illustrates the spatial variation in neighbourhood deprivation across Soweto, providing the geographic context for the study population
Food environment
The EPOCH instrument is a validated tool that has demonstrated high inter-rater reliability in both rural and urban communities across various settings including Canada, Colombia, Brazil, China and India(Reference Chow, Lock and Madhavan21,Reference Swinburn, Sacks and Hall22) . The food retail outlets assessed by the study included both formal and informal establishments where food, beverages and fresh produce are sold. In Soweto, formal retail outlets include supermarkets, convenience stores and spaza shops, which sell a broader category of food/grocery items. The informal food outlets were predominantly street vendors selling fruits and vegetables. Food service outlets such as restaurants and alcohol specialty stores, alongside specialty retailers including butcheries, bakeries and delicatessens, were also included in the assessment. The EPOCH tool consists of two components:
-
• EPOCH 1 – used by trained data collectors to systematically record features of the physical environment, including (i) community characteristics; (ii) community observation walks (i.e. a record of food outlets (formal, specialty, food service and informal), advertisements for alcohol, sugar-sweetened beverages (SSB) and snacks and sidewalk quality. Route distances were similar across deprivation levels; (iii) tobacco retail outlet assessment; (iv) grocery store assessment (i.e. a record of fruits and vegetables sold in retail outlets, including produce quality, pricing, branding and advertising and documenting till-point advertisements for sugar-sweetened beverages and packaged snacks) and (v) local restaurant assessment (i.e. healthy menu options, including approaching restaurant owners along the route to obtain permission for assessment, and evaluating the menu for the availability of main salad or vegetable dishes and buffet/meal portion options (note: portion data were not included in this manuscript)).
-
• EPOCH 2 – measures how people experience and interpret their community environment, rather than what is physically present in it.
For this study, only the EPOCH 1 objective audit tool was used. To provide a comprehensive overview of the food environment, audits were conducted on formal food outlets, informal vendors and other local food sources within the selected areas. The EPOCH tool was slightly modified for the local Soweto context to improve applicability without changing its core meaning (supplementary material 2). Data collection examined the availability, accessibility and types of foods offered, as well as the presence of nutrition-related marketing and signage. A total of 241 routes were audited (n 153 in lower-deprivation areas; n 88 in higher-deprivation areas). As the focus was on environmental audits, no individual participants were recruited.
Data collection
Data were collected by researchers with public health backgrounds and familiarity with the Soweto context, facilitating understanding of the tool and accurate interpretation of environmental features(Reference Godongwana, Gama and Maluleke23). Before data collection, researchers completed a week-long training workshop using the EPOCH training manual (supplementary material 1), where we reviewed and agreed on the definitions for the environmental features. Standard operating procedures were implemented for managing potential disruptions and ensuring continuity of operations. The tool was also piloted to ensure researchers were confident in its application. Data collection was conducted using the REDCAP mobile app.
As indicated in the training manual, data collectors identified retail outlets based on signage displayed at the premises, their local knowledge of the area and observable characteristics typical of informal outlets. Additionally, the study involved environmental observation of retail outlets and streetscapes, without recruiting participants or collecting personal identifiers. Data were limited to outlet characteristics and publicly observable information. When necessary, brief factual questions were asked of staff on a voluntary basis, and no personal information was recorded.
Ethics
An ethics waiver was received from the University of the Witwatersrand Human Research Ethics Committee (Non-Medical) (HRECNMW22/06/08) as the research study did not collect individual-level data on participants.
Data analysis
For all statistical analyses, Stata® version 18.0 (StataCorp) was used to analyse the data.
Categorical variables, including types and frequencies of food outlets and advertising counts, were presented as frequencies and percentages. Differences across deprivation areas were evaluated using χ 2 tests, with significant results reported as numbers, percentages and P values. Pricing data were visually assessed for normality using histograms, which showed a right-skewed distribution, and was therefore presented as median and interquartile range. We did not apply formal adjustments for multiple testing.
Results
Food availability
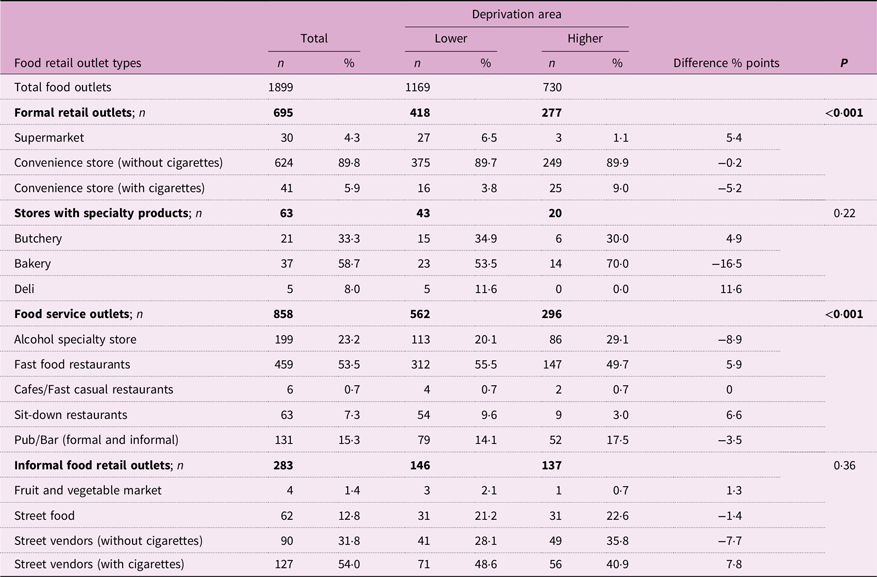
Table 1 presents a comparison of food retail outlets between higher- and lower-deprivation areas. Lower-deprivation areas had significantly more formal retail outlets (p < 0·001) and food service outlets (p < 0·001), whereas the number of specialty stores and informal food outlets did not differ between areas (both p > 0·22). In this setting, formal food retail was largely comprised of small-scale convenience stores (95·7 %) rather than supermarkets (4·3 %). Notably, higher-deprivation areas had very few supermarkets (n 3), compared with twenty-seven in lower-deprivation areas. Similarly, fast-food restaurants were less common in higher-deprivation areas (n 147) compared with in lower-deprivation areas (n 312), highlighting disparities in access to diverse food options.
A comparison of food retail outlets between lower- and higher-deprivation areas

Table 1. Long description
A comparison of food retail outlets between lower and higher-deprivation areas.
n – frequency. Bold values denote statistical significance. Percentages for subtypes are calculated within their parent outlet class. % for subtypes are calculated within their parent outlet class. Difference in % points is calculated as the subtype prevalence in lower-deprivation areas minus the subtype prevalence in higher-deprivation areas.
Quality of produce
Auditors recorded whether more than three kinds of fruits appear to be damaged (bruised, rotten or of poor quality). The assessment of fresh produce quality revealed no significant differences between lower- and higher-deprivation areas. Overall, 5 of 123 (4·1 %) fresh food items were damaged in lower-deprivation areas, compared with 6 of 77 (7·8 %) in higher-deprivation areas (p = 0·42). Damaged fruits and vegetables were similarly distributed across areas, with no statistically significant differences observed (all p > 0·50).
Pricing of grocery items
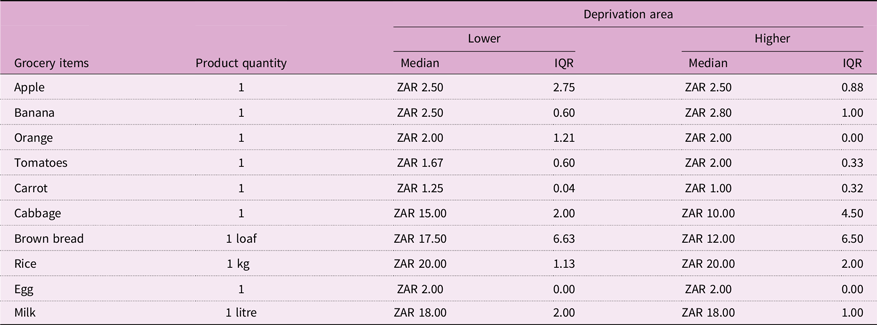
Table 2 presents the median prices of grocery items from 241 retail outlets (153 in lower-deprivation areas and eighty-eight in higher-deprivation areas). Differences in median prices were observed for a few items, with some items costing more in lower-deprivation areas and others costing more in higher-deprivation areas; however, median prices were identical for several items, indicating broadly comparable prices across deprivation groups.
Median pricing (ZAR) of food items per small area

Table 2. Long description
Median pricing (ZAR) of food items per small area.
IQR, interquartile range.
Promotion of unhealthy food and beverages
The advertising of packed snacks, sugar-sweetened beverages and alcohol in the different deprivation areas are presented in Table 3. Lower-deprivation areas had a higher proportion of advertisements for packed snacks and alcohol, whereas higher-deprivation areas showed more advertisements for sugar-sweetened beverages (p < 0·01).
Product promotion (advertisements) of food per small area

Table 3. Long description
Product promotion (advertisements) of food per small area.
n – frequency. Bold values denote statistical significance. Difference in % points is calculated as the subtype prevalence in lower-deprivation areas minus the subtype prevalence in higher-deprivation areas.
Discussion
This study provides a detailed examination of specific components of the food landscape in Soweto, providing descriptive evidence of both community and consumer food environments, and highlights disparities in food availability, pricing and promotional practices across areas of higher and lower deprivation. Our findings reveal a difference in the type of formal retail and food service outlets between deprivation areas, suggesting that residents in higher-deprivation neighbourhoods have less access to more formal supermarkets, with a greater proportion of food service outlets linked to the sale of alcohol. This uneven distribution of food infrastructure may contribute to differences in dietary behaviours and health outcomes across differing socio-economic groups(Reference Nglazi and Ataguba24,Reference Finlay, Robinson and Jones25) . These findings reflect deprivation-related spatial inequities in food outlet distribution within township settings.
Interestingly, advertising practices also differed by area. Although more alcohol specialty stores were reported in higher-deprivation areas, snack food and alcohol advertisements were more concentrated in lower-deprivation areas, reflecting both outlet-based and street-level advertisements, including billboards and storefront branding, suggesting that even in more affluent neighbourhoods residents may still face substantial marketing pressures for unhealthy products(Reference Swinburn, Sacks and Hall22). This finding contrasts with the common perception that higher-deprivation areas are the primary targets for such marketing and underscores the complexity of food promotion dynamics in urban South African settings(Reference Brear, Erzse and Clacherty26,Reference Solomon, Frank and Ng27) . Observed clustering of alcohol advertising may reflect commercial strategies prioritising visibility, zoning regulations and brand marketing approaches rather than targeting low-income populations exclusively. While some studies report greater densities of fast-food outlets in more deprived areas(Reference Maguire, Burgoine and Monsivais28), others find higher concentrations in wealthier neighbourhoods, suggesting that the influence of socio-economic status on food environments may vary across settings(Reference Cummins, McKay and Macintyre29). Socio-economic status appears to shape both the number and type of food outlets, with wealthier areas often offering a wider range of options(Reference Lamichhane, Warren and Puett30), though these patterns may differ across contexts. These findings highlight the importance of considering both the food outlets and exposure to marketing and promotional activities when assessing dietary opportunity structures.
In terms of pricing and produce quality, our results indicate no consistent differences across deprivation levels in Soweto. Although median prices differed for some items, with higher prices observed in both lower- and higher-deprivation areas depending on the product, several items had identical median prices, indicating broadly comparable pricing across deprivation groups. While some items tended to be slightly more expensive in lower-deprivation areas, overall price differences were modest. These results should be interpreted as exploratory and reflect observed price patterns rather than definitive conclusions regarding the affordability of grocery items, as the analyses did not account for household income, purchasing power or food budgets. This aligns with previous research and more recent studies that indicate that food cost and quality disparities are not universal and may be shaped by local market dynamics, such as higher retailer density and competition in lower-deprivation areas(Reference Crawford, Byun and Mitchell31,Reference Ball, Timperio and Crawford32) . Differences in pricing may reflect a combination of factors including varying purchasing power, brand availability and retailer strategies. While some items were marginally more expensive in the lower-deprivation areas, greater competition among stores in lower-deprivation neighbourhoods may thus help maintain lower prices and more consistent produce quality for certain products underscoring the context-specific nature of pricing patterns(Reference Ball, Timperio and Crawford32). These findings underscore the complex and context-specific nature of food environment transitions in urban LMIC settings, where formal and informal retail outlets often coexist and may affect pricing and quality in various ways.
Our findings are consistent with studies that have previously reported using the EPOCH tool in other LMIC urban settings. For example, prior applications of EPOCH have similarly documented disparities in food outlet composition and unhealthy food promotion across differing socio-economic contexts(Reference Spires, Berggreen-Clausen and Kasujja33). Compared with the study by Spires et al., our data provide additional insights into price patterns and marketing density showing that while prices may be higher in the lower-deprivation areas, advertising is not necessarily concentrated in the high-deprivation areas. This may reflect the complexity of commercial strategies in urban food environments, where marketing patterns do not necessarily follow clear socio-economic differences, as confirmed elsewhere(Reference Adams, Ganiti and White34).
This study must be interpreted within its strengths, limitations and recommendations. A key strength of this study is its focus on an urban Sowetan context, providing important insights into public health implications in settings where rapid urbanisation, socio-economic inequality and informal food economies intersect. Soweto’s unique environment – characterised by a mix of formal and informal retail, dense residential areas and diverse socio-economic profiles – highlights how food accessibility and exposure to unhealthy marketing can vary substantially within a single township.
However, the study has several limitations. It included only four out of Soweto’s twenty-seven townships, potentially limiting the generalisability of the findings. Additionally, the close proximity of some townships, such as Diepkloof and Orlando East, may reduce the contrast between deprivation levels. As a cross-sectional study, the findings represent a snapshot of the food environment and should be interpreted as descriptive assessments of the food environment rather than casual determinants of health outcomes. The results were obtained to enable comparison between deprivation areas, not to quantify the amount of food environment features of each small area, thus, the data reflect an overview of the small areas. The study did not include linked dietary intake or health outcome data, preventing direct assessment of how observed disparities in food availability, pricing and advertising translate into nutrition, obesity and NCD risk. There may also be a temporal mismatch between exposure to food environments and health outcomes, given that chronic conditions are influenced by cumulative exposures over time. Finally, although fieldworkers were trained using standardised protocols, the observations of outlets, advertising and product quality may be subject to potential observer bias. Despite these limitations, this study provides valuable descriptive evidence of food environment disparities across areas of differing levels of deprivation in Soweto, South Africa and demonstrate the feasibility of adapting the EPOCH tool in an African township context. Our findings highlight the need for further research to explore the relationship between disparities in food environments and the development of health outcomes following cumulative exposure, including dietary patterns, obesity and NCDs. Future studies should consider expanding to more townships and examining central v. peripheral areas, which would provide a more nuanced understanding of where interventions are most needed to promote dietary diversity and health equity.
To conclude, these findings provide evidence describing structural differences in food environments across differing levels of deprivation in urban Soweto, South Africa. These findings highlight the need to improve access to healthy foods in higher-deprivation areas through expanded retail infrastructure. Healthier options in informal markets may also represent potential areas for public health planning. Strengthening guidance on unhealthy food advertising in lower-deprivation areas could also be considered as part of broader strategies to reduce the promotion and consumption of packaged snacks and alcohol. Overall, lower-deprivation areas had greater access to diverse outlets but more targeted promotion of unhealthy foods, while higher-deprivation areas faced limited availability despite comparable pricing and produce quality. Together, these findings highlight the importance of context-specific interventions, socially equitable approaches to improve local food environments in rapidly urbanising township settings in LMIC.
Supplementary material
For supplementary material accompanying this paper visit https://doi.org/10.1017/S1368980026103176
Authorship
K.G. was responsible for oversight of data collection. K.G. generated tables. K.G. and A.C. interpreted the data, did the literature search and the writing of the paper. All authors interpreted the data and made a significant contribution to the interpretation of the results. All authors were responsible for revising the manuscript and approving the submitted version.
Financial support
This study was funded by the National Institute for Health Research (NIHR) (NIHR133205) using the UK aid from the UK Government to support global health research. The views expressed are those of the authors and not necessarily those of the NIHR or the Department of Health and Social Care.
Competing interests
None to disclose.
Ethical standards
Ethical approval was not required for this study as no human participants were involved. An ethics waiver was obtained from the University of the Witwatersrand Human Research Ethics Committee (HRECNMW22/06/08).




 Open access

