INTRODUCTION
Acute phase response (APR) is the name given to a group of rapid physiological responses occurring soon after the onset of infection or injury, which contribute to the prevention of ongoing tissue damage, to the trapping and destruction of microorganisms, and to activation of the repair processes necessary to restore the host's normal function (Baumann & Gauldie, Reference Baumann and Gauldie1994). APR is characterized by increase in acute phase proteins (APPs) in serum, fever, increased vascular permeability, and metabolic and pathological changes. APPs are commonly considered as plasma proteins primarily synthesized by hepatocytes as part of the acute phase response (for review see Gabay & Kushner, Reference Gabay and Kushner1999; Cray et al., Reference Cray, Zaias and Altman2009). However, accumulating evidences show that local extrahepatic production of APPs also occurs (for reviews see Ceciliani et al., Reference Ceciliani, Ceron, Eckersall and Sauerwein2012). Locally produced APPs probably have a role in counterbalancing proinflammatory effects within the tissue concerned, for example, by promoting tissue remodelling and angiogenesis, and by modulating phagocytosis and reducing oxidative damage. Induction of APPs, best characterized in mammals, is mediated by toll-like receptors (TLRs), which, upon stimulation, result in the production of pro-inflammatory cytokines such as IL-1β and TNF-α (Fey & Gauldie, Reference Fey and Gauldie1990; Pandey & Agrawal, Reference Pandey and Agrawal2006), which are important inducers of APPs (Cohen, Reference Cohen2002).
Acute phase proteins can be classified as positive APPs, if their concentrations increase in serum, or negative APPs, if their concentrations decrease (Petersen et al., Reference Petersen, Nielsen and Heegaard2004). In humans, C-reactive protein (CRP), serum amyloid A (SAA), serum amyloid P (SAP), hepatoglobin (HP), fibrinogen, complement component 3 (C3) and factor B have been shown to be positive APPs, whereas albumin and transferrin have been shown to be negative APPs. Research on APR in several fish species (Bayne & Gerwich, Reference Bayne and Gerwick2001; Russell et al., Reference Russell, Hayes, Simko and Lumsden2006; Magnadottir et al., Reference Magnadottir, Audunsdottir, Bragason, Gisladottir, Jonsson and Gudmundsdottir2011) has revealed that fish express many APPs homologous to human APPs, including CRP (Gisladottir et al., Reference Gisladottir, Gudmundsdottir, Brown, Jonsson and Magnadottir2009), SAP (Lund & Olafsen, Reference Lund and Olafsen1999), SAA (Saranya Revathy et al., Reference Saranya Revathy, Umasuthan, Whang, Lee, Lee, Oh, Jung, Choi, Park, Park and Lee2012), transferrin (Russell et al., Reference Russell, Hayes, Simko and Lumsden2006; Peatman et al., Reference Peatman, Baoprasertkul, Terhune, Xu, Nandi, Kucuktas, Li, Wang, Somridhivej, Dunham and Liu2007), and factor B (Gonzalez et al., Reference Gonzalez, Buchmann and Nielsen2007). Recently, CRP, SAA, HP, leukocyte cell-derived chemotaxin 2 (LECT2) and hepcidin (HAMP) have also been demonstrated as APPs in zebrafish, Danio rerio (Lin et al., Reference Lin, Chen, Cao, Lin, Mo, Zhang, Gu, Dong, Liu and Xu2007; Gonçalves et al., Reference Goncalves, Pascoa, Neves, Coimbra, Vijayan, Rodrigues and Wilson2012; Lü et al., Reference Lü, Hu, Xue, Zhu, Wang and Zhou2012).
The eggs of most fish, including zebrafish, are released and fertilized externally, and the resulting embryos/larvae are, therefore, exposed to a hostile aquatic environment containing numerous pathogens capable of causing various types of diseases (Wang et al., Reference Wang, Zhang, Tong, Li and Wang2009). For example, as early as 1919 Dannevig demonstrated bacterial growth on cod eggs resulting in high mortality (Dannevig, Reference Dannevig1919). The adaptive immune system of zebrafish develops at about 3 weeks of age (Trede et al., Reference Trede, Langenau, Traver and Look2004), suggesting that within the first 3 weeks of development their embryos/larvae solely depend on innate immune defence mechanisms. As an integral part of innate immunity, APR in developing embryos/larvae has not been systematically studied in zebrafish or any other fish, and although C3 and factor B transcripts in zebrafish have been shown to be markedly increased by challenge with LPS soon after hatching (Wang et al., Reference Wang, Zhang and Wang2008), information regarding the expression and role of APPs in developing embryos/larvae is rather limited in teleosts. The aim of this study was thus to investigate the APR in zebrafish embryos/larvae via examining the expression of APP genes encoding CRP, SAA, LECT2, HAMP and HP and APP inducer genes encoding IL-1β and TNF-α.
MATERIALS AND METHODS
Fish, embryos and larvae
Zebrafish D. rerio aged about 5 months were purchased from a local fish dealer and maintained in well-aerated tap water at 26 ± 1oC. Sexually mature D. rerio were placed together in the late evening at a female to male ratio of 2:1, and the naturally fertilized eggs were collected early the next morning, transferred to Holtfreter solution (MgSO4·7H2O 0.163 mg/ml, KCl 0.03 mg/ml, NaCl 1 mg/ml, CaCl2 0.04 mg/ml) and cultured in a temperature–humidity incubator (CIMO, Shanghai, China) at 26 ± 1°C at a humidity of 70%. In some cases, embryos/larvae were raised in Holtfreter solution containing 0.03 mg/ml PTU (1-phenyl-2-thiourea, Sigma) to prevent pigment formation for observation of the signals of whole-mount in situ hybridization. Developmental stages were recorded as hours or days post-fertilization (hpf or dpf).
Microinjection of LPS
To determine the effects of different doses of LPS on development, zebrafish embryos/larvae were each microinjected at 10, 15, and 24 hpf with 6 nl of PBS containing 0 (control), 6 × 10⁻⁴, 6 × 10⁻³, 6 × 10⁻² and 6 × 10⁻¹ ng of LPS from Escherichia coli (Sigma, USA) in the yolk sac. Development was observed at an interval of 12 h after injection, dead embryos/larvae were recorded, and 48 h cumulative mortality was calculated.
Quantitative real-time PCR (qRT-PCR)
Zebrafish embryos/larvae were each injected at 10, 15 and 24 hpf in the yolk sac with 6 nl of PBS containing 6 × 10⁻³ ng (see below) of LPS (infected group), or PBS alone (control group), and cultured in a temperature–humidity incubator. A total of 30 larvae were sampled each time at 2, 4, 16 and 24 h after LPS injection, respectively. The sampled larvae were homogenized in Trizol (TakaRa), and the total RNA was extracted using RNAiso Plus (TakaRa). Following DNAse I digestion for 30 min to remove any contamination of genomic DNA, the cDNA was synthesized directly from the extracted RNA using oligo (dT) primer with a reverse transcription system (2.5 μM oligo dT primer, 60 ng total RNAs, 0.5 mM dNTPs, 2 μl 5 × RT buffer, 12.5 U ribonuclease inhibitor, and 12 U EasyScript RT RNase H-M-MLV in 10 μl volume). The reaction conditions were at 70°C for 10 min, 42°C for 50 min and then 75°C for 15 min.
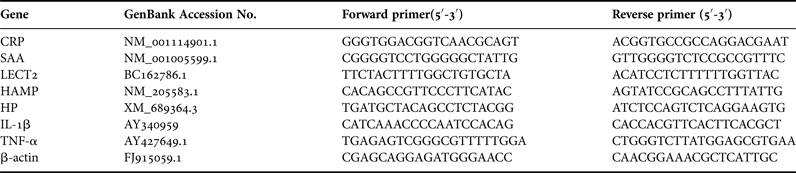
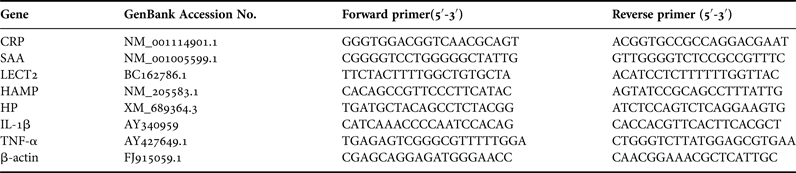
For qRT-PCR, seven primer sets specific for CRP, SAA, LECT2, HAMP, HP, IL-1β and TNF-α genes were designed using the Primer 5 program based on the sequences deposited in GenBank (accession numbers and primer sequences are listed in Table 1). The β-actin gene was therefore selected as a reference (Livak & Schmittgen, Reference Livak and Schmittgen2001) to standardize the results by eliminating variations in mRNA and cDNA quantity and quality. qRT-PCR was performed using an ABI 7500 real-time PCR system (Applied Biosystems). SYBR-Premix ExTaq (TaKaRa) was used with a primer concentration of 200 nM. Reaction conditions were at 95°C for 10 s, followed by 40 cycles of 95°C for 5 s, 60°C for 20 s and 72°C for 34 s. Dissociation analysis was performed at the end of each PCR reaction to confirm the amplification specificity. After the PCR program, data were analysed with ABI 7500 SDS software (Applied Biosystems), and quantified with the comparative Ct method (2−(△△ct)) based on Ct values for CRP, SAA, LECT2, HAMP, HP, IL-1β, TNF-α and β-actin genes in order to calculate the relative mRNA expression level (analysis of relative gene expression data using real-time quantitative PCR and the 2−(△△ct) method).
Primers used for real-time PCR analysis.
Whole-mount in situ hybridization (WISH)
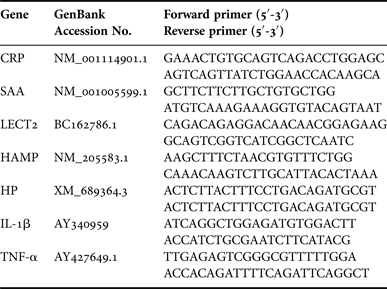
Larvae were each injected with PBS containing 6 × 10⁻³ ng of LPS or PBS alone at 24 hpf, cultured as above and sampled at 16 h after LPS injection. The sampled larvae were used for WISH. In parallel, normal embryos/larvae collected at 4-cell, early blastula (3 hpf), gastrula (5 hpf) and 13-somite (15 hpf) stages, as well as at 1, 2, 3 and 4 dpf, were similarly subjected to WISH. The constructed vector pGEM-T Easy was digested by NcoI enzyme, and the CRP-, SAA-, LECT2-, HAMP-, HP-, IL-1β- and TNF-α-specific antisense probes were synthesized using the primers listed in Table 2, by Sp6 RNA polymerase. WISH of zebrafish embryos/larvae was performed as described by Thisse & Thisse (Reference Thisse and Thisse2008), observed and photographed under a stereomicroscope (Nikon, Japan).
Primers used for in situ hybridization.

Statistical analysis
All the experiments were repeated three times. Statistical analysis was performed using SPSS13.0 for Windows. The data obtained from RT-PCR analysis were subjected to two-way analysis of variance (ANOVA) to determine differences in the mean values between the treatments and the controls, and difference at P < 0.05 was considered significant. All the data were expressed as means ±standard deviation.
RESULTS
Survival rate of LPS-injected embryos/larvae
As shown in Figure 1, challenge with LPS apparently affected the survival rate of zebrafish embryos/larvae in a dose-dependent manner. When the embryos/larvae were each injected with 6 × 10⁻⁴ ng of LPS at 10, 15 and 24 hpf, they all developed normally; when the embryos/larvae were each injected with 6 × 10⁻³ ng of LPS at the same developmental stages, more than 90% of the recipient embryos/larvae remained developing normally, with the survival rate comparable to that of control, and no abnormal development was observed morphologically up to 48 h after LPS injection. By contrast, when the embryos/larvae were each injected with 6 × 10⁻² and 6 × 10⁻¹ ng of LPS, only 67–78% and 49–54% of them, respectively, survived at 48 h after LPS injection. Therefore, the dose of 6 × 10⁻³ ng of LPS was used in all the following experiments.
Survival rate of zebrafish embryos/larvae at 48 h after LPS injection. The embryos/larvae were each injected with 0, 6 × 10⁻⁴, 6 × 10⁻³, 6 × 10⁻² and 6 × 10⁻¹ ng of LPS in the yolk sac at 10, 15 and 24 hpf. The cumulative mortality was calculated at 48 h after LPS injection.
Expression responses of APP and APP-inducing genes to LPS challenge
qRT-PCR was used to examine the expression profiles of APP (CRP, SAA, LECT2, HAMP and HP) and APP-inducing (IL-1β and TNF-α) genes in 10, 15 and 24 hpf embryos/larvae in response to LPS challenge. The dissociation curve of amplified products in all cases showed a single peak, indicating that the amplifications were specific (data not shown).
As shown in Figure 2, SAA, LECT2, HAMP and HP genes out of the five APP genes displayed a similar expression profiles: they were all significantly up-regulated at 16 and 24 h after LPS injection in 10 and 15 hpf embryos/larvae, and at 4, 16 and 24 h after LPS injection in 24 hpf embryos/larvae. By contrast, expression of CRP gene showed little change in 10 and 15 hpf embryos/larvae following LPS challenge, but its expression in 24 hpf larvae was markedly elevated at 4 h after LPS challenge, followed by decrease in expression levels at 16 and 24 h. Interestingly, expression of the two APP-inducing genes IL-1β and TNF-α was also enhanced considerably at 16 and 24 h after LPS injection in 10 and 15 hpf embryos/larvae, and at 4, 16 and 24 h after LPS injection in 24 hpf embryos/larvae. These indicate that zebrafish early embryos/larvae are immunocompetent to LPS challenge via up-regulating the expression of APP and APP-inducing genes.
Expression profiles of acute phase response (APR) and APR-inducing genes in normal and LPS-challenged embryos/larvae: (A) CRP gene; (B) SAA gene; (C) LECT2 gene; (D) HAMP gene; (E) HP gene; (F) IL-1β gene; (G) TNF-α gene. Thirty zebrafish embryos/larvae were sampled at each time point. PCR reaction was performed in triplicate. Each bar represents the mean of three experiments. Error bars represent the standard deviation. Statistically significant differences between LPS challenged samples and controls at each time point are indicated by *(P < 0.05).
Expression patterns of APP and APP-inducing genes in response to LPS challenge
WISH was performed to determine the spatiotemporal expression patterns of the APP and APP-inducing genes during early normal developmental stages. Both the APP and APP-inducing genes displayed strong maternal expression in the cleavage and blastula stages, and ubiquitous expression in the gastrula and segmentation stage embryos (Figures 3A–D, 4A–D, 5A–D, 6A–D, 7A–D, 8A–D and 9A–D). They then exhibited different tissue-specific expression patterns in later developmental stages. In particular, CRP mRNA was observed in the brain and eyes at 24 hpf, and in the brain at 48 hpf, and mainly in the liver at 72–96 hpf (Figure 3E–H); SAA mRNA was found in the brain and eyes at 24–48 hpf, and mainly in the brain at 72–96 hpf (Figure 4E–H); HAMP mRNA was seen in the brain and eyes at 24 hpf, and in the brain, eyes, liver and proctodeum (terminal gut) at 48 hpf, and in the brain, liver and proctodeum at 72–96 hpf (Figure 5E–H); LECT2 mRNA was detected in the brain, eyes, yolk sac and dispersed neutrophils of the caudal vein at 24–48 hpf (Figure 6E–F), in the brain and yolk sac at 72 hpf (Figure 6G), and in the brain and liver at 96 hpf (Figure 6H); and HP mRNA was present in the brain and eyes at 24–48 hpf, and in the brain and liver at 72–96 hpf (Figure 7E–H). For IL-1β and TNF-α, their mRNA was found in the brain and eyes at 24–48 hpf, and in the brain and liver at 72–96 hpf (Figures 8E–H and 9E–H). This demonstrates that APP and APP-inducer mRNA is maternally localized ubiquitously in the early embryos, while it is restricted to specific tissues in later developmental stages.
Expression pattern of CRP gene in normal and LPS-challenged embryos/larvae. CRP mRNA is ubiquitous at 4 cells stage (A), blastula stage (B), gastrula stage (C) and embryo at 15 hpf (D). CRP mRNA is detected in the brain and eye of larva at 24 hpf (E), in the brain of larva at 48 hpf (F), and in the liver of larva at 72–96 hpf (G, H). LPS had no effect on the expression pattern of CRP gene in the challenged larva (J) compared with the control (I). Blue arrow indicates the liver. Scale bars: A–J, 100 µm.
Expression pattern of SAA gene in normal and LPS-challenged embryos/larvae. SAA mRNA is ubiquitous at 4 cells stage (A), blastula stage (B), gastrula stage (C) and embryo at 15 hpf (D). SAA mRNA is detected in the brain and eyes of larva at 24–48 hpf (E, F), and in the brain of larva at 72–96 hpf (G, H). LPS challenge resulted in the expression of SAA gene in the yolk sac and intestine (J) compared with the control (I). The green arrows indicate the intestine, and the black arrows indicate the yolk sac. Scale bars: A–J, 100 µm.
Expression pattern of HAMP gene in normal and LPS-challenged embryos/larvae. HAMP mRNA is ubiquitous at 4 cells stage (A), blastula stage (B), gastrula stage (C) and embryo at 15 hpf (D). HAMP mRNA is detected in the brain and eyes of larva at 24 hpf (E), in the brain, eyes, liver, and terminal gut of larva at 48 hpf (F), and in the brain, liver and terminal gut of larva at 72–96 hpf (G, H). LPS challenge resulted in the expression of HAMP gene in the yolk sac (J) compared with the control (I). The blue arrows indicate the liver, the green arrows the terminal gut, and the black arrows the yolk sac. Scale bars: A–J, 100 µm.
Expression pattern of LECT2 gene in normal and LPS-challenged embryos/larvae. LECT2 mRNA is ubiquitous at 4 cells stage (A), blastula stage (B), gastrula stage (C) and embryo at 15 hpf (D). LECT2 mRNA is detected in the brain, eyes, yolk sac and dispersed neutrophils of the caudal vein of larva at 24–48 hpf (E, F), in the brain and yolk sac of larva at 72 hpf (G), and in the brain and liver of larva at 96 hpf (H). LPS challenge resulted in visible up-regulation of LECT2 gene in the yolk sac (J) compared with the control (I). The blue arrows indicate the liver, the red arrows the dispersed neutrophils of the caudal vein. Scale bars: A–J, 100 µm.
Expression pattern of HP gene in normal and LPS-challenged embryos/larvae. HP mRNA is ubiquitous at 4 cells stage (A), blastula stage (B), gastrula stage (C) and embryo at 15 hpf (D). HP mRNA is detected in the brain and eyes of larva at 24–48 hpf (E, F), and in the brain and liver at 72–96 hpf (G, H). LPS had no effect on the expression pattern of HP gene in the challenged larva (J) compared with the control (I). The blue arrows indicate the liver. Scale bars: A–J, 100 μm.
Expression pattern of IL-1β gene in normal and LPS-challenged embryos/larvae. IL-1β mRNA is ubiquitous at 4 cells stage (A), blastula stage (B), gastrula stage (C) and embryo at 15 hpf (D). IL-1β mRNA is detected in the brain and eyes of larva at 24–48 hpf (E, F), and in the brain and liver of larva at 72–96 hpf (G, H). LPS challenge resulted in the expression of IL-1β gene in the yolk sac and dispersed neutrophils of the caudal vein (J) compared with the control (I). The blue arrows indicate the liver, the black arrows the yolk sac, and the red arrows the neutrophils of the caudal vein. Scale bars: A–J, 100 µm.
Expression pattern of TNF-α gene in normal and LPS-challenged embryos/larvae. IL-1β mRNA is ubiquitous at 4 cells stage (A), blastula stage (B), gastrula stage (C) and embryo at 15 hpf (D). TNF-α mRNA is detected in the brain and eyes of larva at 24–48 hpf (E, F), and in the brain and liver of larva at 72–96 hpf (G, H). LPS had no effect on the expression pattern of TNF-α gene in the challenged larva (J) compared with the control (I). The blue arrows indicate the liver. Scale bars: A–J, 100 µm.
Whole-mount in situ hybridization was next carried out to test if LPS challenge could cause changes in the spatial expression patterns of the APP and APP-inducing genes. Compared with control, no clearly visible changes in the expression patterns of CRP, HP and TNF-α genes were observed in the LPS-challenged larvae (Figures 3I–J, 7I–J and 9I–J). By contrast, in the LPS-challenged larvae, the SAA gene was not only expressed in the tissues mentioned in the normal larvae but also in the yolk sac and intestine (51%; Figure 4I–J), which are usually devoid of SAA mRNA. Similarly, LPS challenge resulted in the expression of HAMP in the new site of the yolk sac (90%; Figure 5I–J), visible up-regulation of LECT2 gene in the yolk sac (87%; Figure 6I–J), and the expression of the IL-1β gene in the yolk sac as well as in the dispersed neutrophils of caudal vein (47%; Figure 8I–J), in addition to the tissues expressing HAMP, LECT2 and IL-1β genes in the non-treated larvae. This shows that LPS is capable of causing changes in the expression patterns of most APP and APP-inducing genes in zebrafish larvae.
DISCUSSION
The present study shows for the first time that microinjection of 6 × 10⁻³ ng of LPS into each embryo/larva has little influence on normal development in zebrafish. On the basis of this finding, we examined the acute phase response of developing zebrafish embryos/larvae by means of qRT-PCR and WISH.
Embryo/larva is capable of acute phase reaction
The development of embryos/larvae in most fish is in an aquatic environment full of numerous pathogens capable of causing various types of diseases. At this early stage, the immune system of fish embryos/larvae remains in a developing state and lacks the functionality found in adults (Zapata et al., Reference Zapata, Diez, Cejalvo, Frías and Cortés2006), and it is thus rather vulnerable, and susceptible to various microorganisms (Haig et al., Reference Haig, Davies, Welch, Reese and Verner-jeffreys2011). How fish embryos/larvae survive pathogenic attacks in such a hostile environment is poorly understood. It has been shown that both innate and adaptive immune-relevant molecules transferred from mother to egg are involved in the protection of embryos/larvae in several fishes, such as zebrafish (Wang et al., Reference Wang, Zhang, Tong, Li and Wang2009, Reference Wang, Ji, Shao and Zhang2012), rainbow trout (Løvoll et al., Reference Løvoll, Kilvik, Boshra, Bøgwald, Sunyer and Dalmo2006) and plaice (Bly et al., Reference Bly, Grimm and Morris1985). Here we clearly demonstrate that early embryos/larvae of zebrafish are capable of actively responding to LPS challenge by up-regulating the expression levels of APP and APP-inducing genes, suggesting the existence of a capacity in zebrafish embryos/larvae to mount an acute phase response by gene regulation at the transcriptional level.
Spatiotemporal expression patterns of APP and APP-inducing genes
CRP, SAA, HP, LECT2 and HAMP are primarily produced in the liver in mammalian species (Dobryszycka, Reference Dobryszycka1997; Uhlar & Whitehead, Reference Uhlar and Whitehead1999; Hunter et al., Reference Hunter, Fulton, Ganz and Vogel2002; Pepys & Hirschfield, Reference Pepys and Hirschfield2003; Ovejero et al., Reference Ovejero, Cavard, Périanin, Hakvoort, Vermeulen, Godard, Fabre, Chafey, Suzuki, Romagnolo, Yamagoe and Perret2004). We demonstrate that these APP mRNAs are ubiquitously present in the early embryos of zebrafish, but later in development, they display a different tissue-specific expression pattern. This implies that these genes play an important role in embryogenesis and participate in the pattern formation of developing larvae. Notably, zebrafish CRP, HP, LECT2 and HAMP genes are all expressed in the liver of developing larvae, consistent with their spatial expression pattern in mammalian species and in adult fishes such as carp (Fujiki et al., Reference Fujiki, Shin, Nakao and Yano2000), salmon (Jensen et al., Reference Jensen, Hiney, Shields, Uhlar, Lindsay and Whitehead1997), croaker (Li et al., Reference Li, Chen and Shi2008) and grouper (Wei et al., Reference Wei, Guo, Cui, Yan, Ouyang and Qin2011). However, SAA mRNA is not observed in the liver of larvae at 96 hpf, and whether it is expressed in the liver of adult zebrafish remains to be determined.
IL-1β and TNF-α, which stimulate the APR, are both chiefly synthesized in immune cells including macrophages and natural killer cells in mammalian species (Locksley et al., Reference Locksley, Killeen and Lenardo2001; Speaker & Fleshner, Reference Speaker and Fleshner2012). We show in this study that IL-1β and TNF-α mRNAs are ubiquitously found in the early embryo, and then specifically in the brain, eyes and liver of the larva, in contrast to brown trout, in which IL-1β and TNF-α transcripts were not detected by RT-PCR until 3 weeks post-fertilization (Cecchini et al., Reference Cecchini, Paciolla, Biffali, Borra, Ursini and Lioi2013). This suggests that IL-1β and TNF-α in zebrafish are linked not only to maternal immunity but also to the pattern formation of developing larvae as well, which demands further study.
LPS modifies APP and APP-inducing gene expression patterns
We show that LPS challenge results in changes in the spatial expression patterns of SAA, HAMP, LECT2 and IL-1β genes in zebrafish larvae, although no visible changes in the expression patterns of CRP, HP and TNF-α genes are found. In particular, de novo expression of the SAA gene is observed in the yolk sac and intestine, the LECT2 gene in the yolk sac, and the IL-1β gene in the yolk sac and the dispersed neutrophils of the caudal vein, and visible enhanced expression of the LECT2 gene is observed in the yolk sac. To our best knowledge, these are the first such data reported in teleosts, providing additional evidence showing that fish embryos/larvae are immunocompetent to acute infection.
The liver is the primary organ of acute phase response in adult individuals of both mammals and fish. Our results show that the yolk sac, intestine and neutrophils in the caudal vein are the tissues which actively respond to LPS challenge in zebrafish embryos/larvae. This implies that the embryo/larva in fish possesses different tissues from adults to respond to acute infection.
In summary, this study demonstrates the immunocompetence of zebrafish embryos/larvae by showing both the up-regulation of APP and APP-inducing genes and the modification of their spatial expression pattern in response to challenge with LPS in early developmental stages. It also opens up a new angle for the study of LPS-induced spatial changes in the expression patterns of APP genes in the embryos/larvae of other animals.
ACKNOWLEDGEMENT
The authors thank Dr Dongrui Ji for his technical help.
FINANCIAL SUPPORT
This work is supported by a grant from the Natural Science Foundation of China (31372505) to S.Z.