Introduction
‘Local’ food sales can occur through various supply chains. Direct-to-consumer (DTC) agricultural markets for local foods can include farmers markets, roadside stands, community supported agriculture (CSA) programs and pick-your-own operations. Local food sales can also occur when a farmer sells products directly to retail institutions, such as schools, colleges and hospitals, or other intermediaries that market locally branded products, such as grocery stores, restaurants, distributors and processors. Local food sales by farmers were estimated to equal $8.7 billion in 2015 in the United States (USDA NASS, 2016).
One market segment of local foods that has received particular attention in recent years is the purchase of local foods by schools. Schools are a large potential market for local foods, as approximately 30.5 million students participate annually in the National School Lunch Program (USDA FNS, 2016b). While schools’ purchases of foods directly from farmers was common in the United States through the early 1970s, by the 1980s and 1990s this practice had effectively ceased to exist (Joshi et al., Reference Joshi, Henderson, Ratcliffe and Feenstra2014). This trend started to reverse in the late 1990s, as schools began placing a greater priority on sourcing food locally. The motivations for local food purchases by schools are multifaceted, and include educating children about agriculture, promoting rural development, developing markets for local farmers and improving child nutrition (Benson, Reference Benson2014). These local food purchases, in addition to the creation of school gardens and development of agricultural, food and nutrition-based educational curriculum, are collectively known as ‘farm to school’ activities. States concurrently implemented legislation to support farm to school programs, such as creating state-based grant programs and/or hiring farm to school coordinators (National Farm to School Network and Vermont Law School Center for Agriculture and Food Systems, 2015). The number of US school districts reporting undertaking farm to school programs is estimated to have increased from six in 1997 to 5254 (representing 42,587 schools) during the 2013–2014 school year (NFSN, 2016; USDA FNS, 2016a)Footnote 1.
Numerous supply constraints were identified as impediments to making local food purchases by school districts in the 2015 Farm to School Census (USDA FNS, 2016a). While there may be various supply chain obstacles that impede local school food purchases, few studies have empirically examined the linkages between school food purchases and local agricultural production. In this paper, we merge data from a 2015 Farm to School Census with Census of Agriculture data and other socio-economic data to explore how local food purchases by schools are influenced by the level of local agricultural production.
The influence of agricultural production on such purchases is unclear. On the one hand, local food purchasing programs may be more likely implemented by schools in regions where local agricultural sectors are struggling and are highly incentivized to develop new market opportunities. One critique of farm to school programs in the popular press is that they could support agriculture in locales in which there is a comparative disadvantage in production (e.g., Lusk and Norwood, Reference Lusk and Norwood2011). For instance, the significant consolidation of the dairy sector could provide a greater motivation for schools to explicitly seek local sources. On the other hand, schools may purchase local foods in greater quantities when it is more readily available from local farmers and/or there is a regional comparative advantage in production. For example, interest exists among policymakers in whether DTC marketing can provide a gateway for local food farmers to sell to intermediaries. However, whether the sales of local foods in DTC markets, like farmers markets, are a substitute or complement for local food purchases by schools is unclear a priori.
While we provide a more detailed description and rationale of our empirical strategy in the body of the paper, we first provide a high-level roadmap as guidance. We test the hypotheses that we presented in the previous paragraph by estimating two-tier ‘double hurdle’ models. In the first-tier equation, we estimate a probit regression of whether the probability that a school district purchases local food products is influenced by the extent of local agricultural production and a number of control variables. In the second-tier equation, we estimate the impact of proximate agricultural production (along with the control variables that we use in the first-tier regression) on the level of local food purchases among the subset of school districts undertaking local food purchases. Our rationale for estimating two distinct regressions is to test whether the explanatory variables have different effects on the probability of buying local foods relative to the level (or intensity) of making such purchases. Estimating these different effects is informative since supply constraints are an impediment to making greater local food purchases both by school districts that are not making local food purchases and those that are already making them.
Because the supply chain for milk (the main food product sourced locally by schools) may be distinct from other food products, we examine two different local food purchases. The first set consists of regressions of local milk expenditures by school districts on the value of proximate dairy production. The second set consists of regressions of local non-milk food expenditures by school districts on the value of proximate DTC agricultural production.
In the subsequent background section, we provide details about the Farm to School Census survey, the primary data set used in this research. An objective of this section is to contextualize our interest in establishing linkages between local school food purchases and the agricultural sector. This is followed by a literature review, in which we explicitly describe how our results contribute to our understanding of local school food purchases vis-à-vis the pre-existing literature. The methods section describes our empirical models in detail and includes an explanation of how we can infer if our results are causal or not. In providing the results, we hope that they can inform the effective implementation of programs and policies that support the use of local foods in schools.
Background
The US Congress passed the Healthy Hunger Free Kids Act in 2010. This legislation directed the US Department of Agriculture (USDA) to create a Farm to School Program that provided grants to schools implementing such activities. USDA's Farm to School Program was established in the Food and Nutrition Service (FNS), the federal agency responsible for administering child nutrition programs. USDA was also directed in this legislation to ‘disseminate research and data on existing farm to school programs and the potential for programs in underserved areas’. To meet this mandate, USDA administered the first Farm to School Census in 2013. The survey was distributed to every public school district in the United States participating the National School Lunch Program. In 2015, USDA administered a second Farm to School Census that included private schools and charter schools as well as public school districts participating in the National School Lunch Program (USDA FNS, 2016a). We refer to responding schools and school districts generally as ‘school food authorities’ (SFAs) throughout the remainder of the paper. The 2015 Farm to School Census asked SFA food service directors about their participation in farm to school programs during the 2013–2014 academic year. Out of approximately 18,104 SFAs that were issued surveys, 12,585 SFAs submitted usable responses to the 2015 Farm to School Census (a 70% response rate).
Within the 2015 Farm to School Census questionnaire (USDA FNS, 2016a), SFAs are asked to estimate the total dollars that they spent on all food for school meals, as well as the total dollars spent on local food including and excluding fluid milk. ‘Local’ was self-defined by survey respondents, with the geographic distance of being within 100 miles of the SFA cited as a frequent response.Footnote 2 The Census indicated that SFAs could consider local food purchases that they made either directly from farmers or farmer cooperatives, as well as from intermediaries such as distributors or food service management companies. Aggregate local food expenditures for the 2013–2014 yr were equal to $789 million, which comprised 11% of the value of total food expenditures for responding schools (USDA FNS, 2016a). Fluid milk accounted for 61% of the value of local food purchases.
The 2015 Farm to School Census responses indicated that the lack of year-round availability of key items, local items not available from primary vendors and higher prices were among the top challenges of responding SFAs in purchasing local foods. Further, these factors were identified as impediments irrespective of whether the SFA was purchasing local foods or not. The percentage of SFAs that were not purchasing local foods that identified these supply-side constraints as obstacles to local sourcing were 39, 29 and 21%, respectively, whereas the respective percentages for SFAs participating in farm to school programs was 57, 27 and 38%. This indicates that some schools already participating in farm to school programs desired to purchase a greater amount of local foods than existing levels.
The impact that local agricultural sectors have on SFAs purchasing local foods is likely to vary by food product. For instance, local fluid milk purchases by a SFA are unlikely to depend on local DTC agricultural production. This is because fluid milk sales are uncommon in DTC markets since the product is relatively heavy and must be kept both sealed and cool. Fruits, vegetables and nuts are among the predominate food groups sold locally (Low et al., Reference Low, Adalja, Beaulieu, Key, Martinez, Melton, Perez, Ralston, Stewart, Suttles, Vogel and Jablonski2015), and only 2% of vendors at farmers markets sell milk or dairy products (Ragland and Tropp, Reference Ragland and Tropp2009). However, local fluid milk purchases by SFAs may be influenced by local milk production, since fluid milk markets tend to be local (MacDonald et al., Reference MacDonald, O'Donoghue, McBride, Nehring, Sandretto and Mosheim2007). Nonetheless, it is unclear a priori if schools are more likely to purchase local milk in order to support a more modest local dairy sector that might be struggling or losing market share, or instead if local purchases are a response to greater level of supply in regions with a prominent dairy sector.
In contrast, the purchase of local non-milk foods by schools may depend on local DTC agricultural production. However, whether DTC agricultural production is a substitute or complement for local food purchases by school districts is unclear. DTC agricultural markets can complement school purchases of local foods by increasing the awareness and demand of local residents for local foods. They could also result in farmers and local food organizations acquiring experience and increasing their engagement with local intermediaries, such as schools, that may procure local foods. These two market segments also have the capability of being the substitutes if purchases of local foods in one local food market segment saturate the ability of the other to develop (Low et al., Reference Low, Adalja, Beaulieu, Key, Martinez, Melton, Perez, Ralston, Stewart, Suttles, Vogel and Jablonski2015).
Literature review
Factors influencing schools purchasing local foods
Conner et al. (Reference Conner, Izumi, Liquori and Hamm2012) found that farm to school programs are more likely to be successful when there are strong relationships and a set of shared values, particularly a desire to support local farmers, among the supply chain participants. Several studies have examined the characteristics of school districts in purchasing local foods. Vo and Holcomb (Reference Vo and Holcomb2011) found in Oklahoma that the size of the school district (i.e., the number of students), school meal procurement characteristics and school lunchroom characteristics were associated with farm to school participation. Dimitri et al. (Reference Dimitri, Hanson and Oberholtzer2012) found in Maryland that county income and the percentage of students eligible for free lunch were among variables that were associated with schools purchasing local foods.
Vo and Holcomb (Reference Vo and Holcomb2011) found scheduling delivery as the largest obstacle to schools purchasing local foods, whereas Dimitri et al. (Reference Dimitri, Hanson and Oberholtzer2012) found seasonal availability as the most frequently identified impediment. Lyson (Reference Lyson2016) undertook a state-level analysis, and found that the income level of a state and farm to school adoption rates in nearby states in their region were significant predictors of the percentage of districts implementing a farm to school program in a state.
Botkins and Roe (Reference Botkins and Roe2015) use the results of the 2013 Farm to School Census to estimate discrete choice models exploring which factors influence whether a school district participates in a farm to school program and/or serves local food. They found that the proportion of local farms involved in DTC marketing, number of farmers markets per capita and farm income all had a positive impact on the probability that a school district serves local food. Similarly, Ralston et al. (Reference Ralston, Beaulieu, Hyman, Benson and Smith2017) used the same dataset and found that schools in cities, larger schools, higher per capita income and a greater density of farmers markets increased the probability that schools serve local foods daily. The characteristics of DTC agricultural markets on the purchases of local foods by intermediaries have also been examined for other (non-school) institutions. Smith et al. (Reference Smith, Kaiser and Gomez2013) found that a higher proportion of farms participating in a CSA program within the same county as a hospital increased the probability of that hospital undertaking a farm to hospital program in the Northeast.
Despite this research, there are several shortcomings in our understanding of how local school food purchases depend on local agricultural sectors. Some studies have limited geographic scope (e.g., a single state), and thus the results may not be generalizable nationally. An important attribute of our research is that we utilize a national dataset. Many studies have employed discrete choice models, and have not examined variation in the level of expenditures among participating schools. The models are also not estimated distinctly for different kinds of foods, even though there could be a considerable regional variation in the relative availability of different kinds of food products. A critical contribution of our research is that we estimate which factors influence local school food expenditures for two distinct market segments: fluid milk and non-milk food products. Further, while proxies for local agricultural production have been used (such as the ratio of farms selling locally, number of farms selling locally, or number of farmers markets per capita), these variables do not represent the sales level of local agricultural production, which is what we consider in our study. Some of these agricultural proxy variables may also be ‘endogenous’ (i.e., correlated with the error term in the regression), and endogeneity has not been rigorously considered in the literature to-date. In our study, we explicitly test for the possibility of endogeneity.
Characteristics of farmers in local food markets
We review some of the literature that has examined the characteristics of farmers that sell in DTC agricultural markets. We do this for two reasons. First, it is relevant because one of the principle hypothesis that we explore in this paper is the complementarity between DTC agricultural production and local school food purchases. Secondly, historically there have been better data and research on farmers selling in DTC markets than through other (non-DTC) local markets. So, if there is an overlap between farmers selling to these distinct markets, then this literature is applicable to farmers that sell locally to schools.
DTC agricultural markets can provide a critical opportunity for farms that are unwilling or unable to sell products in conventional markets, as farms selling through DTC agricultural markets tend to be small- and medium-sized (Detre et al., Reference Detre, Mark, Mishra and Adhikari2011; Low and Vogel, Reference Low and Vogel2011; Ahearn and Sterns, Reference Ahearn and Sterns2013). However, the prominence of local food markets varies throughout the United States. Brown et al. (Reference Brown, Goetz, Ahearn and Liang2014) found that per capita DTC sales had a positive impact on changes in per capita farm sales in New England and the mid-Atlantic, although they had a negative impact in the Southeast.
Some research has documented the importance of DTC agricultural marketing in the development of professional skills by vendors. Feenstra et al. (Reference Feenstra, Lewis, Hinrichs, Gillespie and Hilchey2003) found that vendors selling products in DTC agricultural markets can improve their entrepreneurial skills by expanding product lines and processing, establishing new business contacts, and improving marketing techniques. Management skills are particularly important for local farmers. Park et al. (Reference Park, Mishra and Wozniak2014) found that the local food farmers that sell to intermediated markets had higher management skills than farmers that do not sell locally, and that marketing skills had a positive impact on farm sales. Farms with DTC sales also had a higher survival rate between 2007 and 2012 relative to other farms (Low et al., Reference Low, Adalja, Beaulieu, Key, Martinez, Melton, Perez, Ralston, Stewart, Suttles, Vogel and Jablonski2015).
Whether the skill development in DTC markets provides a gateway for farmers to subsequently sell local foods in larger quantities to intermediaries, such as schools, is of interest because the average sales of local food farms selling exclusively to intermediaries is 15 times greater than those selling exclusively in DTC markets (Low et al., Reference Low, Adalja, Beaulieu, Key, Martinez, Melton, Perez, Ralston, Stewart, Suttles, Vogel and Jablonski2015). For instance, Uematsu and Mishra (Reference Uematsu and Mishra2011) found that the two classifications of intermediated local food market channels (sales to regional distributors and to local grocery stores, restaurants and other retailers) and one DTC marketing channel (on-farm stores) had a positive impact on farm income for at least some farms, and also found that three DTC market channels (farmers markets, roadside stores and CSA programs) had a negative impact.
Methods
Model
The relative importance of factors that influence whether a SFA purchases local foods may vary from the level of expenditures once a SFA elects to purchase local foods. Since local food expenditures by SFAs are censored at zero, we estimate a double hurdle model following the methodology in Wooldridge (Reference Wooldridge2002).
We express the first-tier equation in (1):
 $$P\left( {y_2 = 0{\rm \vert} {\bi x}} \right) = 1 - {\rm \Phi} ({\bi x}\gamma )$$
In (1), Φ is the standard normal cumulative distribution function, y 2 is a binary dependent variable with a value equal to one if a SFA purchases local foods and equal to zero if they do not, and x is a matrix of explanatory variables. We estimate the parameter γ in equation (1) using a probit model.
For the second-tier equation, y 1 is the level of local food expenditures. We make the distributional assumption expressed in equation (2):
 $$\log \left( {y_1} \right) \vert \left( {{\bi x}_1,y_1 \gt 0} \right)\ \sim N({\bi x}_1{\rm \beta}, {\rm \sigma} ^2)$$
We estimate the parameters β and σ2 with an ordinary least squares regression of log(y 1) on x1 for the observations in which y 1 >0.
We estimate two separate sets of double hurdle regressions. For one set, we use local fluid milk products as the dependent variables in (1) and (2). For the other set, we estimate these regressions using local non-milk food products as the dependent variables. The independent variable of interest is local milk sales from cows when the dependent variables are an indicator variable of whether a SFA purchased local fluid milk in the first-tier equation and the level of local fluid milk expenditures in the second-tier equation. Local DTC agricultural sales are the dependent variable of interest for the local non-milk food product regressions.
A positive coefficient on proximate agricultural production in the first-tier equation implies that a high level of agricultural production has a positive impact on the probability that a school district makes local food purchases, whereas a positive coefficient on proximate agricultural production in the second-tier regression implies that it has a positive impact on the level of such purchases. Positive coefficients imply that school districts would make greater local food purchases if local agricultural production is enhanced. We would reach the opposite conclusions if the coefficients on agricultural production are negative.
We calculate the value of local agricultural production as the sum of agricultural sales in counties within 100 miles of the respective SFA. We select 100 miles as a definition of proximity based on the preponderance of responses indicating that such distance was considered ‘local’. We calculate the distance between SFAs and counties using the population centroids of the county in which the SFA resides and the corresponding population centroids of the comparison county (Census Bureau, 2015a).Footnote 3
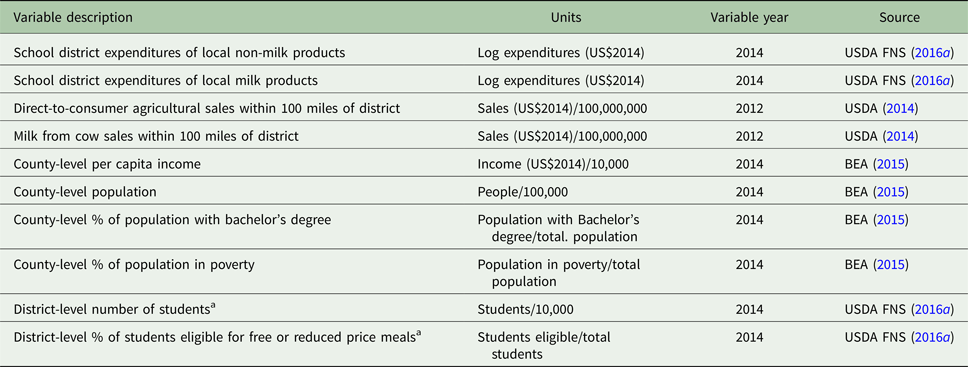
Table 1 presents the list of variables and data sources used in the regressions. We scaled the variables so that the algorithms converged for the probit specifications. We convert all pecuniary data into 2014 US dollars using the consumer price index (BLS, 2016). We include the same county-specific and school-specific control variables in both tiers of the double hurdle regressions. Our rationale for which control variables to include was based, in part, on variables that had been identified as significant in previous studies (e.g., Ralston et al., Reference Ralston, Beaulieu, Hyman, Benson and Smith2017). We include population, per capita income, the percentage of the population with a bachelor's degree and the percentage of the population in poverty in the county in which the SFA resides to control for county-specific socio-demographic characteristics. O'Hara and Low (Reference O'Hara and Low2016) found that per capita income was exogenous with regard to DTC agricultural sales in the northeast, which is a region of the country in which DTC agricultural sales are concentrated. Thus, we assume that per capita income is exogenous with regard to local school food expenditures as well, since the value of local school food purchases in the school year 2013–2014 is less than that of the 2012 DTC agricultural sales. We include both per capita income and the percentage of residents in poverty as independent variables since the former variable represents the average level of income in a county, whereas the latter variable represents the distribution of income. We include population as a control variable since local food infrastructure conducive for such markets may be more concentrated in areas with a sufficient level of population density. For instance, Low et al. (Reference Low, Adalja, Beaulieu, Key, Martinez, Melton, Perez, Ralston, Stewart, Suttles, Vogel and Jablonski2015) found that food hubs were concentrated in metropolitan counties. Finally, the inclusion of the percentage of the population of a county with a bachelor's degree can control for whether advanced education levels among the adult population have induced school districts to buy more local foods. We do not have data on parental education levels at the school district level, so including this county-level indicator can serve as a proxy for whether parental pressure influences local food purchases by school districts.
Description of variables

a Original source for data is Common Core of Data School File 2013–2014.
SFA-specific controls include the number of students enrolled in the SFA and the percentage of students eligible for free or reduced-priced school meals. We include dummy variables that correspond to FNS regional office territories (USDA FNS, 2016c) in both probit and OLS regressions. We also use state-level dummy variables as control variables in the OLS regressions to control for variation among states in policies that support farm to school programing, as well as other factors that could vary at the state level (such as farming conditions)Footnote 4.
Endogeneity test
The final component of our empirical strategy consists of testing whether agricultural production is ‘endogenous’. In econometrics, an independent variable is endogenous if it is correlated with the regression's error term.
Local agricultural production could be endogenous for several reasons. Simultaneity is one possibility. For example, the purchases of local fluid milk by schools would increase revenue to local dairy producers. Similarly, there could also be a feedback mechanism between local non-milk purchases and DTC agricultural production. There may also be unobserved omitted variables that are correlated with local DTC production and local non-milk food expenditures. We use 15-yr lags of DTC agricultural production and milk production (i.e., agricultural sales in 1997) as instruments to test for the possibility of endogeneity. We assume that the lags of this duration are exogenous with regard to the 2013–2014 local food expenditures by SFAs since modern farm to school initiatives did not begin until the late 1990s. We test for endogeneity in both the first-tier probit regression and in the second-tier OLS regression. For the probit regressions, we test whether the value of agricultural sales is exogenous using the two-step Rivers–Vuong approach outlined in Wooldridge (Reference Wooldridge2002). If the value of agricultural sales is not exogenous, we then estimate the parameters using conditional maximum likelihood.
We perform the Hausman endogeneity test for the OLS regressions. To do so, we regress agricultural sales on the instruments and other control variables. We then use the residuals from this first-stage regression as an independent variable in specifications in which the log of local food expenditures is also regressed on all of the explanatory variables included in the population model. A statistically significant coefficient corresponding to the first-stage residuals in the second-stage regression indicates that agricultural production is endogenous (Wooldridge, Reference Wooldridge2002). We employ instrumental variables in order to avoid the resulting bias in such instancesFootnote 5.
Descriptive statistics
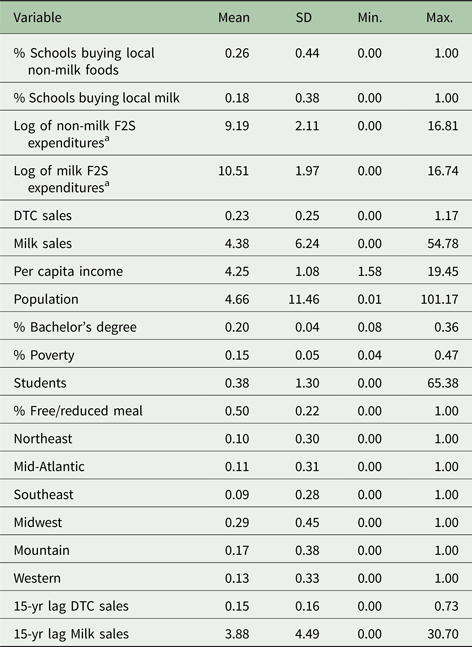
The percentage of respondents purchasing local non-milk foods is 26%, and the percentage of respondents purchasing local milk is 18% (Table 2). Average respondent-level expenditures for local non-milk foods are $9,799, whereas average expenditures for local fluid milk are $36,680. There is a high degree of variation in DTC non-milk sales and milk sales, with average sales within 100 miles of a SFA equal to $23 and $438 million, respectively.
Descriptive statistics

a For districts purchasing such local products.
Results
First-tier probit regressions
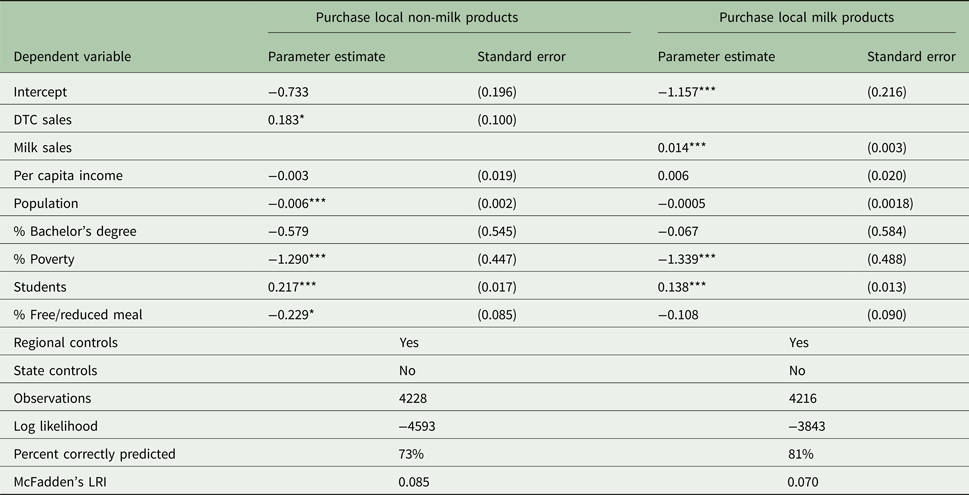
Table 3 shows that the value of local DTC agricultural production has a positive and statistically significant impact on the probability that a SFA purchases local non-milk food products (P < 0.1). Local milk sales have a positive impact on the probability that a SFA buys fluid milk locally (P < 0.01). We calculate the marginal effects of these variables by evaluating the mean values of the explanatory variables at their parameter estimates. We find that a doubling of local DTC agricultural production increases the predicted probability of a SFA purchasing local non-milk products by 0.01 (1%), and that a doubling of local dairy production increases the predicted probability that a SFA purchases local milk products by 0.02 (2%).
Probit results of purchasing local food products

Regional parameter estimates suppressed from table for brevity.
***Significant at 99% confidence. **Significant at 95% confidence. *Significant at 90% confidence.
The number of students enrolled in the SFA has a positive impact on both local non-milk and local milk purchases (P < 0.01), while the percentage of residents living in poverty in the county has a negative impact (P < 0.01). The county's population (P < 0.01) and the percentage of students eligible for free or reduced-price meals (P < 0.1) also have a negative impact on the probability of purchasing local non-milk foods. To summarize, while the results provide a clear signal that both poorer schools and schools in poorer counties have a reduced probability of undertaking local food purchases, the influence of population density is less straightforward. This is because school district size has a positive impact, but county population has a negative effect.
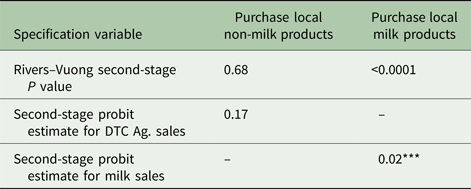
The Rivers–Vuong P value indicates that DTC agricultural production is exogenous with regard to the probability that a SFA purchases local non-milk foods (Table 4). Thus, it is appropriate to apply a causal interpretation to the coefficient on DTC agricultural sales in Table 3; i.e., increasing DTC agricultural production increases the probability that a school buys local non-milk products. In contrast, milk production is endogenous regarding whether a SFA purchases local fluid milk. The second-stage milk sales coefficient is positive and statistically significant with a similar coefficient magnitude as in Table 3. Thus, the finding that local milk production impacts the probability that a SFA buys local milk is robust to whether milk production is assumed to be endogenous or exogenous. So, even taking into account that there could be a feedback mechanism between local dairy production and the probability of local school milk purchases, we can conclude that an increase in the former variable causes an increase in the latter variable.
Probit endogeneity checks

Other independent variables suppressed from table for brevity.
***Significant at 99% confidence. **Significant at 95% confidence. *Significant at 90% confidence.
Second-tier OLS regressions
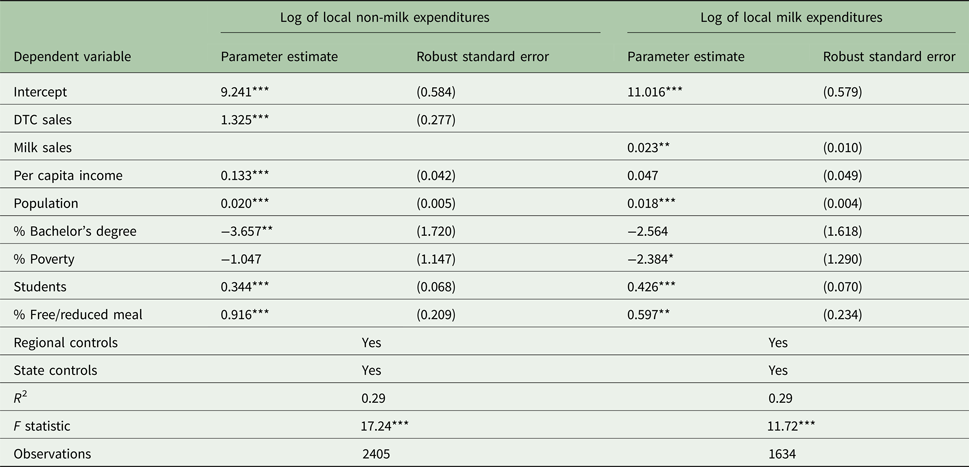
Table 5 shows that DTC agricultural sales and milk sales both are positive and statistically significant in explaining the expenditure levels of local non-milk foods and local milk, respectively. These parameter estimates correspond to ‘elasticities’ (i.e., proportional responsiveness) of 0.3 for DTC agricultural production and 0.1 for milk production when using average values of the independent variables reported in Table 2.
OLS results of purchasing local food products

State and regional parameter estimates suppressed from table for brevity.
***Significant at 99% confidence. **Significant at 95% confidence. *Significant at 90% confidence.
Population of the county in which the SFA is located and the number of students enrolled in the SFA are positive and statistically significant in both specifications (P < 0.01). The population coefficient corresponds to elasticities of 0.09 for local non-milk food purchases and 0.08 for local milk purchases. Similarly, school enrollment coefficients correspond to elasticities of 0.13 and 0.16, respectively. The percentage of students eligible for free and reduced price meals is positive and statistically significant in both of the OLS regressions (P < 0.01), which is the opposite sign that this variable had in the probit regressions reported in Table 3. The percentage of residents living in poverty of the county that the SFA is located in is negative and significant in the local milk specification (P < 0.1). Per capita income is statistically significant and positive when local non-milk expenditure is the dependent variable (P < 0.01), while the percentage of residents with a bachelor's degree is negative (P < 0.05). To summarize, the two population density variables (county population and school size) have a positive influence on the level of local food purchases. However, a general interpretation of how income impacts the level of purchases is ambiguous due to the opposite signs on the school-level and county-level poverty variables. This pattern is the opposite of what occurred in the probit regressions that we reported in Table 3.
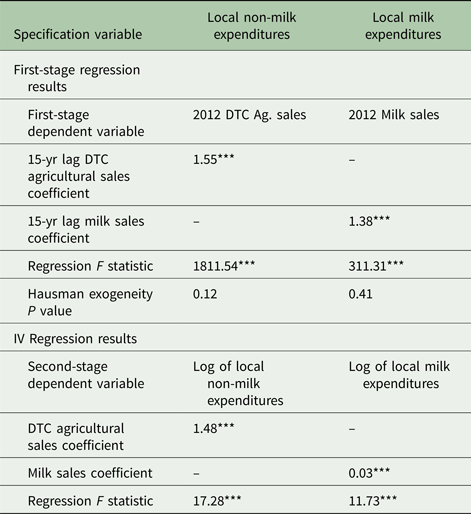
Table 6 presents the 2SLS results. The first-stage regression results indicate that the lagged values of the independent variables are valid instruments, as both are statistically significant with the expected signs (P < 0.01). The first-stage F statistics are also positive and statistically significant (P < 0.01). While the Hausman tests indicate that both DTC production and milk production are exogenous, the second-stage regression results show that DTC agricultural sales and milk sales are both positive and statistically significant (P < 0.01). The second-stage 2SLS parameter estimates are close in magnitude to the OLS parameter estimates. Thus, the finding that local DTC agricultural production and local milk production have a positive impact on local non-milk and local milk purchases by schools, respectively, holds regardless of whether these variables are assumed to be endogenous or exogenous.
Instrumental variable results

Other independent variables suppressed from table for brevity.
***Significant at 99% confidence. **Significant at 95% confidence. *Significant at 90% confidence.
Discussion
Our results show that local DTC agricultural production and local milk production have a positive impact on the probability that a school purchases ‘local’ non-milk and milk products, respectively, in which we consider ‘local’ to be within 100 miles. Our results also show that local production has a positive impact on the level of such purchases. One possible interpretation of our results is that they extend research findings that DTC markets foster entrepreneurial skills (Feenstra et al., Reference Feenstra, Lewis, Hinrichs, Gillespie and Hilchey2003), if those skills, in turn, allow DTC farmers to access intermediated markets. We view this interpretation as plausible since accessing intermediated markets of local foods require a high degree of managerial skills (Park et al., Reference Park, Mishra and Wozniak2014). The positive impact of local milk production on local fluid milk expenditures indicates that a high degree of agricultural production is a significant factor in influencing schools purchases of local foods. Thus, our results do not support some critiques of local school food programs, which have asserted that local school food purchases are bolstering inefficient or struggling local agricultural sectors (e.g., Lusk and Norwood, Reference Lusk and Norwood2011).
We find that the effects of local DTC agricultural production and local milk production on the predicted probability that a school purchases local foods to be modest. We also find an increase in local milk production would not have a high proportionally responsive impact on local fluid milk purchases by schools. This may be because there may not be opportunities for schools to expand local fluid milk purchases beyond existing levels if they are already buying a significant component of fluid milk locally and there is not a demand among students to drink milk in greater quantities. Our finding of a greater elasticity with regard to local DTC agricultural production, however, implies that non-milk products may represent a more promising opportunity for local food purchases by schools to increase.
Our county-level controls for average income and the percentage of residents in poverty, when statistically significant, had positive and negative signs, respectively. This suggests that schools in more prosperous regions are more likely to purchase local foods, which is a finding consistent with Lyson (Reference Lyson2016) and Dimitri et al. (Reference Dimitri, Hanson and Oberholtzer2012). While the percentage of students eligible for free and reduced-price meals decreases the predicted probability of a school making local non-milk purchases, it has a positive impact on the level of expenditures. A partial explanation for this finding is the positive correlation that the number of eligible students for free or reduced-price meals has with county-level income and percentage of residents in poverty, since eligible-meal students is statistically insignificant in the fluid milk OLS regression when these latter two variables are removed as controls. Another explanation is that while it may be challenging for less prosperous schools to purchase local foods due to fixed administrative costs, there may be greater opportunities to purchase local foods in poorer schools once these barriers are overcome. One possible reason is that property values surrounding these schools may be lower and activities like urban agriculture are more pronounced. Another possible policy-specific reason for this result is that it may be easier for poorer schools to obtain technical support and assistance with making local food purchases than other schools.
We also find that the number of students had a positive impact on local food expenditures, which is consistent with Botkins and Roe (Reference Botkins and Roe2015) and Ralston et al. (Reference Ralston, Beaulieu, Hyman, Benson and Smith2017). Population had a positive impact on expenditures, although it had a negative impact on the predicted probability that a school district sources local non-milk products. Again, a positive correlation between county-level population and school district size could cause this finding, as population was statistically insignificant in this specification when school size was removed as a control.
Conclusion
Enhancing the purchases of local foods by SFAs is a critical way to expand local and regional food systems, particularly given the anecdotal evidence suggesting that SFAs would make greater local food purchases if supply were available. Our study is one of the first papers to examine how local food purchases by intermediaries interact with local agricultural market sales. We show that while both the probability of purchasing local foods by schools and the level of purchases schools are influenced by local agricultural sales, the impacts are modest. We further demonstrate that local non-milk food purchases are more elastic with respect to local DTC production than the relationship between local milk purchases and local dairy production.
One possible explanation for the modest coefficient magnitudes could be because local farmers and farm organizations may not perceive that sales to schools is a priority, even though the Farm to School Census found that SFAs are interested in purchasing greater quantities of local foods if supply impediments were removed. Between 2013 and 2016, the USDA Farm to School Program (described in the background section) awarded 300 grants out of 1338 proposals (USDA FNS, 2016d). However, only 29 applications were received from agricultural producers or cooperatives in total during this 4-yr period, and just two of those proposed projects received grant awards. In contrast, school districts and non-profits received 80% of the grants. Thus, a combination of (a) undertaking greater outreach and engagement with local agricultural producers and cooperatives to inform them of resources available to facilitate greater sales to SFAs and (b) ensuring that available resources meet the needs of local agricultural producers and cooperatives could potentially help farmers take advantage of local school food marketing opportunities.
The Farm to School Census is one of the most comprehensive efforts to-date in measuring market activity for local food products purchased by intermediaries. Since the survey was covering a new subject matter and had an objective of attaining a high response rate, some of the responses to questions were non-standardized (e.g., respondents self-defined ‘local’) and the expenditure levels were self-reported estimates among two basic categories. Further data collection efforts that solicit more detailed information about the types of products purchased and supply chains utilized would allow researchers to estimate more specific relationships between how local food purchases by intermediaries are influenced by local supply conditions. Similar data collection efforts with grocery stores, restaurants, hospitals, distributors and other food service providers would also inform the viability of enhancing local food purchases among different types of institutions.
Acknowledgements
The authors appreciate extensive suggestions from Katherine Ralston on earlier versions of the paper. The authors also thank the participants at the 2017 SAEA Annual Meeting and the Renewable Agriculture and Food Systems editor and reviewers for helpful feedback. The views expressed are those of the authors and should not be attributed to the US Department of Agriculture.