BACKGROUND
Radiation therapy is an essential component of palliative care in oncology.Reference Lutz, Jones and Chow 1 The aim of treatment is to alleviate symptoms such as pain, bleeding and obstruction. As such, treatment should be prompt to provide relief as soon as possible. At our centre, conventional simulation is often used for palliative radiation treatment for bony lesions and the brain. Using fluoroscopy and correlating with diagnostic imaging such as bone and diagnostic CT scans, the treatment area can be easily localised using a patient’s bony landmarks. A simple dose calculation that takes into account the field size, shielding and treatment depth is then done, and the patient may proceed with treatment. This is a very efficient method; the standard booking interval between simulation and treatment at our centre is 1 day, but the whole process may be completed in 1–2 hours if necessary. This is ideal for acute situations such as haemorrhage or spinal cord compression.
However, when treatment is targeted at soft tissue (e.g., lung) rather than bones, localising the treatment region using fluoroscopy alone is tedious and may be impossible. In these cases, virtual simulation is preferred and has been shown to improve tumour volume coverage while reducing overall treatment field size.Reference Driver, Drzymala, Dobbs, Faulkner and Harris 2 , Reference Mcjury, Fisher and Pledge 3 This involves the use of a CT simulation scan to help identify the soft tissue targets. A simple treatment field arrangement is then placed on the digitally reconstructed radiograph (DRR) and no further dosimetric calculations are made (unlike 3D conformal radiotherapy). While this is a simpler process compared with formal 3D conformal radiotherapy, the standard workflow at our centre still demands 2 days for the above steps, as well as dosimetric checks, unit checks, generation and export of plans et cetera to be completed.
As such, we propose a novel method which combines the detailed soft tissue visualisation of CT planning with the simplicity and ease of conventional simulation. This reduces preparation time and improves target localisation for ‘urgent’ treatments. Our method involves importing recent diagnostic CT scans (done within a month or so) into the EclipseTM (Varian Medical Systems, Palo Alto, CA, USA) treatment planning system. This 1-month period was chosen because lung tumours (which comprise a large proportion of palliative cases at our centre) can show significant changes in size beyond that.Reference O’Rourke and Edwards 4 The treating radiation oncologist (RO) will then identify the target volume (TV) and define the treatment fields on the planning system. These fields will then be reproduced using conventional simulation according to the DRR generated from the planning system. We call this method ‘pre-planning’, because the RO can start work on the diagnostic scans even before the patient attends the actual simulation. When the patient arrives, the desired treatment fields have already been determined and are easily reproduced with the conventional simulator.
A potential limitation of this approach is that the electron density in the planning system may not be properly converted from the CT value of the diagnostic scans due to differences in machine settings. This would render any dose calculations inaccurate. However, while dose calculations are feasible for virtual simulation cases, they are just indicative, and not used for formal planning (hence the term ‘virtual’).
Of greater concern however is the accuracy of TV localisation, as the patient’s position during a diagnostic CT scan (arms raised on a curved couch) is slightly different from our standard palliative treatment position (arms by the side on a flat couch). We hypothesise that despite this differences, this approach is adequate and accurate enough for the purposes of palliative treatment. In this pilot study, we aim to quantify the inherent variability of using a diagnostic CT scan for target localisation, and demonstrate that this new method is feasible.
METHODS
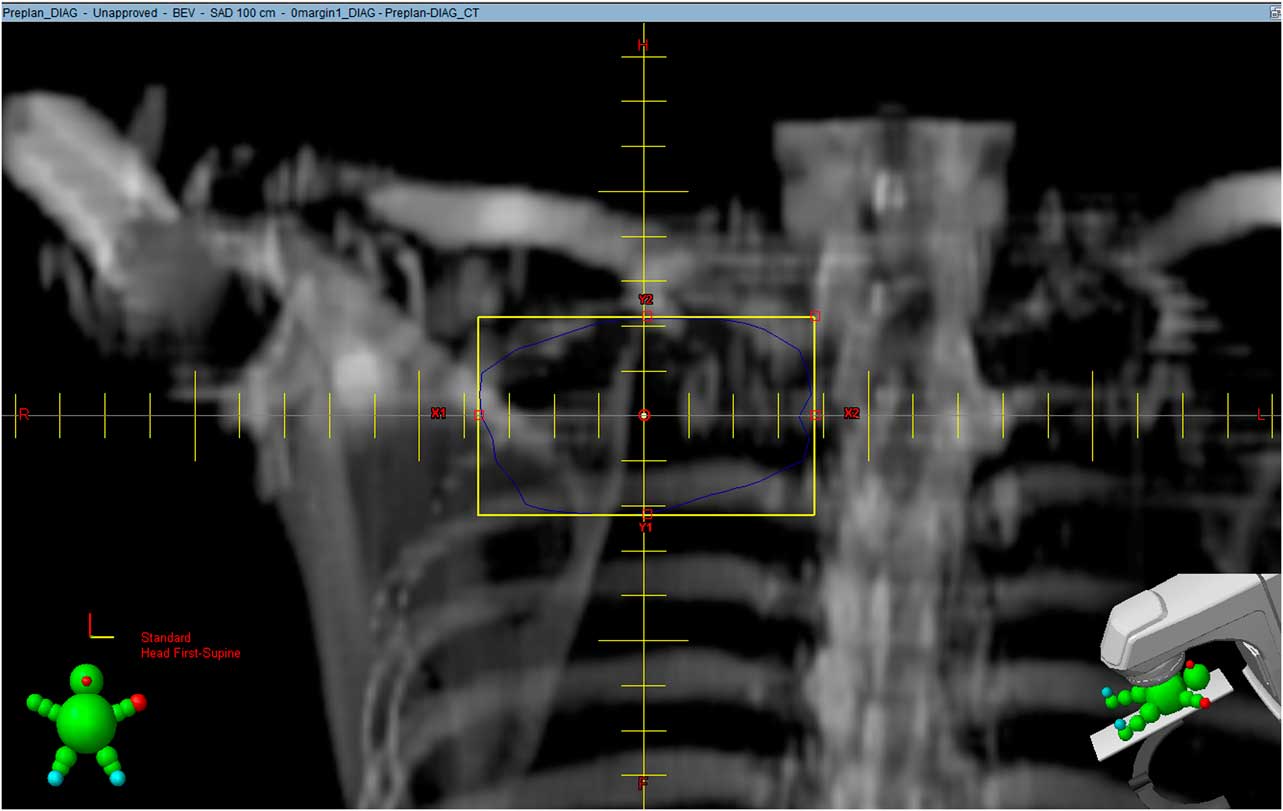
Approval was obtained from our institutional Centralised Institutional Review Board (CIRB). From October 2013 to June 2014, we randomly selected 12 patients who had undergone virtual simulation at our centre, and who had also had a diagnostic CT scan within a month prior to the simulation. Both sets of scans were retrieved retrospectively for the study. An independent radiation oncologist was tasked to identify the TVs on both the diagnostic scan and the CT simulation scan. DRRs for both scans were then generated and the relative positions of the two TVs were then compared. To simplify calculations and to approximate real-life palliative treatments, each irregularly shaped TV was represented by a ‘square’ field encompassing it with no margin (Figure 1), labelled as TVDIAG-0 and TVSIM-0, respectively.
Digitally reconstructed radiograph generated from diagnostic CT scan. The blue line represents the target volume drawn by a radiation oncologist while the yellow box is a ‘square’ field encompassing it with no margins.

Comparison was done by doing a 2D fusion of the two DRRs using Photoshop® CS5 (Adobe Systems, San Jose, CA, USA) v12.0. One DRR was applied over the other using the software and then scaled to the same magnification by matching the reticle scales of the respective DRRs. By adjusting the transparency of one image and inverting its colours, this can be done accurately and with ease. Applying a transparent mask over two quarters of one image creates a ‘checker box’ to allow matching of images. This is similar to performing image registration on MOSAIQ® (Elekta, Stockholm, Sweden), the information system and treatment software used at our centre. Matching was done by focusing mainly on relatively fixed bony structures such as the vertebrae; corrections were made for differences in rotation as well.
After fusion, the two overlapping ‘square’ fields represent the relative positions of the TVs during pre-planning (diagnostic CT scan) and during treatment (simulation CT scan). The overlapped area as well as the respective ‘square’ field areas can be obtained in pixels using Photoshop®.
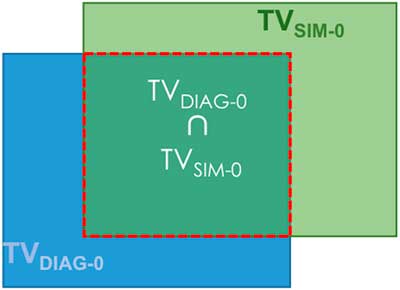
As most palliative treatments are done using single fields, or parallel opposed (AP/PA) fields prescribed to the mid-plane, comparing a 2D representation of the TV was deemed to be adequate. A 2D Conformity Index (2DCI) adapted from SALT-Lomax’s volume-based indexReference Feuvret, Noel, Mazeron and Bey 5 was generated for each pair of TVs (Figure 2):
 $$2{\rm DCI}\left( {0\,{\rm margin}} \right){\equals}{{{\rm TV}_{{{\rm DIAG}{\hbox\-}0}} \,{\cap}\,{\rm TV}_{{{\rm SIM}{\hbox\-}0}} } \over {{\rm TV}_{{{\rm SIM}{\hbox\-}0}} }}$$
Deriving 2D Conformity Index from overlapping square fields.
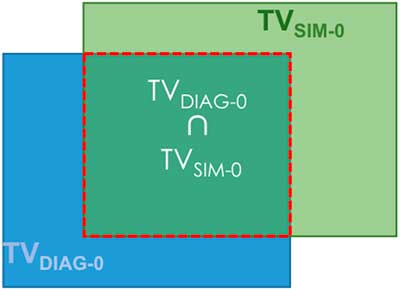
The ideal 2DCI is 1, where the TV localised on the diagnostic scan completely overlaps with that on the virtual simulation scan. This suggests that when the patient is set-up in the treatment position, the entire TV falls within the ‘pre-planned’ field generated on the diagnostic scan.
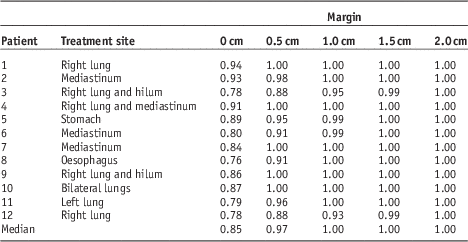
Additional margins of 0.5, 1.0, 1.5 and 2.0 cm were then added to each TVDIAG-0 and their respective 2DCIs were calculated. This was done to determine the size of the margin required to adequately cover the TV in cases where the 2DCI (0 margin) is <1. In other words, this is the additional margin needed to account for the uncertainties inherent in this method.
For example,
 $$2{\rm DCI}\left( {1.5\,{\rm margin}} \right){\equals}{{{\rm TV}_{{{\rm DIAG}{\hbox\-}1.5}} \,{\cap}\, {\rm TV}_{{{\rm SIM}{\hbox\-}0}} } \over {{\rm TV}_{{{\rm SIM}{\hbox\-}0}} }}$$
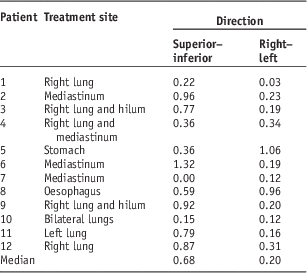
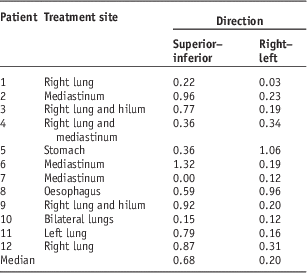
A simple analysis of the direction of deviation (offset) was also performed. The deviation of the centre of field (COF) of TVDIAG-0 from TVSIM-0 in the superior–inferior (SI) and right–left (RL) directions were measured and tabulated.
RESULTS
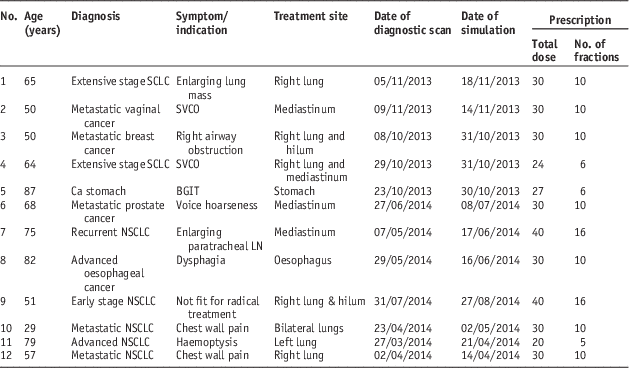
The characteristics of the 12 patients are tabulated in Table 1; 11 cases were thoracic treatments (lung or mediastinal masses) whereas one case involved the upper abdomen (stomach cancer). All of them received standard palliative radiation dose regimens, ranging from 20 Gy in five fractions to 40 Gy in 16 fractions.
Patient characteristics

Abbreviations: SCLC, small cell lung cancer; NSCLC, non-small cell lung cancer; SVCO, superior vena cava obstruction; BGIT, bleeding gastrointestinal tract; LN, lymph node.
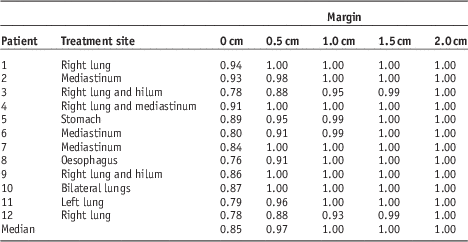
The median 2DCI (0 margin) was 0.85. For margins of 0.5, 1.0, 1.5 and 2.0 cm, the median 2DCIs were 0.97, 1, 1 and 1, respectively (Table 2).
2D Conformity Indices
The median displacement of the COF in the SI direction was 0.7 cm and that in the RL direction was 0.2 cm (Table 3).
Deviation of centre of field
DISCUSSION
In this era of advanced radiotherapy techniques such as intensity-modulated radiation therapy and stereotactic ablative radiotherapy, it is easy to overlook simple but effective radiotherapy techniques and practices. Our centre is the largest cancer centre in the country (and possibly the region), and is even in the process of setting up a proton therapy unit. It has two CT simulators and one conventional simulator; together, they handle ~1000 palliative cases a year currently. As our population ages, this number will inevitably increase and the pressure on treatment machines and staff is unlikely to ease. Our new method reduces the demand on CT simulators, and shortens the time from simulation to treatment. In addition, a contrast-enhanced diagnostic CT scan also allows for more accurate delineation of the TV, particularly useful in the treatment of lymph node masses. The standard virtual simulation scan is done without contrast at our centre; while contrast can be given on the RO’s request, using diagnostic scans spares the patient the need to fast for 4 hours and an additional needle prick, both of which are unpleasant experiences we often ignore.
Although costs was not the primary consideration, our ‘pre-planning’ method should also save the average patient about S$400 (USD $300) per treatment. This is not insignificant, as patients have often depleted their savings on costly systemic therapies by the time they reach palliative radiotherapy. Additional cost savings can also be achieved indirectly by our centre, in the form of reducing the need to purchase an additional CT simulator. Our new method hence provides a faster, more cost-effective and less resource-intensive way of palliative treatment, while decreasing hassle, discomfort and duplicate scans for patients.
The use of a ‘non-CT simulation’ scan for simulation to improve workflow and patient throughput is not unheard of. Wong RK et al.Reference Wong, Letourneau and Varma 6 reported the successful implementation of a streamlined one-step process toward palliative radiotherapy of bone metastases using treatment unit cone beam CT scans. In our approach however, there were more uncertainties to consider as the diagnostic scans were done some time before the actual treatment, and the CT couch surface is not flat. The median 2DCI (0 margin) of 0.85 suggests that the gross target volume may still be localised fairly accurately despite differences in patient set-up position and CT couch surface. Furthermore, the addition of a 0.5 cm margin would largely account for this minor variation (median 2DCI 0.97). In fact, the safe additional margin is likely less than 0.5 cm, although we did not do additional analysis at 0.1 cm intervals. We also note that the SI deviation is much greater than the RL deviation; this may be due to differences in the arm positions for the two scans (‘up’ on diagnostic scan and ‘down’ on virtual simulation scan). As such, it may be possible to (easily) reduce this additional margin in the SI direction, or all around, by simulating the patient in the ‘arms-up’ position.
We recognise that our new method has some inherent limitations, and may not be suitable for all tumour sites or clinical scenarios. For example, using it for simulation of the head and neck region is not recommended, as the degree of head tilt and rotation is difficult to reproduce. The stomach cancer case in our study also showed a greater than average variation between diagnostic CT scan and virtual simulation scan, likely because of differences in gastric distension. In another case, the size of a lung tumour was noted to have increased significantly in the space of less than a month. This method should therefore be used with caution for cancers with known aggressive clinical behaviour. Finally one should be aware that, because of differences in machine settings, the electron density in the treatment planning system may not be properly converted from the values obtained from the diagnostic CT scans. This results in uncertainty in dosimetric calculation, and limits treatment to basic field arrangements (commonly used in palliative cases). It would be unwise therefore to extend this method to 3D conformal planning and treatments.
The limitations of our study are as follows:
(1) This is a small pilot study involving only 12 patients.
(2) Even though the TVs were identified by an independent radiation oncologist, it is not possible to eliminate observer bias entirely.
CONCLUSION
Our pilot study suggests that our ‘pre-planning’ approach is feasible for appropriately selected patients, and should be further developed. We recommend adding an additional margin of up to 0.5 cm to ensure good coverage of the TV.
Acknowledgements
None.
Financial support
None.
Conflicts of Interest
None.
Sources of Support
None.