Introduction
Oil palm (Elaeis guineensis Jacq.) is the highest yielding oil crop with an average oil yield of 3.74 t/ha/year (Ben-Iwo et al., Reference Ben-Iwo, Manovic and Longhurst2016). High versatility and cost-effectiveness of oil it produces combined with increasing consumption by the growing world population make oil palm in greater demand. To boost oil palm production, breeding for yield improvement and expansion of planting area have been implemented. Originally, oil palm plantation is centred in the tropical zone where optimal growth conditions of oil palm are provided (Corley and Tinker, Reference Corley and Tinker2015). Due to the scarcity of available land in traditional cultivating areas, some efforts have been made to expand plantation into agricultural area with suboptimal conditions for oil palm. In Thailand, oil palm cultivation is concentrated in the southern region as the climatic conditions are in optimal ranges (Dallinger, Reference Dallinger, Colchester and Chao2011). However, recently the plantation has spread massively into a large area in the northern and northeastern Thailand where a long spell of dry weather usually occurs (Somnuek et al., Reference Somnuek, Slingerland and Grünbühel2016). Oil palm is known to be highly sensitive to drought. Growth and yield are reduced in poor water conditions (Carr, Reference Carr2011). In fact, about 30% of yield reduction resulting from 3- to 4-month dry period in Thailand has been reported (Palat et al., Reference Palat, Chayawat, Cledon and Corley2008). To reduce the deleterious effects of drought in oil palm industry, breeding programmes targeting improvement not only of yield but also of drought tolerance have been initiated in private and government research institutes (Corley et al., Reference Corley, Rao, Palat and Praiwan2017).
Since 1960s, all commercial oil palm planting material has been tenera, a high-yielding hybrid of dura as female parent and pisifera as male parent (Corley and Tinker, Reference Corley and Tinker2015). The improvement of tenera variety involves selection of the dura and pisifera populations followed by progeny testing. The relevant maternal dura and paternal pisifera palms of superior progenies are subsequently used for commercial production of tenera plant (Corley and Tinker, Reference Corley and Tinker2015). Even though proven to be successful, the expense associated with testing of large progeny populations makes selection with progeny test possible only to large-scale breeding operations. To develop accelerated and resource-effective breeding techniques for stress tolerance, breeders are interested in implementation of selection based on morphological, biochemical and physiological traits that contribute to stress tolerance (Barcelos et al., Reference Barcelos, de Almeida, Cunha, Lopes, Motoike, Babiychuk, Skirycz and Kushnir2015; Rival, Reference Rival2017). As evidenced in other crops, some stress-induced responses, for example, changes in photosynthesis, stomatal conductance and chlorophyll fluorescence, have been regarded as effective markers for rapid screening of germplasm (Longenberger et al., Reference Longenberger, Smith, Thaxton and McMichael2006; Zaher-Ara et al., Reference Zaher-Ara, Boroomand and Sadat-Hosseini2016). This indirect screening, however, has not been established in oil palm. This present study thus aimed to identify the contribution of some growth and physiological parameters to drought tolerance in oil palm seedling and to use those parameters to evaluate the drought tolerance potential of D × P progenies from breeding programme at the Prince of Songkla University. Early identification of drought-tolerant progenies is a potentially meaningful effort at reducing the number of progenies incorporated into field trials resulting in easier management and lower input needed to run oil palm breeding programme.
Materials and methods
Plant materials
Eight D × P progenies, designated as PSU-96, PSU-106, PSU-206, PSU-128, PSU-208, PSU-210, PSU-220 and PSU-206/1, were developed at the Prince of Songkla University, Thailand by crossing eight different selected dura (female parent) palms and one common pisifera (male parent) palm. The genetic materials used for developing studied populations were originally tenera × tenera populations collected from farmer plantation back in 1987 and have been through breeding and selection processes (Eksomtramage et al., Reference Eksomtramage, Songsri, Juntaraniyom, Tongkum, Nilnond and Chaumongkol2001) (online Supplementary Fig. S1). The genetic backgrounds of the mentioned germplasms were Deli dura and AVROS pisifera imported from Malaysia during 1980s–1990s as tenera hybrid to southern Thailand by commercial company. This experiment was performed as a factorial experiment in CRD with 10 replications and two factors included genotypes (eight progenies) and water regimes (100, 50 and 25% of field capacity which corresponded to control treatment, moderate and severe drought stresses, respectively). Three-month-old oil palm seedlings were selected according to their uniformity in size and transferred to plastic pots of 37 cm diameter and 27 cm height. The seedlings were acclimated to greenhouse conditions and watered daily for 30 d prior to water treatment. Three different water regimes were applied for 6 months to elucidate the responses of different oil palm genotypes to prolonged drought stress.
Data collection
SPAD values were measured using the chlorophyll meter developed by the Soil-Plant Analyses Development unit of Minolta Camera Company (SPAD 502). For each treatment, three oil palm seedlings were randomly selected for measurement. The SPAD values were means of three measurement points in the third fully expanded leaf from the apex.
The maximum quantum yield of photosystem II (Fv/Fm) was estimated according to van Kooten and Snel (Reference van Kooten and Snel1990) using a pulse amplitude modulated chlorophyll fluorometer (Mini-PAM, Walz, Effeltrich, Germany). The measurements took place between 10:30 and 12:00 h on three leaves per plant. Oil palm leaves were dark-adapted for at least 30 min using the dark-acclimation clips (DIVING-MLC and DIVING-LC, Walz, Effeltrich, Germany) prior to measurements. A decrease in dark-acclimated values of Fv/Fm have been widely used as an indicator of a decline in photosynthetic performance, indicating exposure to stress (Maxwell and Johnson, Reference Maxwell and Johnson2000)
Proline content was measured as described by Bates et al. (Reference Bates, Waldren and Teare1973). The proline concentration was determined from a standard curve and calculated on a fresh weight (FW) basis as follows:
 $$\eqalign{{\rm Proline} \big( {{\rm \mu mol}/{\rm g}\,{\rm FW}} \big) &= \big[ {\big( {{\rm \mu g}\,{\rm proline/ml} \times {\rm ml}\,{\rm toluene}} \big)}/\cr &\quad115.5\,{\rm \mu g/\mu mol}\big] / \big[\big( {{\rm g}\,{\rm FW}} \big)/5 \big].}$$
Growth characters were measured on three oil palm seedlings randomly selected from each treatment. Plant height (PH), number of leaves per plant (NL), stem diameter (SD), leaf area (LA), fresh weight (FW) and dry weight (DW) were measured at 3-month intervals. The PH was measured from the base of the plant to the tip using a metallic measuring tape. The SD was measured using calipers at 1.5 cm above the soil surface. The shoots and roots were weighed separately (FW), then dried for 48 h at 65°C and weighed again (DW). The LA of the oil palm seedlings was measured using a LA meter DT-scan (Delta-T Scan®, Delta-T Devices Ltd., Cambridge, UK).
Drought tolerance index
To assess the drought tolerance of different genotypes, a drought tolerance index (DTI) was used in this study. The DTI was calculated according to Fernandez (Reference Fernandez and Kuo1992) using the following formula:
 $${\rm DTI} = (Y_{\rm s} \times Y_{\rm p})/\bar Y_{\rm p}^2, $$
where Y s, Y p and  $\bar Y_{\rm p}$ represent the value of the trait in stress and non-stress conditions for each genotype and the mean of the value of the trait in non-stress condition of all genotypes, respectively.
Statistical analysis
The data were analysed using analysis of variance (ANOVA) at the 5% level, followed by Tukey's post hoc test if there were significant differences among the treatments. Heat map and hierarchical clustering as well as principle component analysis was performed using the ClustVis software (Metsalu and Vilo, Reference Metsalu and Vilo2015). Drought tolerance ranking based on the integrated PCA values was calculated according to Liu et al. (Reference Liu, Zhang, Tran, Shan, Kim, Childs, Ervin, Frazier and Zhao2015).
Results
Analysis of variance
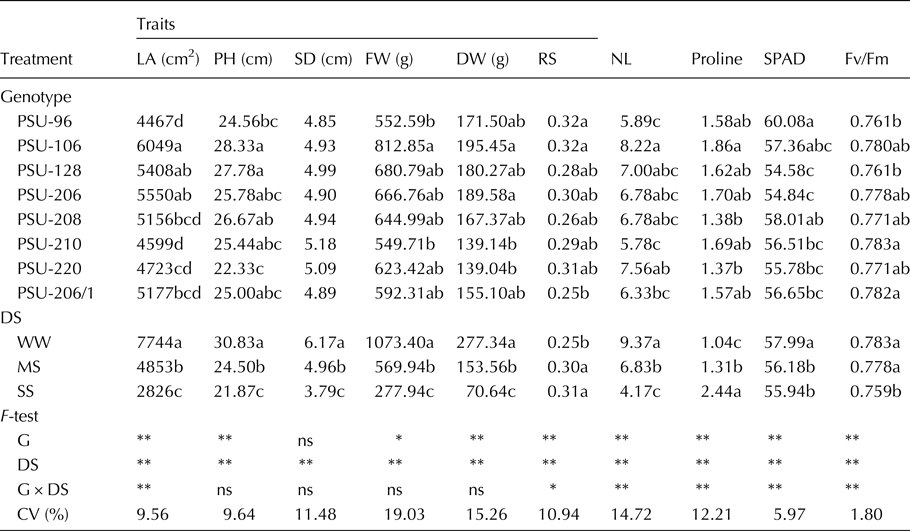
After 3 months of treatment, ANOVA showed that significant differences between water treatments were detected for all the traits except for the SPAD readings. Progeny genotype had significant effects on six out of 10 parameters. These six parameters were LA, DW, RS, NL, proline content and SPAD values. The genotype × drought severity interactions were significant for LA, NL and proline content (online Supplementary Table S1). Different watering regimes were continued for another 3 months. The ANOVA results revealed that, after 6 months of water treatment, all growth and physiological traits measured were significantly affected by drought severity (Table 1). Except for RS, the rest growth traits and photosynthesis-related traits (Fv/Fm and SPAD value) were reduced in the water-stressed conditions. Proline content, on the contrary, increased in response to water limitation (online Supplementary Table S2). Significant genetic variations were detected in the majority of traits (except for SD) allowing for drought tolerance selection. LA, RS, NL, proline content, SPAD value and Fv/Fm were influenced by progeny genotype × drought stress interactions.
Analysis of variance, means and coefficients of variation (CV) for leaf area (LA), plant height (PH), stem diameter (SD), fresh weight (FW), dry weight (DW) and number of leaves per plant (NL), root-to-shoot ratio (RS), proline content (in μmol/g FW), SPAD value and Fv/Fm for eight oil palm progenies (G) after 6 months of growing under three drought severity (DS) conditions: well-watered (WW), moderate stress (MS) and severe stress (SS)

Means with the same letter in the same column and within the same attribute are not significantly different at a probability level of 0.05 (the Tukey test); ns represents no significance; *represents significant difference at P ⩽ 0.05 and **represents significant difference at P ⩽ 0.01.
Identification of key parameters for the evaluation of drought tolerance using clustering and PCA
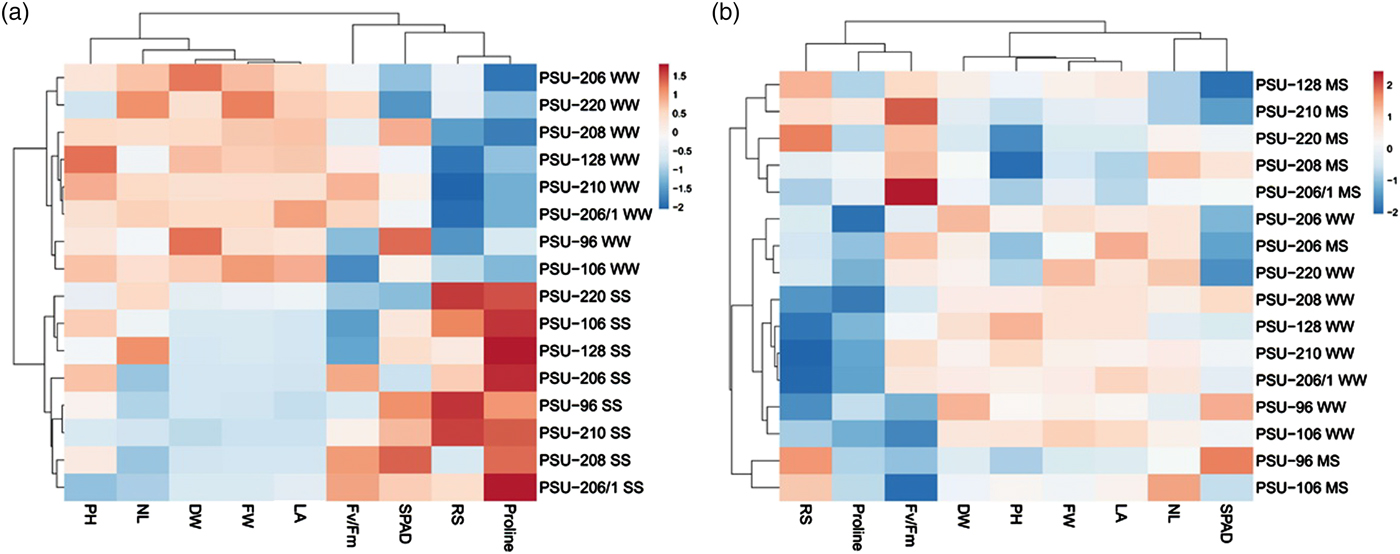
As effects of genotype and water stress on growth and physiological traits were more pronounced after 6 months of stress exposure than those observed after 3 months, further analysis was then performed using the normalized trait values determined at 6-month time point. Heat maps and hierarchical clustering of growth and physiological parameters of eight D × P progenies grown under WW and drought-stressed conditions were plotted to identify key parameters for assessing drought tolerance in the oil palm seedlings (Fig. 1). Considering the responses of D × P progenies from WW and SS treatments, hierarchical cluster analysis separated D × P progenies into two groups according to moisture levels being exposed (Fig. 1(a)). As expected, growth parameters including NL, FW, DW, LA and PH were reduced under SS condition. In contrast to growth traits, the proline content and RS increased under severe stress. Fv/Fm and SPAD values were not consistently different between the two irrigation levels (Fig. 1(a)).
Heat map and hierarchical clustering for growth and physiological traits under well-watered and severe drought-stressed conditions (A) as well as under well-watered and moderate drought-stressed conditions (B) in eight D × P progenies after 6 months of treatment. Progenies followed by WW, MS and SS represent progenies grown under well-watered, moderate and severe drought-stressed conditions, respectively. LA, leaf area; PH, plant height; SD, stem diameter; FW, fresh weight; DW, dry weight; NL, number of leaves per plant; RS, root-to-shoot ratio. Scale: from brightest blue equals most decreased to brightest red equals most increased.

The MS condition, however, did not clearly differentiate the growth and physiological responses of D × P seedlings from those under WW condition. Overall, proline content, RS and Fv/Fm were slightly increased under MS condition. Growth parameters and SPAD values were scarcely changed with the reduction of water availability. The eight D × P progenies grown under WW condition and the PSU-206 grown under MS were clustered together indicating minimal effect of MS to PSU-206 (Fig. 1(b)). The PSU-96 and PSU-106 under MS were grouped together, whereas the rest of the five genotypes under MS were clustered into one group. These results clearly demonstrated that D × P progenies responded differently under MS and SS conditions.
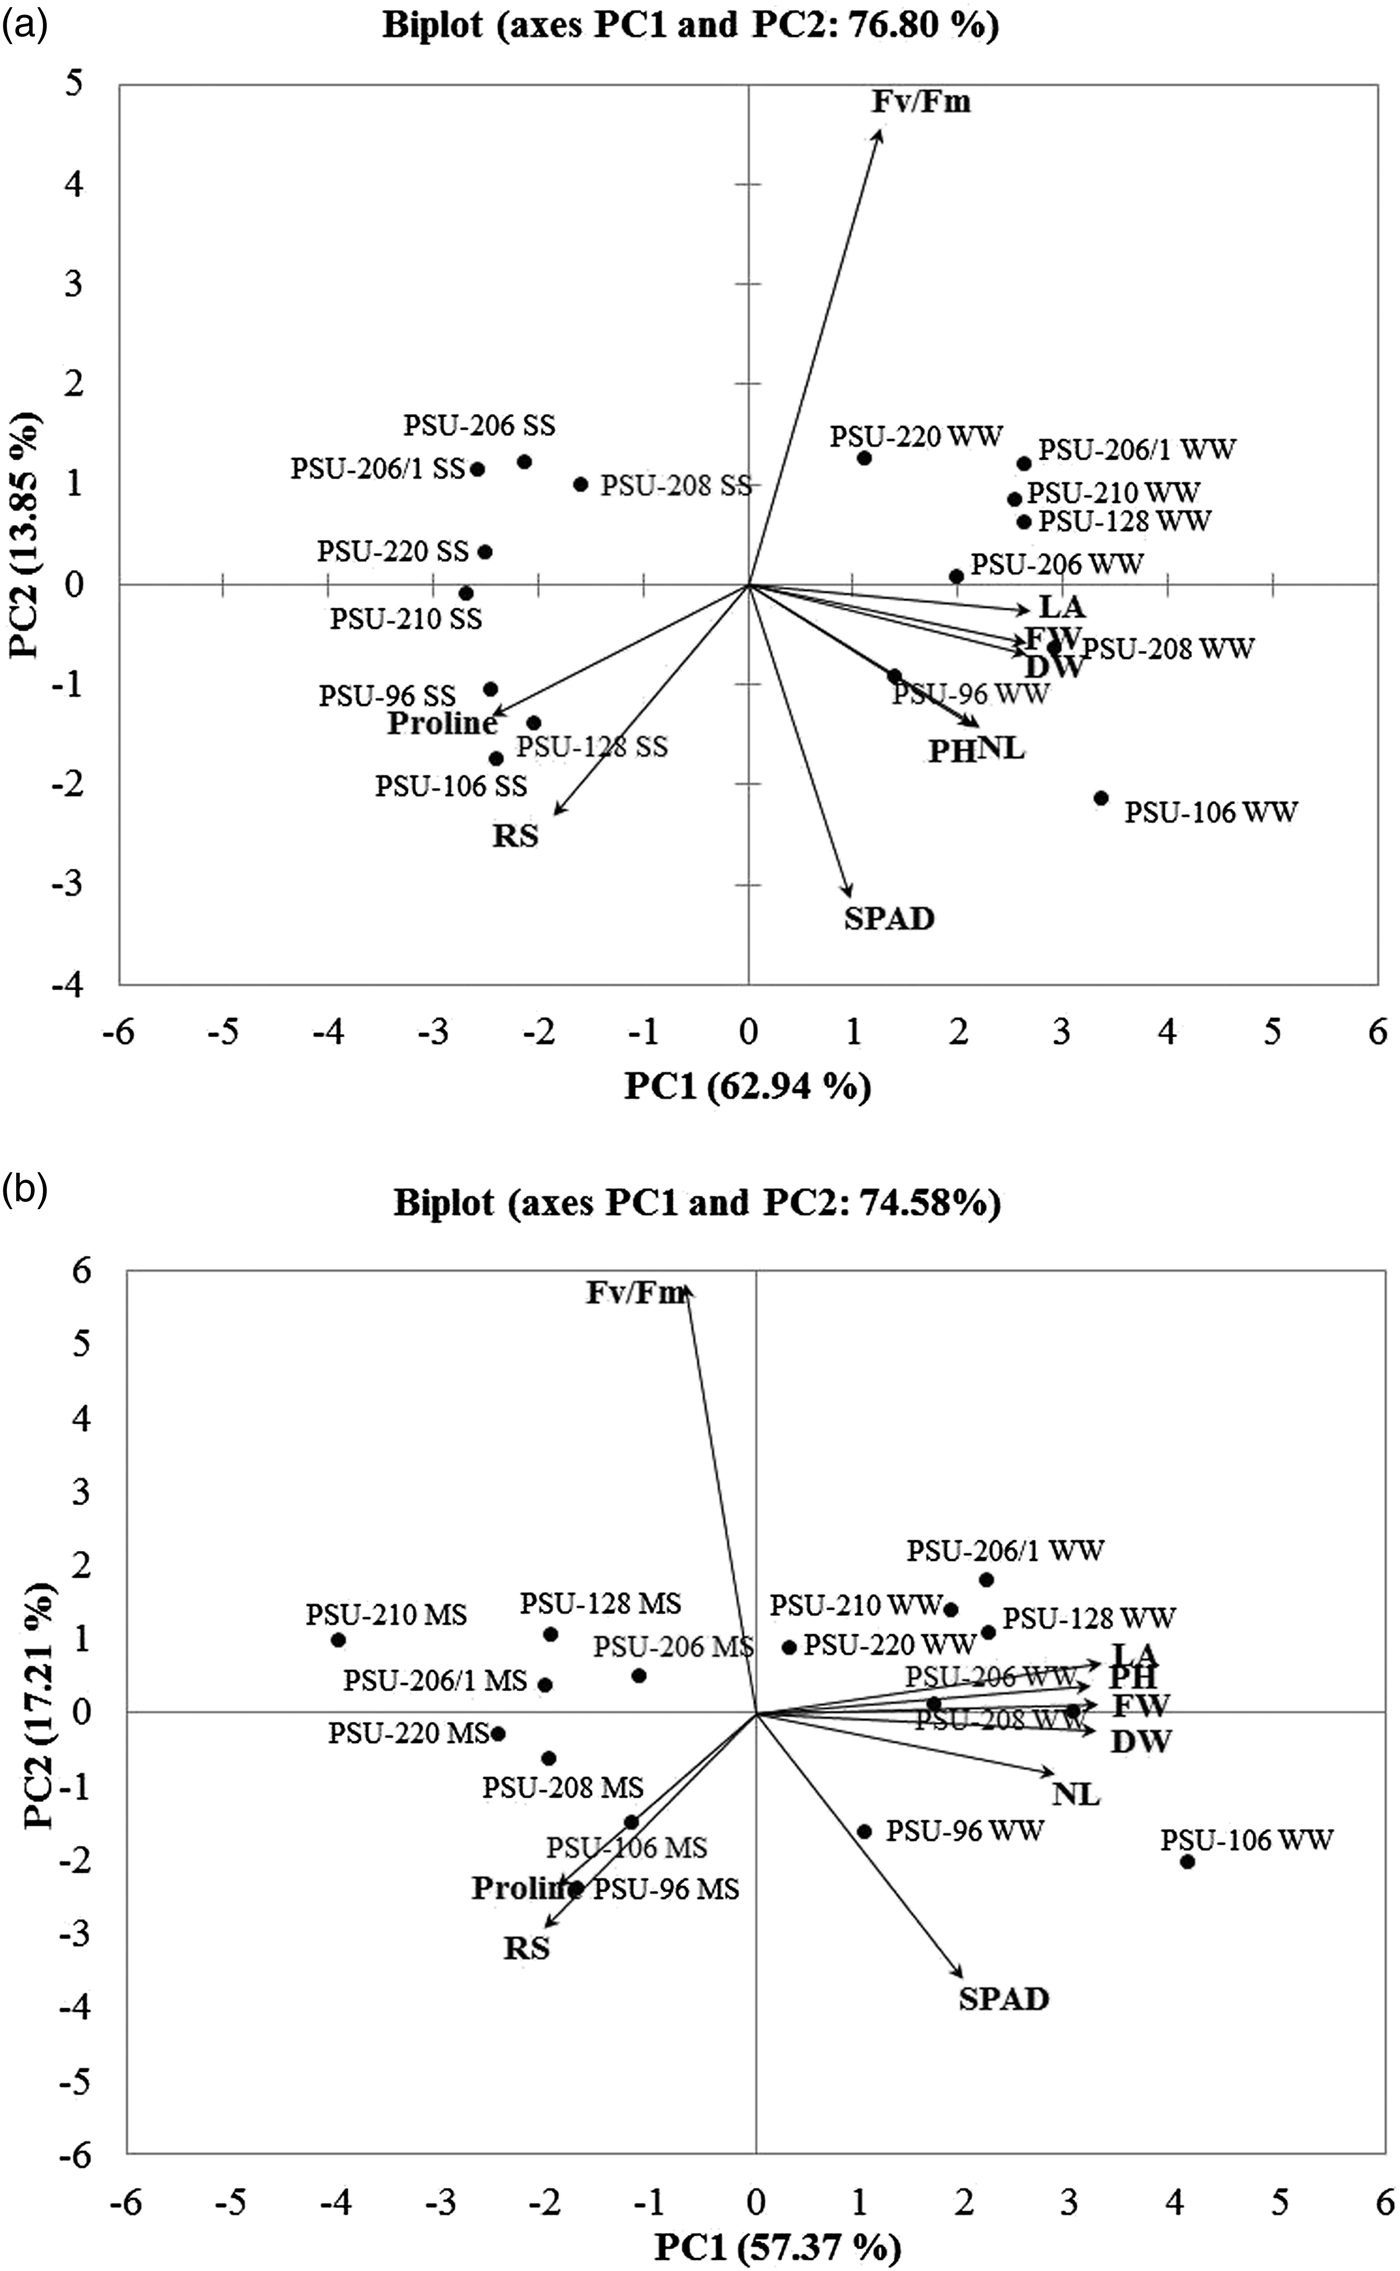
Principal component analysis (PCA) was performed to evaluate the contributions of each parameter to differences between the control and drought-stressed plants. According to the analysis of data from the WW and SS conditions, PC1 and PC2 explained 62.94 and 13.85% of total variability, respectively (Fig. 2(a)), whereas under the WW and MS conditions, PC1 and PC2 accounted for 57.37 and 17.21% of total variability, respectively (Fig. 2(b)). All the genotypes exposed to SS and MS shifted towards the negative side of PC1, while under WW condition, all genotypes remained on the positive side (Fig. 2). In the WW and MS conditions, PC1 was highly correlated with growth traits (FW, DW, NL, PH and LA) (online Supplementary Table S3). Whereas, in the WW and SS conditions, PC1 was highly correlated with FW, DW, NL, PH, LA, RS and proline content (online Supplementary Table S3). Therefore, a total of five (FW, DW, NL, PH and LA) and seven (FW, DW, NL, PH, LA, RS and proline content) parameters were included in the further analysis of moderate and severe drought stress tolerance, respectively.
Principal component analysis biplot of growth and physiological traits of eight D × P progenies under well-watered and severe drought-stressed conditions (A) as well as under well-watered and moderate drought-stressed condition (B) after 6 months of treatment. LA, leaf area; PH, plant height; SD, stem diameter; FW, fresh weight; DW, dry weight; NL, number of leaves per plant; RS, root-to-shoot ratio.

DTIs for growth and physiological parameters and drought tolerance group clustering
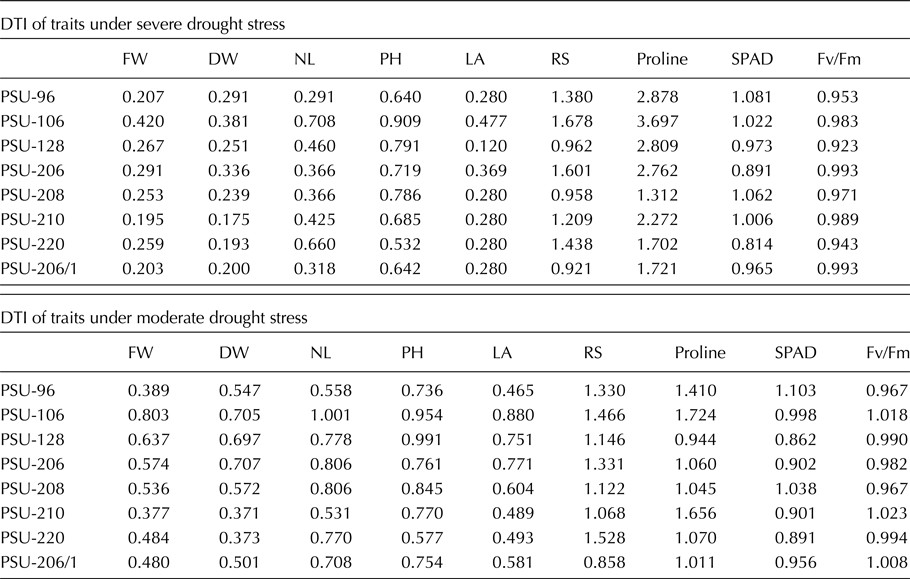
DTIs based on growth and physiological traits under stressed and non-stressed conditions were used to identify tolerant progenies. DTIs of progenies under WW and MS treatments were generally higher than those under WW and SS treatments except for the proline content and RS (Table 2). In the SS condition, the DTIs based on FW, DW, NL, PH, LA, RS and proline content were included in the PCA to identify genotypes with similar responses and hence drought tolerance potential. PCA analysis yielded two PCs (PC1 and PC2) with Eigen values higher than 1. PC1 and PC2 explained 61.39 and 15.95% of the variance, respectively (online Supplementary Table S4). FW, DW and proline content contributed most importantly and positively to PC1 indicating that the genotypes with greater PC1 values accumulate more FW and DW as well as higher proline content under WW and SS conditions. A negative correlation was observed between PC2 and NL, whereas the variations for LA and RS were distributed among both PCs. Under the SS condition, the PCA biplot clustered the eight oil palm progenies into two groups. PSU-106 and PSU-206 were positively correlated with PC1 suggesting high tolerance to drought. The rest progenies, namely, PSU-96, PSU-128, PSU-208, PSU-210, PSU-220 and PSU-206/1, were clustered together and were negatively correlated with PC1 (Fig. 3(a)).
Principal component analysis biplot of the drought tolerance indices of growth and physiological traits of eight D × P progenies after 6 months of severe drought stress (A) and moderate drought stress (B). LA, leaf area; PH, plant height; SD, stem diameter; FW, fresh weight; DW, dry weight; NL, number of leaves per plant; RS, root-to-shoot ratio.

Drought tolerance index (DTI) calculated based on proline content, SPAD value, Fv/Fm and growth traits after 6 months of moderate and severe drought treatment

In the MS condition, the DTIs based on FW, DW, NL, PH and LA were included in the PCA analysis. PC1 and PC2 collectively explained 93.60% of the variance (online Supplementary Table S4). PC1 accounted for 80.80% of the variation, mainly contributed by LA. PSU-106 was identified as the most tolerant genotype in the MS condition, while PSU-128, PSU-206 and PSU-208 were moderately tolerant (Fig. 3(b)).
Drought tolerance ranking based on the integrated PCA values method
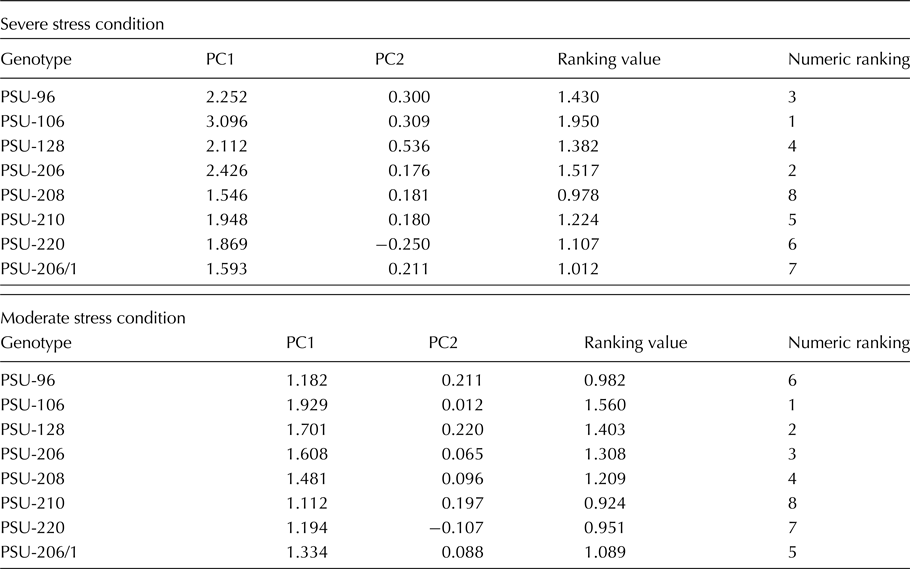
The ranking method proposed by Liu et al. (Reference Liu, Zhang, Tran, Shan, Kim, Childs, Ervin, Frazier and Zhao2015) was used to comprehensively evaluate the relative drought stress of the eight oil palm progenies. In the SS condition, PCA based on DTIs of FW, DW, NL, PH, LA, RS and proline content revealed that the first two components (PC1 and PC2) contributed 77.34% to the variance (online Supplementary Table S4). Therefore, the following formulae were developed accordingly: (1) PC1 = (0.45 × DTIFW) + (0.43 × DTIDW) + (0.29 × DTINL) + (0.31 × DTIPH) + (0.37 × DTILA) + (0.38 × DTIRS) + (0.39 × DTIProline); (2) PC2 = (0.03 × DTIFW) + (0.25 × DTIDW) + (−0.44 × DTINL) + (0.63 × DTIPH) + (0.29 × DTILA) + (0.46 × DTIRS) + (0.23 × DTIProline). The ranking values for each genotype were then calculated using the following formula: ranking value = (61.39% × PC1) + (15.95% × PC2). In the MS condition, PC1 and PC2 explained 93.60% of the variance and the formulas used were as follows: PC1 = (0.48 × DTIFW) + (0.44 × DTIDW) + (0.43 × DTINL) + (0.39 × DTIPH) + (0.49 × DTILA); (2) PC2 = (−0.26 × DTIFW) + (0.31 × DTIDW) + (−0.61 × DTINL) + (0.68 × DTIPH) + (−0.04 × DTILA). Ranking values were calculated as follows: ranking value = (80.80% × PC1) + (12.80% × PC2). According to the ranking values, PSU-106 ranked the highest in drought tolerance under both SS and MS conditions (Table 3). Progenies with the second and the third most tolerant potential were PSU-206 and PSU-96 in the SS condition and were PSU-128 and PSU-206 in the MS condition. Interestingly, PSU-208 was moderately tolerant to drought in the MS condition but was sensitive to the SS condition (Table 3).
The PCA ranking values of eight oil palm D x P progenies under severe and moderate stress conditions

Discussion
Early drought tolerance screening by exposing young seedlings to water stress in controlled condition has been applied as part of the breeding programme for drought-tolerant varieties in crops such as cotton, coconut and citrus (Longenberger et al., Reference Longenberger, Smith, Thaxton and McMichael2006; Zaher-Ara et al., Reference Zaher-Ara, Boroomand and Sadat-Hosseini2016). This approach has advantages of low cost – and space – requirement, faster and less laborious method compared with yield performance screening. As drought tolerance is a complex trait controlled by multiple genes, numerous growth and physiological changes are observed in plants in response to drought (Guo et al., Reference Guo, Baum, Grando, Ceccarelli, Bai, Li, von Korff, Varshney, Graner and Valkoun2009; Harb et al., Reference Harb, Krishnan, Ambavaram and Pereira2010; Blum, Reference Blum2011; Osakabe et al., Reference Osakabe, Osakabe, Shinozaki and Tran2014). Also, several studies have demonstrated that the ability to maintain growth and key physiological processes indicates the potential for sustained productive ability in genotypes providing breeders an alternative approach of indirect selection for tolerance to stress (Manavalan et al., Reference Manavalan, Guttikonda, Tran and Nguyen2009; Reynolds et al., Reference Reynolds, Manes, Izanloo and Langridge2009). Studies in coconut suggested that chlorophyll fluorescence transients are important traits that can be used to differentiate and screen the coconut seedlings with drought tolerance (Kasturi et al., Reference Kasturi, Naresh, Rajagopal and Vijayakumar2007). Zaher-Ara et al. (Reference Zaher-Ara, Boroomand and Sadat-Hosseini2016) reported that seedling screening based on DW, FW, shoot and root length, tissue water content and osmolyte accumulation during water stress successfully clustered 10 citrus into three groups differing in their tolerance to osmotic stress.
In oil palm, several authors have reported variation in morphological and physiological responses to drought (Mendez et al., Reference Mendez, Chacon, Bayona and Romero2012; Silva et al., Reference Silva, Cosme, Rodrigues, Detmann, Leao, Cunha, Festucci-Buselli, Damatta and Pinheiro2017). In the present study, seedlings of eight oil palm F1 D × P progenies were evaluated for drought tolerance based on growth and some physiological parameters under MS and SS conditions. As expected, SS caused larger reductions in all growth traits compared with MS (Table 1). Proline content increased in response to water restriction, which is consistent with the previous reports by Cha-um et al. (Reference Cha-um, Takabe and Kirdmanee2012), Cao et al. (Reference Cao, Sun, Shao and Lei2011) and Jazayeri et al. (Reference Jazayeri, Rivera, Camperos-Reyes and Romero2015). The accumulation of proline in response to stress is a common phenomenon in plants and has been used as an indicator for the selection of stress-tolerant genotypes in plant breeding (Abebe et al., Reference Abebe, Guenzi, Martin and Cushman2003; Bowne et al., Reference Bowne, Erwin, Juttner, Schnurbusch, Langridge, Bacic and Roessner2012; Mwadzingeni et al., Reference Mwadzingeni, Shimelis, Tesfay and Tsilo2016; Zaher-Ara et al., Reference Zaher-Ara, Boroomand and Sadat-Hosseini2016). The increase of RS indicates the adaptation of plants to low soil moisture content. In this study, the increase in RS resulted from a relatively larger decrease in shoot growth than in root growth rather than an increase in root growth (data not shown), suggesting that water stress had a greater influence on oil palm shoots than roots. Thus, the screening of drought tolerance in oil palm seedlings should preferably emphasize above-ground traits. From this present study, the slight changes in the Fv/Fm and SPAD value induced by MS indicated the insensitivity of these parameters to non-severe drought stress, which may possibly hinder the genotypic variation of different oil palm progenies in response to water-limited conditions. Similar results were reported by Suresh et al. (Reference Suresh, Nagamani, Kantha and Kumar2012) who evaluated the photosynthetic activity responses of five oil palm tenera hybrids to water deficit and found that water withholding for 12 d did not affect the maximum efficiency of photosystem II (Fv/Fm) but strongly impaired leaf water potential, stomatal conductance and photosynthetic rate of oil palm seedling studied. Therefore, gas-exchange parameters might be more useful for drought tolerance screening in oil palm than the Fv/Fm. Previous studies have reported genotypic variation of oil palm response to water stress and drought tolerance was defined as less membrane damage and protein loss, greater leaf water potential and higher total root length (Cornaire et al., Reference Cornaire, Daniel, Zuily-Fodil and Lamade1994; Asemota and Canaire, Reference Asemota and Canaire2010; Nodichao et al., Reference Nodichao, Chopart, Roupsard, Vauclin, Ake and Jourdan2011). In our studies, the poor performance in the growth of seedlings under stress condition may likely be due to a reduction in the LA, which resulted in a decreased light interception capacity and hence total photosynthesis (Nogues and Baker, Reference Nogues and Baker2000; Weraduwage et al., Reference Weraduwage, Chen, Anozie, Morales, Weise and Sharkey2015). Even though eight oil palm progenies were derived from the same genetic backgrounds of Deli dura and AVROS Pisifera, genotypic variation was observed due to the nature of high heterozygosity and early generations of oil palm breeding programme. The ANOVA revealed the presence of genotype × drought stress interactions suggesting that progenies respond differently in different soil moisture levels (Table 1). Therefore, the evaluation of drought tolerance in the MS and SS conditions should be determined separately, as inconsistent responses of some progenies relative to others are likely to occur.
When the analysis involves multiple parameters, PCA is considered a powerful method for analysing and interpreting the data. This method was successfully used as a multivariate analysis to cluster genotypes according to their stress resistance levels as measured by various phenotypes under either controlled or field conditions (Liu et al., Reference Liu, Shi, Zhang and Huang2010; Chunthaburee et al., Reference Chunthaburee, Dongsansuk, Sanitchon, Pattanagul and Theerakulpisut2016). At the present study, PCA successfully clustered eight oil palm D × P progenies into two groups based on DTIs calculated from growth traits (FW, DW, NL, PH, LA and RS) and proline content of seedlings under WW and SS conditions (Fig. 3(a)). PSU-106 and PSU-206 were grouped together and showed better growth and higher accumulation of proline compared with the rest progenies. Relative drought tolerance of eight progenies was achieved using integrated PCA ranking values. The progenies ranked from the highest to lowest severe drought tolerance following the order PSU-106, PSU-206, PSU-96, PSU-128, PSU-210, PSU-220, PSU-206/1 and PSU-208. Successful clustering was also obtained using PCA on DTIs of five growth traits (FW, DW, NL, PH and LA) under WW and MS conditions (Fig. 3(b)). PSU-106, PSU-120, PSU-206 and PSU-208 were clustered together. These progenies accumulated more biomass than PSU-206/1, PSU-220, PSU-96 and PSU-210, which were clustered together on the negative side of PC1. Overall, these results indicated the possibilities of using DTIs, hierarchical clustering and PCA based on alterations in growth and physiological traits under stress compared with the control conditions to evaluate drought tolerance in oil palm seedlings. Field trials are recommended to validate the correlation between seedling and maturity stage screening results. In severe drought-prone areas with a wide variability of rainfall and long periods of water scarcity, PSU-106 and PSU-206, along with two to three progenies identified as susceptible to severe drought should be included into the field trials. While in moderately drought areas where the annual rainfall is <2000 mm without marked dry season, PSU-106, PSU-128, PSU-206 and a few susceptible progenies rated by seedling screening should be tested. Growth and yield of the tested progenies will be recorded over multiple years and analysed for correlation with seedling stage data.
Conclusions
Severe and moderate drought stresses negatively affected growth, Fv/Fm and SPAD value of the eight oil palm D × P progenies. Proline content and RS were enhanced in response to water restriction. Five growth characters (FW, DW, NL, PH and LA) rather than physiological traits were main contributions towards the variation of oil palm seedlings under WW and MS conditions, while most of the variation of seedlings under WW and SS conditions was explained by FW, DW, NL, PH, LA, RS and proline content. Therefore, different numbers of parameters were included in the subsequent analysis to evaluate drought tolerance potential in two different drought stress levels. DTIs, PCA analysis and the integrated ranking method showed that PSU-106 and PSU-206 were identified to be potentially tolerant to SS. In the MS condition, the highest tolerant progeny was PSU-106 followed by PSU-128, PSU-206 and PSU-208.
Supplementary material
The supplementary material for this article can be found at https://doi.org/10.1017/S1479262118000151
Acknowledgements
This work was supported by the Higher Education Research Promotion and National Research University Project of Thailand, Office of the Higher Education Commission and Oil Palm Agronomical Research Center: Phase 2, Faculty of Natural Resources, Prince of Songkla University. The authors would like to thank Mr Michael Currie, from the Publication Clinic, Research and Development Office, Prince of Songkla University, for proofreading the manuscript.