I. INTRODUCTION
In a CdS/CdTe solar cell, during the cell film deposition and postgrowth heat treatment, a mixed CdSxTe1–x interfacial layer was formed at the CdS/CdTe interface through interdiffusion.Reference Lane1–Reference Fischer, Anthony and Compaan6 This interfacial layer is generally believed to be beneficial to the cell energy-conversion efficiency. Through interfacial layer formation, the large lattice mismatch between CdS (a wurtzite = 4.14 Å and a zincblende = 4.57 Å) and CdTe (a wurtzite = 5.84 Å and a zincblende = 6.48 Å) and the defect density at the interface can be largely relieved and reduced, respectively. Sulfur diffusion was reported to be essential for making carrier lifetime comparable to that observed in high-efficiency solar cells.Reference Metzger, Albin, Romero, Dippo and Young2 The degree of interdiffusion will certainly shift the electrical junction away from the metallurgical interface and have major effects on the cell performance. The degree of interdiffusion at the CdS/CdTe interface depends on the film growth- and cell-processing parameters. Interdiffusion consumes the CdS film, which has a thickness of ∼80–200 nm in a CdTe solar cell, during both CdTe growth and postgrowth heat treatment processes. A thinner CdS layer improves cell quantum efficiency at short wavelengths and thus increases the short circuit current. However, as the CdS layer is thinned either by the initial deposition design or by postgrowth interdiffusion, the probability of pinhole formation in CdS film increases significantly. The cell open-circuit voltage (V oc) and fill factor can be consequently decreased. To obtain a high efficient solar cell, the CdTe absorber layer usually needs a CdCl2 postdeposition annealing treatment at a relatively high temperature of ∼400–450 °C.Reference Wu, Asher, Levi, King, Yan, Gessert and Sheldon7, Reference Tsuji, Aramoto, Ohyama, Hibino and Omura8 The CdCl2 treatment enhances the interdiffusion between CdS and the neighboring layers of both the transparent conducting layer (TCO) and the CdTe absorber layer.Reference Wu, Asher, Levi, King, Yan, Gessert and Sheldon7 The most common experimental method used to study the interdiffusion is the secondary-ion mass spectrometry.Reference Metzger, Albin, Romero, Dippo and Young2, Reference Feng, Chou, Rohatgi, Lim, Wee and Tan3 Concerning the interdiffusion and its related reactions at the CdS/CdTe interface, systematic studies are still needed to address the questions such as when the interdiffusion begins, how to exactly control it, and what effect it has on the performance of a solar cell. In this report, we designed an inversed CdTe solar cell stacking structure, which allowed us to use the convenient experimental methods, such as Raman scattering, x-ray diffraction (XRD), scanning electron microscopy (SEM), and x-ray photoelectron spectroscopy (XPS), to qualitatively study the interdiffusion. The inversed CdTe solar cell stacking structure allowed us to get relatively strong scattering signals from the CdTe/CdS interface by using the aforementioned experimental methods.
II. EXPERIMENTAL DETAILS
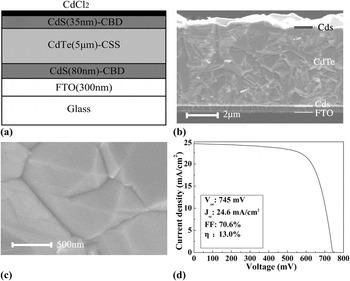
The structure designed for the interdiffusion study is Glass/SnO2:F(FTO)/CdS/CdTe/CdS, which is schematically shown in Fig. 1(a). Both the window and the top CdS films were prepared by chemical bath deposition (CBD).Reference Chu, Chu, Schultz, Wang and Wu9 An ammonia–thiourea aqueous solution made of deionized water (DI), ammonium hydroxide, cadmium acetate, ammonium acetate, and thiourea was mixed in a glass cell for CBD. After the CdS deposition, the samples were rinsed with DI water and dried with nitrogen gas. The window CdS layer, which had a thickness of about 80 nm, was then spin-coated with a saturated CdCl2–methanol solution before being transferred into a tube furnace for heat treatment in air. The CdS layer was etched in hydrazine hydrate for 10 min to remove the oxides formed on the surface during the heat treatment. Finally, the CdS layer was rinsed with DI water. After CdCl2 annealing, the CdTe absorber layer was deposited in a close-spaced sublimation (CSS) apparatus on the Glass/SnO2:F/CdS template. The substrate temperature during the CSS process was 550 °C. The space between the source and the substrate was 3 mm. The deposition atmosphere was a mixture of O2 and Ar. The total pressure of O2 and Ar was 2000 Pa with an O2 partial pressure of 200 Pa. The thickness of the CdTe absorber was ∼5 μm. Finally a 35-nm-thick CdS film was deposited on the Glass/SnO2:F/CdS/CdTe template by the same CBD process and was coated with a saturated CdCl2–methanol solution. The whole structure was then placed in a tube furnace for heat treatment in air or in an Ar-protective atmosphere.
Raman scattering measurements were carried out using a LABRAM-HR micro-Raman system (HORIBA Jobin Yvon; France), which is equipped with lasers with wavelength of 514.5 nm. The laser beam diameter is ∼7 μm. The Raman spectroscope has a computer-controlled cooling and heating system with a temperature ranging from 20 to 450 °C. In situ Raman spectra were taken during the heating of the film stack. Ex situ Raman scattering experiments were carried out at room temperature after the film stacks were annealed at different temperatures. High-resolution XRD, SEM, and XPS were carried out to characterize the microstructure, compositions, and phases formed through the interdiffusion and oxidation in the bulk as well as at the surface of the film stack.
(a) Schematic structure designed for the study at the CdS/CdTe interface: Glass/FTO/CdS/CdTe/CdS. (b) SEM cross-sectional microstructure of (a). (c) SEM surface morphology of the CdTe film of a Glass/FTO/CdS/CdTe solar cell. (d) Current–voltage characteristic of one of the CdS/CdTe solar cells tested under the AM1.5 condition.

III. RESULTS AND DISCUSSION
Raman scattering spectroscopy is a powerful technique for detecting the atomic vibration modes. The Raman peak position and its line width are sensitive to the change in crystal structure, alloying, and stress in the materials. In this study, both in situ and ex situ Raman scattering was used to detect the interdiffusion at the CdS/CdTe interface. The ternary alloy CdSxTe1−x exhibits a “two-mode” behavior with CdS- and CdTe-like longitudinal optic phonon (LO) modes.Reference Fischer, Feng, Bykov, Contreras-Puente, Compaan, Castillo-Alvarado, Avendano and Mason10 This “two-mode” behavior provides two “independent” LO modes, namely the CdS- and the CdTe-like LO, to study the interdiffusion reaction at the interface. A standard CdTe solar cell has a superstrate configuration of Glass/TCO/CdS/CdTe/back contact. To use the Raman scattering to study the interdiffusion at the CdTe/CdS interface, in this study, we deposited a 35-nm-thick CdS layer on top of a CdTe solar cell structure, which is schematically shown in Fig. 1(a). The structure was designed on the basis of the following reasons: (i) The Raman signal from the CdS LO mode is much stronger than that of the CdTe layer, and it has a large softening towards the CdTe LO vibration mode upon alloying with Te when interdiffusion reaction occurs. Therefore, the shifts in the Raman peak caused by the interdiffusion can be easily detected and used to qualitatively study the interdiffusion; (ii) The CdTe LO Raman peak is weak and almost independent on the incorporation of the S.Reference Fischer, Feng, Bykov, Contreras-Puente, Compaan, Castillo-Alvarado, Avendano and Mason10 The change in inter-atom force constants due to the replacement of Te by S is relatively small; (iii) A standard CdTe solar cell has an absorber CdTe layer with thickness of ∼6–10 μm stacked on top of the window CdS layer. The Raman signal from the underlying CdS layer is absorbed by such a thick CdTe layer. Also, such a thick CdTe absorber makes XRD from the interface undetectable.
Figure 1 shows the structure designed for the interdiffusion study [Fig. 1(a)] and the CdTe solar cell microstructures used as the template for the CdS top layer deposition. Figure 1(b) shows the SEM cross-sectional microstructures of the structure shown in Fig. 1(a). Figure 1(c) shows the SEM surface morphology of a CdTe layer on which the 35-nm-thick CdS was deposited. It can be seen that the CdTe used in this study is of high crystalline quality. The CdTe layer grown on the Glass/TCO/CdS template consists of densely packed CdTe crystal with grain size of ∼0.5–2 μm. Pinholes were not observed in the CdS/CdTe stack templates. This is very important for obtaining reliable evaluation of the interdiffusion between CdS and CdTe. The high crystalline quality was further confirmed by the high CdTe solar cell efficiencies achieved in our laboratory. Figure 1(d) shows a solar cell efficiency of 13.0% tested on one of the solar cells prepared in our laboratory and a very high short circuit current of 24.6 mA/cm2. The high short circuit current is attributed to the densely packed high crystalline CdTe quality, the thin CdS window layer, and the highly transparent TCO glass, which has a thickness of 2.2 mm and a transmittance of >90% from 400 to 700 nm. The Glass/TCO/CdS/CdTe templates used in this study were prepared on the basis of the cell fabrication process, which routinely produced cells with efficiency higher than ∼10%. On top of a Glass/TCO/CdS/CdTe template, one 35-nm-thick CdS layer was deposited by CBD, and then a thin CdCl2 layer was spin-coated on the CdS with a saturated CdCl2–methanol solution before the sample was transferred into a tube furnace for heat treatment in air or in Ar-protective atmosphere. This thin CdCl2 layer was found to protect the CdS layer from oxidation during annealing and promoted the interdiffusion of S and Te at the CdS/CdTe interface.Reference Krishna and Dutta4
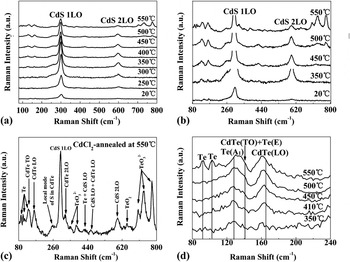
Figure 2(a) shows the Raman spectra in a large scale from 80 to 800 cm−1 recorded at room temperature after the samples were annealed at different temperatures. It can be seen that below ∼300 °C, only the CdS 1LO and its overtone 2LO were observed. Any Te-related Raman signals, including that from the polycrystalline Te and the Cd–Te bonding, were not detected below ∼300 °C. This indicates that the Te-related Raman scattering was weak and absorbed by the thin top CdS layer, even though the laser-light intensity, which reached through the top CdS layer to the underlying CdTe, was still high. It is interesting to note that both the CdS 1LO and 2LO peaks reached their highest intensities at ∼350 °C and then decreased with increase in the heat treatment temperature. The detailed information about the CdS 1LO is shown in Fig. 4. The as-deposited CdS 1LO and 2LO have shifts of 302 and 598 cm−1, which are slightly lower than the bulk values of 305 and 610 cm−1, respectively.Reference Litran, Alcantara, Blanco and Ramirez-Del-Solar11 These slight shifts to lower frequency might be attributed to the size effect.Reference Chuu, Dai, Hsieh and Tsai12 The as-deposited film consists of uniform clusters of ∼20 nm [Fig. 3(a)]. This cluster size is about two times that of the CdS deposited on the Glass/TCO template, which has a cluster size of ∼10 nm. The larger cluster size of the CdS layer deposited on top of CdTe may be attributed to the micrometer or sub-micrometer-sized CdTe grains and the atomic flat CdTe facets on which the nucleation was easier than on TCO of nanometer-sized oxides. Also, both the CdS and the CdTe are II–VI compounds, which have similarity in chemical bonding. This may be another reason for the larger cluster size in the as-deposited CdS film on the Glass/TCO/CdS/CdTe template.
(a) Raman spectra recorded at room temperature after the samples were annealed at different temperatures; (b) Raman spectra of (a) shown in details in a large scale; (c) Raman spectra of the sample annealed at 550 °C; (d) Raman spectra shown in details in the range of 80–240 cm−1.

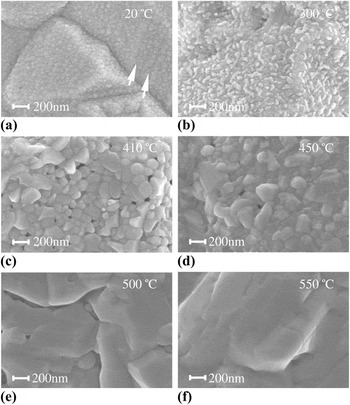
SEM surface morphology of the samples annealed at different temperatures.

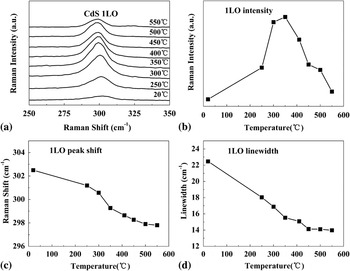
The Raman spectra of the CdS 1LO shown in details: (a) the CdS 1LO Raman peak; (b) the CdS 1LO Raman peak intensity versus the annealing temperature; (c) the CdS 1LO Raman peak shift versus the annealing temperature; (d) CdS 1LO Raman linewidth versus the annealing temperature.

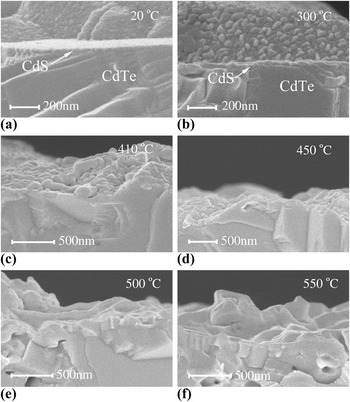
The most interesting observation is that both the 1LO and the 2LO intensities had maxima at ∼350 °C and then they decreased rapidly on increasing the heat treatment temperature. Apparently, the rapid decrease in Raman scattering was caused by the interdiffusion at the CdS/CdTe interface. The temperature of ∼350 °C is coincident with the CdS phase transformation from the cubic to the hexagonal structure. To investigate the CdS phase transformation and the related rearrangement of the neighboring atoms in the CdS clusters, we deposited a CdS film by CBD on Glass/TCO and investigated the structure transformation during the heat treatment by in situ Raman scattering. We found that coating the CdS film with a thin CdCl2 layer protected it from oxidation during annealing in air and promoted the formation of ClS and V Cd point defects in CdS. The antioxidation was attributed to the incorporation of a significant amount of Cl and the formation of ClS, which prevented the oxygen in-diffusion and therefore the chemical incorporation. The antioxidation at the nanocrystalline surface and the point defects formed are beneficial and promoted coalescence of the neighboring clusters without the need of long-range redistribution of the atoms. The phase transformation began to occur at a relatively low temperature of ∼300 °C. The antioxidation and homogeneous hexagonal phase formation led to significant grain growth of CdS films. The observation of phase transformation at ∼300 °C was also confirmed by the work of Angel et al.Reference Zelaya-Angel, Castillo-Alvarado, Avendailo-Lopez, Escamilla-Esquivel, Contreras-Puente, Lozada-Morales and Torres-Delgado13–Reference Krishna and Dutta14 Both the CdS layers deposited on Glass/TCO and on Glass/TCO/CdS/CdTe formed large crystals above the transformation temperature. Figure 3 shows the surface morphology of the as-deposited CdS [Fig. 3(a)] and that of the CdS annealed at different temperatures. We can observe from Fig. 3(a) that all the CdTe crystalline facets were uniformly covered by the CBD-grown CdS layer. At some places, which are indicted by the arrows in Fig. 3(a), the CdS clusters were aligned along the CdTe growth terraces. These terraces were formed because of the presence of stacking faults in CdTe. After annealing at 300 °C, the as-deposited CdS film formed bumps of ∼50-nm size as shown in Fig. 3(b). After annealing at 410 °C ,the as-deposited 20-nm-sized clusters coalesced to ∼50–150 nm micrograins as shown in Fig. 3(c). The CdS 1LO linewidth decreased on increasing heat treatment from ∼22 to 14 cm−1 [Fig. 4(d)], indicating an improved crystalline quality and a larger crystalline size, which was confirmed by the dramatic surface morphology change as shown in Figs. 3(e) and 3(f). At higher temperatures, the CdS layer, on the one hand, coalesced laterally and, on the other hand, interdiffused vertically and reacted with CdTe. After annealing at temperatures higher than 500 °C, the CdS can hardly be identified as shown in Figs. 3(e) and 3(f) and the cross-sectional SEM shown in Fig. 5.
SEM cross-sectional microstructures of the CdS/CdTe interface after the samples were annealed at different temperatures. (a) and (b) The CdS/CdTe interface can be clearly identified. After heat treatment at a temperature higher than that of 410 °C, the CdS/CdTe interface could no longer be identified.

As discussed earlier, the CdS LO had a frequency softening on alloying with Te. The 1LO peak of the as-deposited CdS shifted from 302.4 to 297.9 cm−1 for the as-deposited and the 550 °C heat-treated CdS, respectively. From 20 to ∼250 °C, there was only a change of about 1 cm−1 in the 1LO frequency. The ternary alloy CdSxTe1–x has a miscibility gap extending from x = 0.16 to 0.86 at 650 °C.Reference Ohata, Saraie and Tanaka15, Reference Nunoue, Hemmi and Kato16 At a lower temperature of 400 °C, the miscibility gap becomes wider from x = 0.059 to 0.97.Reference Fischer, Anthony and Compaan6 The energy gap of CdSxTe1–x remains direct throughout the miscibility gap. Upon alloying with Te, the CdS-like 1LO peak shifts almost linearly to the end alloy CdTe-like LO.Reference Fischer, Feng, Bykov, Contreras-Puente, Compaan, Castillo-Alvarado, Avendano and Mason10 On the other hand, the CdTe-like LO mode only slightly decreases even upon a considerable incorporation of S.Reference Fischer, Feng, Bykov, Contreras-Puente, Compaan, Castillo-Alvarado, Avendano and Mason10 In this study, we used the CdS-like 1LO shift to roughly estimate the interdiffusion at the CdS/CdTe interface. The Raman shift not only changes with chemical composition but also changes with stress present in the lattice, phonon confinement effect, and alloying broadening.Reference Fischer, Feng, Bykov, Contreras-Puente, Compaan, Castillo-Alvarado, Avendano and Mason10, Reference Wang, Zhao, Chen and Zhu17 Also, the interdiffusion of S/Te into the CdTe/CdS layers has a concentration distribution away from the interface. In the case of CdS, it was reported that the shape and position of the Raman peaks exhibited only a weak dependence on crystal size even for the two extreme cases of bulk and nanostructures.Reference Zeiri, Patla, Acharya, Golan and Efrima18 It was also reported that the CdS 1LO peak did not undergo any shift after heat treatment.Reference Prabhu and Khadar19 We can see from Fig. 3(b) that, after 300 °C heat treatment, the 35-nm-thick CdS layer was not a continuously connected thin film. After higher annealing temperatures, the CdS thin layer was almost consumed up through interdiffusion and could no longer be identified as discussed earlier. In such a case, we neglect the Raman peak shift owing to the stress present in the film. We take the change in CdS 1LO shift to be induced only by alloying upon the in-diffusion of Te. This assumption is reasonable as discussed by the results presented in the following paragraphs. The Raman peak change of 4.5 cm−1 for the CdS 1LO corresponds to an alloying of 11% Te in the CdS. This alloy composition is between the miscibility gaps of 16% and 5.9% at temperatures of 650 and 400 °C as discussed earlier. The highest heat treatment temperature in this study was 550 °C. This temperature is just between 650 and 400 °C. This conclusion was further confirmed by the XRD results as discussed later. It should be pointed out that the above estimation of 11% Te diffused into the CdS was not the uniform Te concentration in the CdS layer. Rather, it presents the highest concentration detected in CdS. Any diffusion has a concentration distribution away from the diffusion source. It is also noted that the asymmetric broadening of the CdS 1LO spectra at the low frequency side was observed in the as-deposited samples and in all the heat-treated samples. This phenomenon has been interpreted as due to the effects such as confinement-induced relaxation of the q = 0 selection rule during Raman scattering process, the presence of surface phonons, and disorder-induced zone-edge phonon.Reference Wang, Zhao, Chen and Zhu17, Reference Ingale and Rustagi20, Reference Hwang and Park21
For a detailed information, Fig. 2(a) is replotted in Figs. 2(b)–2(d) in a larger scale. Below a heat treatment temperature of ∼250 °C, only the CdS 1LO and its first overtone 2LO were observed. Above ∼350 °C, Raman scattering from Te and CdTe began to be observed. Clearly, the observation was enabled by the thinning of the CdS layer through recrystallization and interdiffusion. Figure 3(b) shows that the original uniform CdS layer recrystallized to form ∼50 nm clusters or bumps, leaving the CdTe surface no longer continuously covered by the CdS layer. The Te detected by the Raman scattering in samples after heat treatment at relatively low temperatures existed as precipitates in CdTe, which were formed during the CdTe film deposition. Te precipitates exist as nanocrystallines in a random distribution in CdTe,Reference Rodriguez, Zelaya-Angel, Perez Bueno, Jimenez-Sandoval and Tirado22 and it has at least two orders of magnitude larger scattering cross sections compared to that of CdTe. So the comparable Raman intensity of Te and CdTe observed after 450 °C heat treatment does not necessarily mean a comparable material content for Te and CdTe in the film. After annealing at 550 °C, another two Te Raman peaks located at 92 and 102 cm−1 were observed, indicating that a larger amount of Te existed both within and on the surface of the film stack. At this temperature, most of the Te detected came from the CdTe decomposition. After annealing at 550 °C, higher order Raman spectra for both the CdTe 2LO at 325 cm−1 and the 2ν 4(E) mode from the TeO32− ion at 777 cm−1 were observed. Combination phonons of Te + CdS 1LO at 425 cm−1, CdS 1LO + CdTe 1LO at 460 cm−1, and CdS 1LO + CdTe 2LO at 628 cm−1 were also observed as shown in Fig. 2(c). For the combination phonon of CdS 1LO + CdTe 1LO, its intensity is strong only for sample with comparable content of Te and S. The observation of this combination phonon indicates that a considerable interdiffusion occurred at the CdS/CdTe interface and this conclusion is consistent with the above discussed estimation of a 11% Te diffusion into CdS. The observation of combination phonon modes suggests that through interdiffusion and its related reaction, relatively large and good quality crystalline CdSxTe1–x had formed. Figure 5 shows the cross-sectional SEM images of the samples whose surface morphologies are shown in Fig. 3. We can see that for samples heat treated at a temperature of 450 °C and above, the CdS/CdTe interface can no longer be identified and large crystalline grains were formed at the top of the film stack. The crystalline grains located near the top of the film stack are the CdSxTe1−x alloy formed through interdiffusion reactions. The observation of combination phonon modes implies that (i) the CdSxTe1–x alloy formed near the film stack surface was well mixed with Cd–S and Cd–Te bonds, so that the vibrations related to different bonds could be correlated and combination modes could be detected; (ii) two sublattices existed in the CdSxTe1–x alloy, one consisting of Cd atoms only and the other consisting of S and Te atoms in a random arrangement.Reference Fischer, Feng, Bykov, Contreras-Puente, Compaan, Castillo-Alvarado, Avendano and Mason10 Below ∼300 °C, the metallurgical CdS/CdTe interface can be clearly observed as shown in Figs. 5(a) and 5(b). At 410 °C, the interface smeared out and relatively larger crystalline grains are formed.
The main bands at higher frequency more than 640 cm−1 were from the TeO32− ion, whose Fermi doublet peaks, namely the ν 3(E) and the overtone 2ν 4(E) modes, were located at 733 and 777 cm−1, respectively. The first-order scattering of ν 4(E) at 383 cm−1 was also clearly observed for the heat-treated sample at a temperature of 550 °C as shown in Fig. 2(c). The peak at 646 cm−1 was from the paratellurite TeO2.Reference Pine and Dresselhause23 The combination phonon mode of Te + CdS 1LO at 425 cm−1 began to appear after ∼400 °C heat treatment [Figs. 2(b) and 2(c)]. Its Raman peak intensity reached a maximum at ∼500 °C and then decreased at 550 °C. The decrease in the Raman scattering intensity was caused by the consuming up of CdS through interdiffusion. The intensity of the local mode of S in CdTe located at 258 cm−1 also decreased at 550 °C due to the same reason.
The CdTe 1LO Raman signal is weak compared to that of the CdS 1LO. The CdTe 1LO shifts slightly to lower frequency upon alloying with S as indicated by the line in Fig. 2(d). As discussed earlier, when the film stack was heat treated at high temperatures, CdS was consumed up through interdiffusion, leaving the underlying CdTe exposed directly to the laser source. This makes possible to detect the shift in the CdTe 1LO peak. We observed this shift when the film stack was heat treated at temperatures higher than ∼400 °C as shown in Fig. 2(d). Through the CdTe 1LO shift of 1.8 cm−1 from 410 °C to 550 °C, we can roughly estimate the S composition to be ∼9% in the Te-rich CdSxTe1–x alloy.
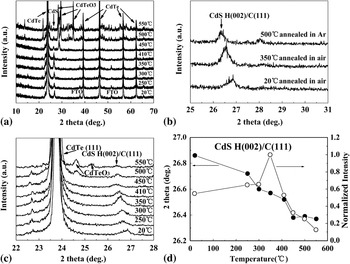
The above observations and estimations drawn by the Raman experimental results were confirmed by the high-resolution XRD as shown in Fig. 6. The intensity of the CdS H(002)/C(111) peak at 26.8° after heat treatment showed a similar behavior as that of the Raman 1LO mode, namely, its intensity reached a maximum value at a temperature of about 350 °C and then decreased by increasing heat treatment temperatures [Fig. 6(d)]. The increase in intensity from 20 to 350 °C was due to the increased crystalline quality and increased grain size as shown in Figs. 3 and 5. The decrease in intensity at temperatures higher than 350 °C was caused by the CdS consuming up through interdiffusion. With the increase in heat treatment temperatures, the CdS H(002)/C(111) XRD peak shifted to lower diffraction angle due to the in-diffusion of Te, which has a larger atom radii than S. Using the Vegard’s law and the CdS H(002) XRD peak shift upon alloying, Te atomic composition diffused into CdS layer was calculated to be 11%. This composition is exactly the same as that estimated by the Raman CdS 1LO peak shift. When the heat treatment temperature was higher than ∼500 °C, the film stack began to be oxidized. The main oxide observed was CdTeO3. We annealed one film stack in the Ar-protective atmosphere at 500 °C, whose spectrum is shown in Fig. 6(b). Compared with the spectrum in Fig. 6(a), we can see that almost all the additional peaks after annealing at temperatures higher than 500 °C, including both strong and weak diffraction peaks, were from the oxide CdTeO3. This conclusion is again consistent with the observed strong Raman peaks of the TeO32− ion at ∼700–800 cm−1 as shown in Fig. 2.
(a) X-ray diffraction of the samples annealed at different temperatures; (b) and (c) x-ray diffraction in details; (d) the CdS(002)/(111) peak position and intensity versus the annealing temperature.

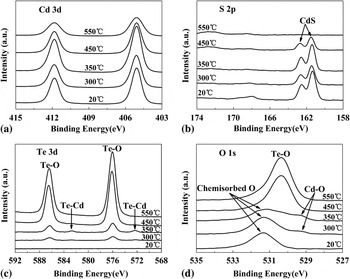
Figure 7 shows the XPS spectra for a CdS/CdTe film stack after annealing at different temperatures. The two Cd 3d peaks in Fig. 7(a) are from the spin-orbit splitting of 6.7 eV between the Cd 3d5/2 and the Cd 3d3/2 states. The binding energies of the S 2p3/2 and S 2p1/2 peaks for the as-deposited film are 161.3 and 162.5 eV [Fig. 7(b)], respectively, which agrees well with the reported spin-orbit energy splitting of 1.2 eV.Reference Khallaf, Chai, Lupan, Chow, Park and Schulte24 Again similar to the results of the Raman and XRD experiments, the XPS intensity for S reached a maximum after annealing at a temperature of 350 °C. With increased annealing temperature, the S peaks of the CdS compound became weak and could no longer be detected at a temperature of 550 °C, indicating that there was almost no CdS compound left near the surface within the XPS detectable depth of ∼10 nm. All S in the 35-nm CdS layer diffused into CdTe. The Te 3d core-level binding energy is shown in Fig. 7(c). The peaks at 576 and 586.4 eV are the binding energies of Te 3d5/2 and Te 3d3/2 in Te–O bond.Reference Feng, Chou, Rohatgi, Lim, Wee and Tan3 At a temperature of 300 °C, two Te–O peaks were observed. These two peaks were detectable from the exposed CdTe surface. The CdTe layer was exposed to air after the top CdS layer was re-crystallized to form uncontinuously connected film as shown in Fig. 3(b). The oxygen in the Te–O bond came from the CdTe preparation process, in which oxygen and Ar were added into the growth chamber during the sublimation. After annealing at 350 °C, the two weak peaks at 572.4 and 582.8 eV, which correspond to the binding energies of Te 3d5/2 and Te 3d3/2 in the Te–Cd bond, were detected,Reference Bartolo-Perez, Castro-Rodriguez, Caballero-Briones, Cauich and Pena25 indicating that the surface of the CdTe was exposed to air and Te began to diffuse into the CdS cover layer. At 450 °C, the intensity of the two peaks corresponding to the Te–O bond increased significantly. This means that a lot of Te atoms diffused into CdS between 300 and 450 °C and then oxidized to form oxides. At 550 °C, the atom ratio of Cd:Te:O measured by the XPS intensity was 1:1:3, indicating the formation of the CdTeO3 compound. This result is consistent with that observed by both the Raman and the XRD. Figure 7(d) presents the binding energy of the O 1s peaks. The peak at 531.3 eV was related to the chemically adsorbed surface O atoms on CdS.Reference Niles, Herdt and Jassim26, Reference Nair, Nair, Zingaro and Meyers27 The shoulder at 529.4 eV is attributed to the Cd–O bond,Reference Hammond, Gaarenstroom and Winograd28 which was the oxidation product of CdS with oxygen above a temperature of about 300 °C. But we believe, the oxidation at this temperature is very weak and occurred only at the surface of the film. Above 450 °C, the chemically adsorbed O atoms and those in the Cd–O bond almost disappeared, and only relatively strong Te–O bonds at 530.4 eV was observed.Reference Charton, Gengembre and Armand29 Most of the Te–O bonds came from the CdTeO3 in the form of TeO32−.
XPS survey spectra of the samples annealed at different temperatures: (a) Cd 3d peak; (b) S 2p peak; (c) Te 3d peak; (d) O 1s peak.

We fabricated CdTe solar cells with CdCl2 heat treatments at different temperatures to study the influence of the interdiffusion at the CdS/CdTe interface on the cell performance. A CdCl2 layer was coated on the CdTe absorption layer, and then the cell structures were heat treated in air at 300, 350, and 400 °C for 15 min, respectively. The open-circuit voltages measured were 667, 685, and 745 mV; the short-circuit currents were 20.8, 20.8, and 24.6 mA/cm2; the fill factors were 57.4, 58.0, and 70.6%; and the cell efficiencies were 7.98, 8.28, and 13.0% for the cells annealed at 300, 350, and 400 °C, respectively. We can see that the solar cell performance improved significantly after annealing at a temperature of 400 °C, indicating that a high quality interface CdS/CdTe was formed through interdiffusion at a temperature of 400 °C.
IV. CONCLUSIONS
The inverted CdTe solar cell structure, namely, a 35-nm-thick CdS layer was deposited on the surface of a CdTe solar cell structure, which allowed us to obtain strong scattering signals of the Raman, XRD, and XPS from CdS and from CdS/CdTe interface. Experimental results of the Raman scattering, XRD, SEM, and XPS are all consistent with each other. Strong interdiffusion began to occur at a temperature of about 350 °C at the CdS/CdTe interface. This temperature point coincides with the CdS phase transformation from the cubic to the hexagonal phase. Both the Raman and XRD spectra showed maximum intensity at this temperature. Above a temperature of about 400 °C, the CdS layer began to be quickly consumed up through interdiffusion and reaction with CdTe. After heat treatment at a temperature of 550 °C, considerable interdiffusion of S and Te occurred to form S-rich and Te-rich CdSxTe1–x alloy, respectively. The main oxidation compound was found to be CdTeO3 when the film stack was annealed in air atmosphere.
ACKNOWLEDGMENTS
This work was financially supported by the National Natural Science Foundation of China (Nos. 60876047 and 60976054) and the Solar Energy Action Project of Chinese Academy of Sciences (No. 173101240).